Fig. 6
Download original image
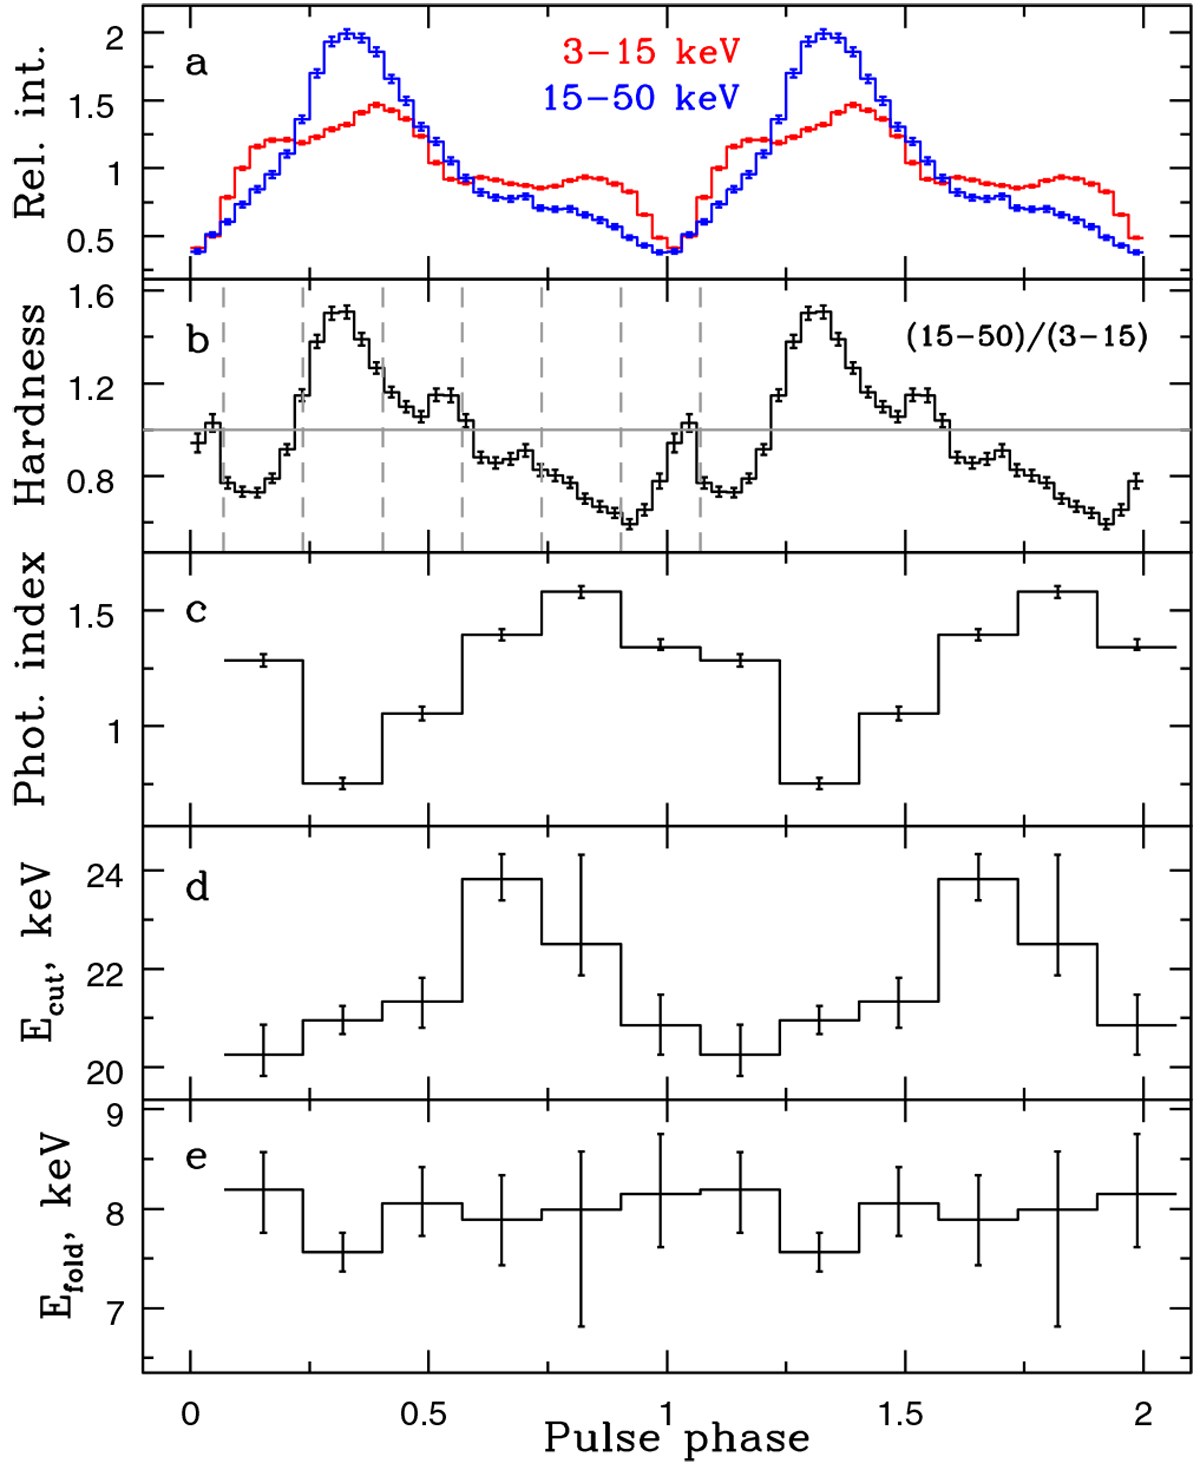
Results of the pulse phase-resolved spectral analysis of MAXI J0903–531 using the NuSTAR data in the bright state. To illustrate the spectral variations over the pulse phase, the normalised pulse profiles in 3–15 keV and 15–50 keV bands and their ratio are shown in panels a and b, respectively. Panels c, d, and e show the behaviour of the photon index, cutoff, and folding energies, respectively.
Current usage metrics show cumulative count of Article Views (full-text article views including HTML views, PDF and ePub downloads, according to the available data) and Abstracts Views on Vision4Press platform.
Data correspond to usage on the plateform after 2015. The current usage metrics is available 48-96 hours after online publication and is updated daily on week days.
Initial download of the metrics may take a while.