Fig. 5
Download original image
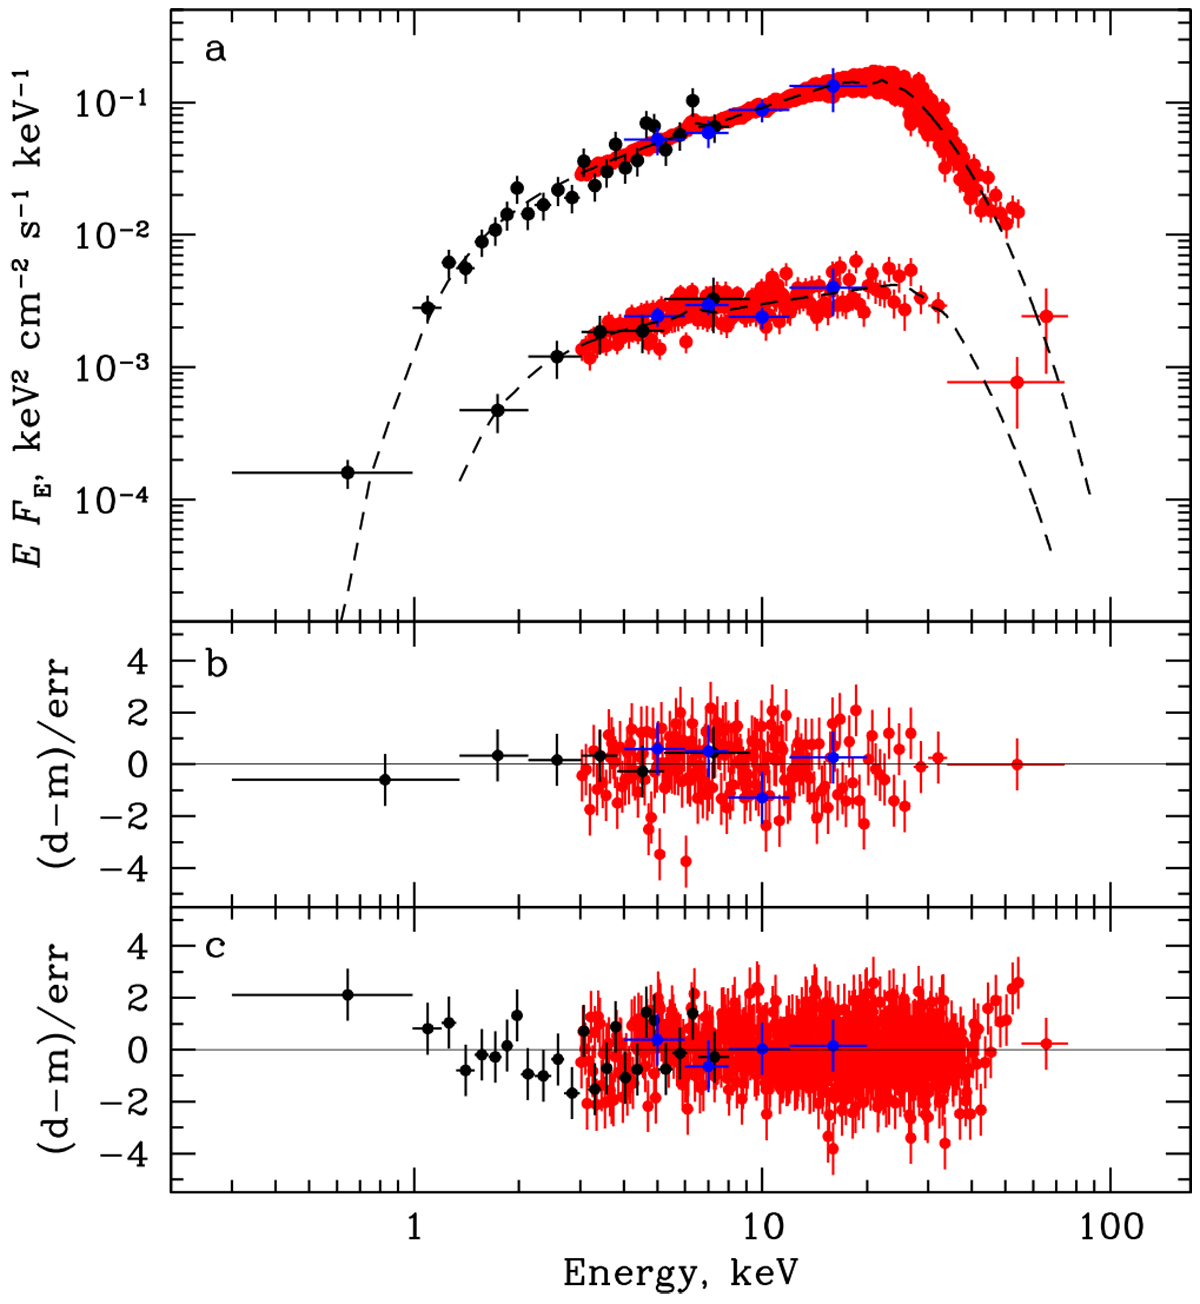
Unfolded energy spectra of MAXI J0903–531 in different states. The luminosity varies by a factor of ~30 (panel a). The black, red, and blue points correspond to the Swift/XRT, NuSTAR, and SRG/ART-XC data, respectively. Data from two NuSTAR modules are combined for illustrative purposes only. The dashed lines represent the best-fitting models listed in Table 3. The corresponding residuals for the low- and high-luminosity states of MAXI J0903–531 are presented in panels b and c, respectively.
Current usage metrics show cumulative count of Article Views (full-text article views including HTML views, PDF and ePub downloads, according to the available data) and Abstracts Views on Vision4Press platform.
Data correspond to usage on the plateform after 2015. The current usage metrics is available 48-96 hours after online publication and is updated daily on week days.
Initial download of the metrics may take a while.