Fig. 1
Download original image
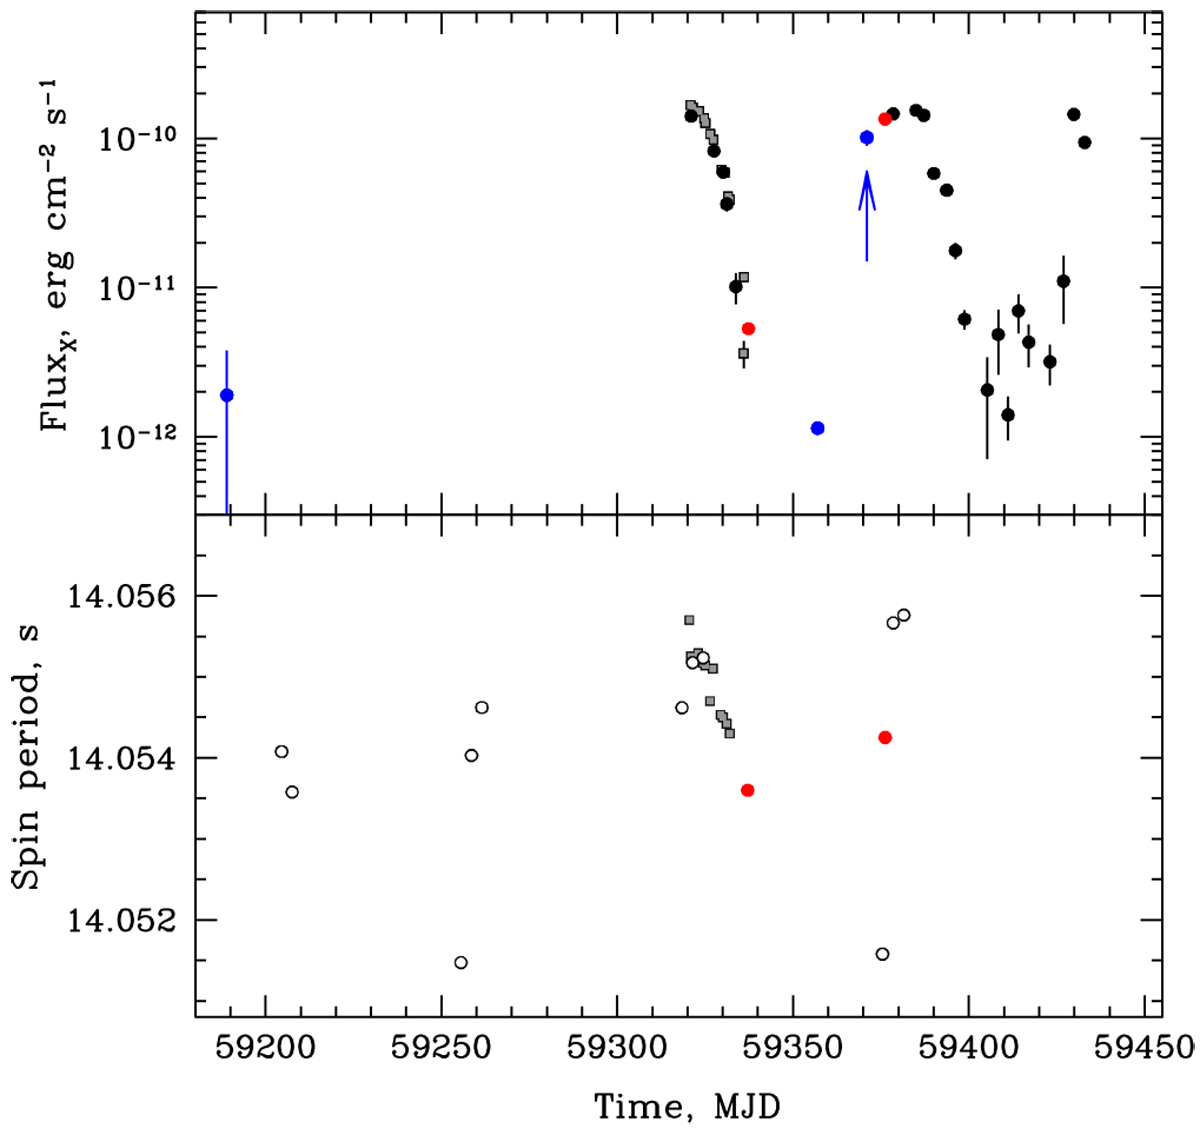
Light curve of MAXI J0903–531 from the all available data (top). An observed flux is given in the 0.5–10 keV energy band for Swift/XRT (black) and NICER (grey), and in the 4–12 keV for SRG/ART-XC (blue) and NuSTAR (red). Bottom: baricentre-corrected spin period of the pulsar obtained from Fermi/GBM (open circles), NICER (grey), and NuSTAR (red).
Current usage metrics show cumulative count of Article Views (full-text article views including HTML views, PDF and ePub downloads, according to the available data) and Abstracts Views on Vision4Press platform.
Data correspond to usage on the plateform after 2015. The current usage metrics is available 48-96 hours after online publication and is updated daily on week days.
Initial download of the metrics may take a while.