| Issue |
A&A
Volume 661, May 2022
The Early Data Release of eROSITA and Mikhail Pavlinsky ART-XC on the SRG mission
|
|
|---|---|---|
| Article Number | A16 | |
| Number of page(s) | 17 | |
| Section | Extragalactic astronomy | |
| DOI | https://doi.org/10.1051/0004-6361/202141641 | |
| Published online | 18 May 2022 | |
The eROSITA Final Equatorial-Depth Survey (eFEDS)
Presenting the demographics of X-ray emission from normal galaxies
1
NASA Goddard Space Flight Center,
Code 662,
Greenbelt,
MD
20771,
USA
e-mail: nvulic@uwo.ca
2
Department of Astronomy, University of Maryland,
College Park,
MD
20742-2421,
USA
3
Center for Research and Exploration in Space Science and Technology, NASA/GSFC,
Greenbelt,
MD
20771,
USA
4
Eureka Scientific, Inc.,
2452 Delmer Street, Suite 100,
Oakland,
CA
94602-3017,
USA
5
Department of Physics and Astronomy, Johns Hopkins University,
3400 N. Charles Street,
Baltimore,
MD
21218,
USA
6
Max-Planck-Institut für extraterrestrische Physik,
Gießenbachstraße 1,
85748
Garching,
Germany
7
Department of Physics, University of Maryland Baltimore County,
Baltimore,
MD
21250,
USA
8
Physics Department & Institute of Theoretical & Computational Physics, University of Crete,
71003
Heraklion,
Crete,
Greece
9
Harvard-Smithsonian Center for Astrophysics,
60 Garden Street,
Cambridge,
MA
02138,
USA
10
Institute of Astrophysics, Foundation for Research and Technology-Hellas,
GR-71110
Heraklion,
Greece
11
Dr. Karl Remeis-Observatory and Erlangen Centre for Astroparticle Physics, Friedrich-Alexander-Universität Erlangen-Nürnberg,
Sternwartstr. 7,
96049
Bamberg,
Germany
12
Department of Physics and Astronomy, University of Southampton,
Southampton
SO17 1BJ,
UK
13
Leibniz Institut für Astrophysik,
An der Sternwarte 16,
14482
Potsdam,
Germany
14
Institut für Astronomie und Astrophysik Tübingen, Universität Tübingen,
Sand 1,
72076
Tübingen,
Germany
Received:
25
June
2021
Accepted:
21
September
2021
Context. The eROSITA Final Equatorial Depth Survey (eFEDS), completed in survey mode during the calibration and performance verification phase of the eROSITA instrument on Spectrum Roentgen Gamma, delivers data at and beyond the final depth of the 4-yr eROSITA all-sky survey (eRASS:8), f0.5–2 keV = 1.1 × 10⁻¹⁴ erg s−1 cm−2, over 140 deg2. It provides the first view of normal galaxy X-ray emission from X-ray binaries (XRBs) and the hot interstellar medium at the full depth of eRASS:8.
Aims. We used the Heraklion Extragalactic Catalogue (HECATE) of galaxies to correlate with eFEDS X-ray sources and identify X-ray detected normal galaxies. This flux-limited X-ray survey is relatively free from selection effects and enables the study of integrated normal galaxy X-ray emission and its relation to galaxy parameters such as the stellar mass, star formation rate (SFR), and metallicity.
Methods. We cross-correlated 32 646 eFEDS X-ray sources to 1181 HECATE normal galaxies and obtained 94 matches. We classified galaxies as star-forming, early-type, composite, and active galactic nuclei (AGN) using Sloan Digital Sky Survey (SDSS) and Six-degree Field (6dF) optical spectroscopy.
Results. The eFEDS field harbours 37 normal galaxies: 36 late-type (star-forming) galaxies and one early-type galaxy. There are 1.9 times as many normal galaxies as predicted by scaling relations via simulations, with an overabundance of late-type galaxies and a dearth of early-type galaxies. When compared with empirical relations, eFEDS dwarf galaxies with a high specific SFR have elevated LX/SFR at a fixed specific SFR and metallicity, indicating an increase in XRB emission due to low metallicity. We expect that eRASS:8 will detect 12 500 normal galaxies, the majority of which will be star-forming, with the caveat that there are unclassified sources in eFEDS and galaxy catalogue incompleteness issues that could increase the actual number of detected galaxies over these current estimates.
Conclusions. eFEDS observations detected a rare population of galaxies – the metal-poor dwarf starbursts – that do not follow known scaling relations. eRASS is expected to discover significant numbers of these high-redshift analogues, which are important for studying the heating of the intergalactic medium at high redshift. Further investigation of the hot gas emission from normal galaxies and stochastic effects in the dwarf galaxy population are required to constrain their X-ray output.
Key words: surveys / galaxies: starburst / galaxies: dwarf / galaxies: statistics / X-rays: galaxies / X-rays: binaries
© ESO 2022
1 Introduction
Understanding the nature of X-ray emission from normal galaxies, that is, galaxies without an active galactic nucleus (AGN), is critically important for several reasons. First, much of this X-ray emission arises from accretion onto compact objects, with the dominant accreting compact object population, in the absence of an accreting super-massive black hole (SMBH), consisting of neutron stars (NS) and stellar-mass black holes (BH). Accreting NS and BH uniquely trace the endpoints of massive star formation and are observable as X-ray binaries (XRBs). In addition to including the progenitor population for gravitational waves detected by, for example, the advanced laser interferometer gravitational-wave observatory (LIGO, Abbott et al. 2019), the collective X-ray output from XRBs can rival that of an accreting SMBH (AGN) at the critical epochs of reionisation and Cosmic Dawn (6 ≲ z ≲ 20) when the first galaxies in the Universe were forming (Fragos et al. 2013; Mesinger et al. 2014; Pacucci et al. 2014). These lower-mass accreting systems effectively ‘outshine’ their SMBH counterparts, possibly playing a significant role in heating the primordial intergalactic medium (Madau & Fragos 2017). Given the difficulty of directly observing X-ray emission at high redshifts, however, it is local studies of X-ray emission from galaxies that give us the best chance to characterize this emission.
Much of the X-ray emission from the most massive normal galaxies (preferentially early-types) arises from the astrophysically important hot phase of the Interstellar Medium (ISM) in galaxies (Boroson et al. 2011). The thermal structure of the ISM gives key information about various physical processes affecting galaxy evolution (e.g. Kim & Fabbiano 2015). Hot gas properties are expected to differ based on, for example, mergers, ram-pressure stripping, and both AGN and stellar feedback. Additionally, there is a long-standing prediction that galaxies should contain hot gaseous halos, the Circumgalactic Medium (CGM). While there have been some individual detections of bright instances of such halos (Bogdán et al. 2013; Li et al. 2017) around spiral galaxies, detecting such X-ray emission from a large sample of spiral galaxies remains elusive.
All of our current understanding of X-ray emission from normal galaxies, however, is based on relatively small numbers of galaxies as compared to the powerhouse wide-field surveys in the optical and infrared (IR) such as the Sloan Digital Sky Survey (SDSS). The treasure trove of galaxy information in SDSS, for example, is contained within a population with peak distance z ~ 0.07 (d ~ 315 Mpc). What is thus needed is an X-ray survey scanning thousands of square degrees with sensitivity to galaxies at those sorts of distances. The eROSITA All Sky Survey (eRASS) provides this sensitivity over a wide area for detecting normal galaxies (Basu-Zych et al. 2020). In eRASS, eROSITA, which is the 0.3–10 keV X-ray instrument aboard the Spectrum Roentgen Gamma observatory, will cover the entire sky to moderate depth and at moderate angular resolution1 (~10−14 erg cm−2 s−1 and 26″; see details in Predehl et al. 2021; Merloni et al. 2012). Due to the relative proximity of the galaxies detected in eRASS, the X-ray data may be combined with estimates for the star formation rate (SFR), stellar masses, and metallicities in spatially-resolved galaxies that are better-characterized than high-z populations. Galaxy samples detected in the X-ray band will finally reach much larger numbers (thousands of galaxies versus 10s to 100s) with eRASS:8. Additionally, the eROSITA sample will be free from the selection effects of targeted observations that distort current galaxy samples.
eRASS observations began in 2019 December and will continue through 2023 December, with the full sky scanned every six months for a total of eight iterations of eRASS to reach the final depth (eRASS:1 - eRASS:8). However, during the performance verification (PV) phase of the mission in mid-to-late 2019, the eROSITA Final Equatorial-Depth Survey (eFEDS) was conducted over 140 deg2 at and beyond the ultimate eRASS:8 depth to provide a pilot program for the eRASS survey.
In this paper, we investigate the properties (X-ray emission, SFR, stellar mass, metallicity, and distance) of ~100 galaxies that are part of the Heraklion Extragalactic Catalogue (HECATE), a value-added catalogue containing galaxy properties such as SFRs and stellar masses (Kovlakas et al. 2021). In Sect. 2, we describe the sample selection and source classification. In Sect. 3, we compare observations with the expected detections based on simulations. In Sect. 4, we study the normal galaxy scaling relations based on our results. In Sect. 5, we discuss the implications of our results. We summarise our conclusions in Sect. 6. Throughout the paper, we assume the Kroupa (2001) initial mass function (IMF) for all measured SFRs and stellar masses, and we adjust values from comparison studies where required to conform to a Kroupa IMF. We adopt Lambda cold dark matter (ΛCDM) cosmology with the following parameters: H0 = 70 Mpc km s−1, ΩM = 0.3, ΩΛ = 0.7. For fluxes and luminosities we assumed a power-law spectral model with Γ = 1.7 and median Galactic absorption in the direction of the eFEDS field of Nh = 3.6 × 1020 cm−2. Unless otherwise stated, uncertainties correspond to 90% confidence levels.
2 Sample selection
2.1 eFEDS X-ray sources
The eFEDS field was part of the eROSITA PV phase observations in 2019 November. eFEDS targeted the galaxy and mass assembly (GAMA) survey field G09, centred on a right ascension of 136° (~9h) and declination of 1°4. Four individual rectangular raster-scan fields of ~35 deg2 each were completed for a total exposure of ≈360 ks over 140 deg2. The average exposure time per source was consistent with that expected for eRASS:8, ~2.2 ks. The scans were completed in survey (scanning) mode, which provided a 26″ and 40″ average point spread function (PSF) in the 0.5–2 keV (soft) and 2–10 keV (hard) bands, respectively, over the 0.83 deg2 eROSITA FOV. The X-ray point source sensitivity of eFEDS reached ~7 × 10⁻¹⁵ erg s−1 cm−2 in the soft band (beyond the final depth of eRASS:8, 1.1 × 10⁻¹⁴ erg s−1 cm−2) and ~2 × 10⁻¹³ erg s−1 cm−2 in the hard band (Brunner et al. 2022). We used two eFEDS source catalogues for our analysis, the main (M) catalogue of 27 910 sources with detection likelihoods ≥ 6, and the supplementary (S) catalogue of 4774 sources with detection likelihoods between five and six (Brunner et al. 2022). From the 32 684 X-ray sources (point-like and extended) in these eFEDS catalogues detected in the 0.2–2.3 keV energy band with detection likelihood ≥5 (Brunner et al. 2022), 32 646 with positional error less than 20″ were used as input for matching to galaxies. eFEDS astrometry was corrected using the Gaia-unWISE AGN catalogue of Shu et al. (2019), resulting in astrometric precision of ≈5″ in the eFEDS X-ray catalogue, depending on the number of counts and energy band. Fluxes for X-ray sources were computed using a power-law spectral model with an index of Γ = 1.7 (summarised at the end of Sect. 1). Assuming Γ = 2 would decrease fluxes by 2%, a negligible change and comparable to uncertainties. For a more detailed description of eFEDS and the data reduction procedures, please see the catalogue paper (Brunner et al. 2022). In addition, the eFEDS X-ray source catalogue provides multiwavelength photometry from the dark energy spectroscopic instrument (DESI) legacy imaging survey DR8, for the counterparts that were identified in Salvato et al. (2022), using a combination of NWAY (Salvato et al. 2018) paired with machine learning and ASTROMATCH (Ruiz et al. 2018).
2.2 Galaxy catalogue
We used the HECATE value-added galaxy catalogue compiled by Kovlakas et al. (2021), which includes all galaxies (object type ‘G’) within D ≲ 200 Mpc (z ≲ 0.045) from the HyperLEDA database (Makarov et al. 2014). The object type (‘G’) excludes regions in intracluster or group environments, ensuring we do not include galaxies with X-ray emission that might be dominated by hot gas from the intracluster or group environment instead of intragalaxy ISM and XRBs. HECATE also provides positions, sizes, morphological classifications, redshifts, distances, SFRs, stellar masses, and nuclear activity classifications, where available in the literature. In addition, all HECATE galaxies have coordinates with astrometric precision of <10″, and ~92% have precisions of <1″. For details regarding value-added parameter estimates please see Kovlakas et al. (2021). By cross-correlating the HECATE catalogue with the eFEDS footprint, we identified 1181 galaxies. Due to the incompleteness of multiwavelength parameters, only 409 of these galaxies have both SFR and stellar mass estimates from HECATE.
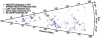 |
Fig. 1 Cosmological slice showing the distribution of HECATE galaxies in the eFEDS field (black points). The eFEDS-HECATE matches are subdivided into early-type (red plusses) and late-type (blue diamonds) galaxies, which have been classified solely based on a cut in specific SFR (sSFR), and does not necessarily indicate the nature of the X-ray source emission (e.g. normal star-forming or elliptical galaxy, AGN). Those matches without an estimate of sSFR are shown as green crosses. |
2.3 Catalogue matching and source classification
We cross-matched the eFEDS X-ray source and HECATE galaxy catalogues using STILTS (Taylor 2006), which is a tool to process tabular data. Any eFEDS source within the D25 ellipse of a HECATE galaxy was matched using the matcher = skyellipse method. The positional uncertainties for eFEDS X-ray sources (mean of 4.7″ for all sources in eFEDS) were included during matching. This yielded 101 matches with a maximum separation of 47″. Of these, one X-ray source (eFEDS ID 11246) was matched to two unique galaxies (PGC 24658/4532355). We removed one HECATE galaxy matched to eFEDS ID 24454 that was a star-forming region within the main host galaxy that was matched (PGC 25986). We also removed one X-ray source match (eFEDS ID 1286) to PGC 24129 because it was located on the edge of the D25 (likely background AGN), and a better match (eFEDS ID 1284) was coincident with the centre of the galaxy. Finally, we removed five matches that were coincident with foreground stars (confirmed via SDSS spectroscopy and visual inspection), yielding 94 total matches. From these matches, three eFEDS X-ray sources were extended based on their extent likelihood values. We clarify that the eFEDS-HECATE matches represent eFEDS X-ray sources coincident with HECATE galaxies, and do not necessarily represent the unique counterpart (if there is a single point source counterpart as opposed to extended emission derived from multiple X-ray sources in the galaxy), which may or may not be part of the galaxy. For eFEDS X-ray sources with detection likelihoods >6, there are seven eFEDS-HECATE matches (eFEDS ID’S 2671, 7551, 12847, 17437, 20952, 22198, 29989) for which the HECATE galaxy does not coincide with the counterpart to the eFEDS X-ray source that was identified in Salvato et al. (2022). In these seven cases, the centroid of the counterpart assigned in Salvato et al. (2022) is up to 49″ (median of 22″) from the centre of the HECATE source but still within the D25 ellipse. It is unclear yet whether the X-ray emission is from X-ray emitters within the HECATE galaxies or sources in the background (see Fig. A.l of Salvato et al. 2022). In five of these cases, the match assigned by Salvato et al. (2022) is coincident with a spiral arm/structure of the HECATE galaxy, indicating a possible ultraluminous X-ray source (ULX) origin. Follow-up with Chandra and other high-resolution multiwavelength observations will help localize the X-ray sources and constrain the counterpart(s).
Using the value-added parameters from HECATE we can compare the properties of HECATE galaxies in the eFEDS field to those matched to an eFEDS X-ray source. In Fig. 1 we show the cosmological slice representing the eFEDS field, which indicates all HECATE galaxies, the eFEDS-HECATE matches, and early/late-type galaxies (classified only based on a specific SFR (sSFR) cut). The left panel of Fig. 2 shows histograms of HECATE galaxies in the eFEDS field with sSFR estimates (black) and those matched to eFEDS X-ray sources (blue dot-dashed). We also indicate the approximate split between late-type and early-type galaxies at log sSFR = -10.6 yr−1 as in Basu-Zych et al. (2020). Based on this adopted value, the sample is dominated by late-type galaxies (73%), approximately reflecting the cosmological distribution of galaxy types, given the typical stellar mass of the HECATE galaxies in the eFEDS field (median of M* = 1.5 × 10¹⁰ M⊙, whereas eFEDS-HECATE matches have M* = 5 × 10¹⁰ M⊙). For more massive galaxies the fraction of ellipticals would be higher.
We compared between eROSITA-detected sources and available archival data to assess variability. Flux calibration of eROSITA on Spectrum Roentgen Gamma was reported in Dennerl et al. (2020). To investigate archival X-ray data, we cross-matched our eFEDS-HECATE catalogue X-ray positions with the Chandra and XMM-Newton source catalogues. We found six Chandra X-ray sources that matched to five unique eFEDS X-ray sources (eFEDS ID 150 had two matches within ~2″) using the 317 167 unique compact and extended X-ray sources from the Chandra Source Catalogue Release 2.0 (Evans et al. 2020). These matches were all within 10″, consistent with the eROSITA astrometric uncertainty. The 0.5–2 keV fluxes were broadly consistent, showing variability of a factor of two at most. The cross-match with the 575 158 unique X-ray sources in 4XMM-DR10 (Webb et al. 2020) resulted in only one match having 6″ separation. The flux measurements for this match (eFEDS ID 13787) were consistent. A comparison with the XMM-Newton slew survey source catalogue (XMMSL2) resulted in no matches. The handful of targeted Chandra and XMM-Newton observations are short exposures and cover a small fraction of the eFEDS footprint, resulting in the low number of matches. Completion of subsequent eRASS surveys will shed light on the variability (or lack thereof) from normal galaxies.
To study normal galaxies in the eFEDS field, we require robust optical spectroscopic classifications for each galaxy. This was achieved using optical spectra from the SDSS DR8 MPA-JHU catalogue (Kauffmann et al. 2003; Brinchmann et al. 2004; Tremonti et al. 2004), the most recent data release with starlight-subtracted spectra. In particular, identifying any type of nuclear (e.g. AGN) activity was critical for assembling the normal galaxy sample. This enabled us to properly investigate normal galaxy scaling relations based only on the X-ray emission from XRBs and hot gas. We cross-matched each eFEDS-HECATE X-ray position (using the initial 101 matches) with the nearest SDSS DR8 spectrum within 3′. This resulted in 59 matched SDSS spectra. The spectra were all coincident with HECATE galaxy positions except for two that were slightly offset from the galaxy centre by a few arcsec. We initially used the large matching radius of 3′ to encompass all nearby spectra and avoid missing spectra coincident with X-ray sources that were offset from the centres of galaxies. We completed visual inspection of each matched spectrum to confirm that the offset from the centre of the HECATE galaxy was <3″, except in two cases (eFEDS ID 3372 and 22226) where the spectrum was coincident with a star-forming region. The SDSS spectrotype for 57 of the matched SDSS spectra were GALAXY, with the remaining two being STAR and QSO. After removing the sources described above as foreground stars or duplicates that had spectra, we obtained a total of 57 optical spectra for the sample of 94 sources. To classify galaxies, we used the SDSS DR8 subclass identification in combination with the emission-line ratio classification scheme of Stampoulis et al. (2019).
Galaxy classification is critical to separate normal galaxies from those with nuclear activity due to SMBH accretion. For example, the use of Baldwin-Phillips-Terlevich (BPT) diagrams (Baldwin et al. 1981) has become ubiquitous to separate star-forming galaxies from galaxies dominated by AGN activity, and later included low-ionisation nuclear emission regions (LINERs). However, the separation between these different source classes, which is defined using theoretical and empirical curves, is subject to considerable uncertainty, where X-ray detected AGN have been found in the star-forming region (Agostino & Salim 2019; LaMassa et al. 2019). In Fig. 3 we show the BPT diagram for the 57 eFEDS-HECATE sources with SDSS spectra, of which half fall in the star-forming region based on the classification curves. To obtain the probabilities of each classification type (star-forming galaxy, Seyfert, LINER, and composite) for each source we used the code provided by Stampoulis et al. (2019) and their clustering prescriptions from their Table 1. Galaxies were classified using the optical emission line ratios log([N II]/Hα), log([S II]/Hα), log([O I]/Hα), and log([O III]/Hβ). For the purposes of the present work, we combined Seyfert and LINER classifications into the AGN category. In the case that the probabilities prevent a classification, the result is undefined. For half of these undefined sources, their SDSS DR8 subclass identification was BROADLINE, which we adopted. The Stampoulis et al. (2019) methodology does not account for broad lines, and thus was unable to classify these sources as such.
To add additional optical spectroscopic classifications, we cross-matched the positions of the remaining eFEDS-HECATE sources with the Final Release of the Six-degree Field (6dF) Galaxy Survey (Jones et al. 2004, 2009) by taking the nearest spectrum within a circle of radius 7″. This resulted in 24 additional galaxy spectra. After we de-redshifted the spectra, we removed the starlight component by using the STARLIGHT code (Cid Fernandes et al. 2005; Mateus et al. 2006). We then classified them into star-forming, composite, and AGN by visually inspecting the spectra. We identified three objects with broad Balmer lines which were clearly classified as AGN. For the remaining objects, we estimated the line ratios of [O III]/Hβ and [N II]/Hα lines. A comparison with the lineratio diagnostics of Stampoulis et al. (2019) suggested that nine of them were star-forming galaxies and three were composites. Because of issues with the flux calibration of the 6dF spectra, these classifications refer only to objects well within their respective loci in the [O III]/Hβ–[N II]/Hα diagnostic diagram. Furthermore, we characterized three additional galaxies as star-forming/composites because it was not clear in which class they belong (we adopted the composite classification for these 3), while for five galaxies the quality of the spectrum was inadequate for any classification. Finally, the spectrum of one galaxy was dominated by strong absorption lines and as a result, we classified it as an elliptical galaxy. Despite the absence of accurate measurements for the full sample of line ratios used in galaxy activity diagnostics, the visual examination of the spectra showed that the obtained classifications are robust. As a result, we incorporated an additional 19 classifications from the eFEDS-HECATE sample, which included ten normal galaxies. Therefore we obtained spectroscopic classifications for 76 galaxies, with 37 classified as normal galaxies.
In the right panel of Fig. 2, we show histograms of LX for all eFEDS-HECATE matches and those with optical spectra. In Fig. 4, we show the same plots from Fig. 2 that are now divided into the classifications summarised above. The ‘undefined’ class (red dot-dot-dashed lines) represents sources with optical spectra that were not able to be classified, as opposed to eFEDS-HECATE sources with no optical spectra and thus no classification. In the left panel, the separation between star-forming galaxies in the late-type region vs. AGN in the early-type region is evident. This separation is due to the selection via emission lines, which are produced by strongly ionising sources such as either hot, massive stars (i.e. star-forming galaxies) or AGN. The right panel shows that the AGN have higher LX compared with star-forming galaxies, as expected. It is important to consider that applying optical emission line diagnostics biases this work towards the selection of star-forming galaxies and omits early-type galaxies, hence the dearth of classifications for the latter.
To further probe the nature of the eFEDS-HECATE galaxies, we decompose sSFR and plot the SFR versus stellar mass in Fig. 5. All HECATE galaxies in the eFEDS field are shown as black dots. We indicate the source classifications determined for 76 sources via spectroscopy using various unfilled symbols and colours. We show star-forming galaxies (blue triangles), composite galaxies (green circles), AGN (orange triangles), sources with spectra that could not be classified and are thus undefined (red crosses), and sources with no spectroscopic information (magenta stars). There is a separation between star-forming galaxies that are found at high sSFR and the AGN, which are preferentially hosted in early-type galaxies, at low-sSFR. In Table 1, we summarise the results of eFEDS-HECATE matching and the source classifications.
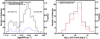 |
Fig. 2 Left: histogram of sSFR for all HECATE galaxies in eFEDS with sSFR estimates (solid black line) and those matched to eFEDS X-ray sources (dot-dashed blue line). The bimodal distribution of galaxies is apparent, where log sSFR = −10.6 (black dashed line) falls between the two peaks and separates the galaxy population into early-types (<−10.6) and late-types (>−10.6). Right: histogram of eROSITA LX for eFEDS-HECATE matches (solid black line) and those with SDSS and 6dF optical spectra (dashed red line), showing that the spectroscopic sub-sample is representative of the eFEDS-HECATE sample. |
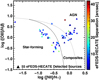 |
Fig. 3 BPT diagram, which uses the log([O III]/Hβ) and log([N II]/Hα) optical emission line ratios to separate sources into star-forming galaxies, composites, and AGN classes. To obtain robust classifications, we also incorporated log([S II]/Hα) and log([O I]/Hα) line ratios following Stampoulis et al. (2019). The colourbar indicates the separation between the eFEDS X-ray source and the HECATE galaxy in arcsec. |
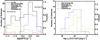 |
Fig. 4 Left: histograms showing sSFR of eFEDS-HECATE matches (black) and the sub-classifications based on sources matched to SDSS and 6dF optical spectra. Details of the classification methods are described in Sect. 2.3. Right: histograms of eROSITA LX showing the sub-classifications based on SDSS and 6dF optical spectroscopy of eFEDS-HECATE matches. The remaining eFEDS-HECATE matches are missing optical spectroscopic data and thus do not have sub-classifications. |
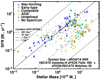 |
Fig. 5 SFRs and stellar masses M* for all HECATE galaxies in the eFEDS field (filled black circles) and the eFEDS-HECATE matches split into their respective classifications as described in Sect. 2.3. Only galaxies that have these parameter estimates are shown. The symbol size is proportional to the eROSITA detection likelihood. We also overlay lines of sSFR for reference. The AGN-hosting galaxies are at preferentially lower SFR (early-type) when compared with the star-forming galaxies. We only plotted galaxies having M* > 108 M⊙; there are 13 galaxies below this limit. |
eFEDS-HECATE matching and classification results.
2.4 Purity of the eFEDS-HECATE normal galaxies
We assessed the purity of the sample of classified normal galaxies using a number of different methods. First, we determined the false-match rate via Monte Carlo simulations. We created 10 000 galaxy catalogues, each with the same number of galaxies (1181) as the original matched HECATE catalogue. We matched each of these catalogues to the eFEDS X-ray source catalogue and derived a false-match rate of 1.5%, corresponding to ≈0.6 false sources. We also checked for the incidence of background AGN within the D25 ellipses of all eFEDS-HECATE matches that were classified as normal galaxies in Sect. 2.3. We first compared with the number counts from the Chandra Deep Field South (CDF-S) 7 Ms Survey (Luo et al. 2017) because of the completeness at and well below the eFEDS sensitivity limit of ~7 × 10⁻¹⁵ erg s−1 cm−2 in the 0.5–2 keV energy band. We utilized the cumulative number of AGN per deg2 expected at and above this limit and multiplied by the total area within the D25 ellipses of all eFEDS-HECATE matches that were classified as normal galaxies. This resulted in only 0.4 expected background AGN. We obtained the same value using the number counts from the larger-area, 9.3 deg2 Chandra survey of the Boötes Field (Masini et al. 2020). The number counts from the XMM-Newton 2 deg2 survey of the Cosmic Evolution Survey (COSMOS) field (Cappelluti et al. 2009) yielded a slightly larger estimate of 0.45 expected background AGN. When using the area within the D25 of all 94 eFEDS-HECATE matches, which includes those that were classified as AGN-hosting, we obtained 1.4 expected background AGN.
We also assessed the likelihood that the eFEDS-HECATE normal galaxies were spurious using the results of source detection simulations completed by Liu et al. (2022). Using the spurious source fraction and the distribution of detection likelihood for the eFEDS-HECATE normal galaxies, we estimated two spurious sources. Taken together with the estimates above, the normal galaxy sample potentially has ~3 sources of questionable origin, but is otherwise well-determined.
2.5 Metallicity estimates
We obtained galaxy gas-phase metallicities for the eFEDS-HECATE sample using the SDSS DR8 MPA-JHU catalogue starlight-subtracted optical emission line flux measurements (Brinchmann et al. 2004). The catalogue used stellar population synthesis models to fit and subtract the stellar continuum, including stellar absorption features, enabling the accurate measurement of nebular emission lines. Following the 03N2 method of Pettini & Pagel (2004, Eq. (3)), we calculated 12 + log(0/H) using the [O III], [N II], Hα, and Hβ emission line fluxes. Kewley & Ellison (2008) showed the 03N2 method was able to trace a wide range of metallicities, had relatively low scatter, and was comparatively less sensitive to extinction effects. We calculated metallicities for all 57 eFEDS-HECATE-SDSS matched sources that had the SDSS spectrotype = GALAXY designation. This includes metallicities for 27 star-forming galaxies. The metallicity estimates from the Pettini & Pagel (2004) empirical relation have systematic uncertainties of ±0.4 dex, which dominate when compared with statistical uncertainties. In Table A.l, we present the source characteristics for each eFEDS-HECATE match.
3 eROSITA observations versus simulations
In Basu-Zych et al. (2020), predictions were made for eRASS detections of normal galaxies based on the HECATE galaxy catalogue and prescriptions for the X-ray emission from normal galaxies. Simulations were completed both analytically and using the simulation of X-ray telescopes software (SIXTE, Dauser et al. 2019). In this section, we compare the predictions for eRASS:8 simulations with eFEDS observations as these surveys have similar sensitivity, albeit eFEDS only covers 140 deg2.
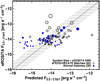 |
Fig. 6 Comparison between the integrated (XRB + hot gas) flux predicted using normal galaxy scaling relations as in Basu-Zych et al. (2020) and the observed eROSITA flux from sources detected in the eFEDS field. All eFEDS-HECATE matches with sSFR estimates are shown as unfilled black circles, whereas the spectroscopically classified normal galaxies are shown as filled blue circles. The light grey area represents the approximate dispersion from the scaling relations used to predict the flux of normal galaxies. |
3.1 Predicted vs. observed normal galaxy X-ray flux
In Fig. 6, we show the eROSITA flux for eFEDS sources compared with the predicted flux based on prescriptions for the X-ray emission from normal galaxies (XRBs + hot gas). This predicted flux is different from the flux expected for a source that was detected in SIXTE simulations, due to the adopted sensitivity limit and variations in the background. We can only show sources for which we have sSFR estimates such that their X-ray fluxes were accurately predicted (using stellar mass and SFR to estimate low-mass XRB (LMXB), high-mass XRB (HMXB), and hot gas flux). For the 37 spectroscopically classified normal galaxies, there is a large offset in the observed vs. predicted flux for sources with predicted fluxes below 5 × 10⁻¹⁵ erg s−1 cm−2, given the sensitivity limit for eFEDS. Most of the sources with these low predicted fluxes that were detected by eROSITA are likely a result of stochasticity in the sample of normal galaxies, which is a larger effect at lower values of SFR, stellar mass, and metallicity (Justham & Schawinski 2012; Lehmer et al. 2021). The scatter in the scaling relations for each component of the integrated emission from normal galaxies (LMXBs, HMXBs, and hot gas) was estimated in Basu-Zych et al. (2020) to vary based on morphological type and flux (see their Figs. 14 and 15), with dispersion in flux up to a factor of ~3. The variation in predicted vs. observed flux for star-forming galaxies at the lowest predicted fluxes in Fig. 6 is outside of this range, indicating additional effects such as low stellar-mass (dwarf galaxies – outside the range of values where scaling relations are derived and stochastic in nature), stellar age, metallicity, and merger history may likely contribute to the scatter.
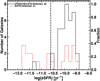 |
Fig. 7 Histogram of sSFR comparing eFEDS-HECATE normal galaxies detected in eROSITA observations (solid black line) with the predictions for eFEDS detections based on SIXTE simulations (dashed red line). The black vertical dashed line shows the sSFR cut adopted to separate early-type and late-type galaxies. eFEDS observations detected almost exclusively late-type galaxies, at odds with SIXTE simulations that predicted an approximately even split within the eFEDS field. |
3.2 Characteristics of simulated and observed samples
The SIXTE simulations from Basu-Zych et al. (2020) found that most detected normal galaxies have low-sSFR, coincident with the most massive early-type galaxies. A longer tail towards the highest-sSFR late-type galaxies was found (see Fig. 9 of Basu-Zych et al. 2020). The eRASS:8 SIXTE simulations predicted 3318 detections of normal galaxies, where 67% were early-types and 33% were late-types. Within the eFEDS field, this ratio was markedly different, with eleven (52%) early-type and ten (48%) late-type normal galaxy SIXTE-detected predictions. The HECATE catalogue excludes galaxies residing in group or cluster environments, which happen to host more massive early-type galaxies. However, eRASS:8 simulations also used the HECATE catalogue, pointing to potential effects from cosmic variance. In Fig. 7, we show a sSFR histogram comparing eFEDS normal galaxies detected in eROSITA observations and SIXTE simulations. While it seems there are approximately twice as many detections from eROSITA observations compared to detections in the SIXTE simulations, there are a number of issues with the characteristics of each sample and their distributions. Firstly, the bias in sSFR is clearly evident for early-type and late-type galaxies. SIXTE simulations showed an approximately even split whereas eROSITA observations almost exclusively identified late-type galaxies (36/37). Based on SIXTE simulations from Basu-Zych et al. (2020), we predicted eleven early-type normal galaxy detections within eFEDS - so why were more not identified in eROSITA observations? Optical spectroscopy is biased against the selection of early-type normal galaxies because the methodology is based on detecting emission lines, which are prevalent in star-forming galaxies (very hot gas and OB stars) and galaxies hosting AGN. However, elliptical galaxies are characterized by strong absorption lines due to metals in the stellar atmospheres of low-mass stars, but have no strong emission lines. We spectroscopically identified 18 low-luminosity AGN and three composites in the early-type galaxy region based on our sSFR cut, whereas an additional seven galaxies in this region had no spectrum. Of these seven sources, the morphological classifications are Sa, Sab, Scd, and four S0-types. If we assumed these seven galaxies were not detected via optical spectroscopy due to the presence of absorption lines and lack of AGN emission lines, and are thus normal early-type galaxies based on our sSFR cut, eROSITA observations would still not be in agreement with the predictions from SIXTE simulations.
We find agreement between the overall number of detections from eROSITA observations and SIXTE simulations when comparing flux detection and distance limits between each method. Due to variations in the flux sensitivity of both methods, we only compared sources detected above a given sensitivity limit. The SIXTE simulations used a lower limit on distance of 50 Mpc, whereas eROSITA observations included galaxies detected at all distances. Using the flux limit from the SIXTE simulations in the eFEDS field, along with the distance cut of 50 Mpc, we determined there are 22 normal galaxies detected from eROSITA observations, consistent with the 21 normal galaxies detected by SIXTE simulations.
However, the large discrepancy between observations and simulations is revealed when incorporating a key final result from Basu-Zych et al. (2020) concerning galaxy distributions. When analysing the SDSS optical spectroscopy available for simulated HECATE ‘normal’ galaxies, they found that only 22.6% of all detections were comprised of confirmed normal galaxies (XRBs + hot gas), whereas Seyferts (23.4%), LINERs (13.7%), and composites (40.2%) accounted for the remaining detections. Applying this ratio to SIXTE simulations of the eFEDS field would result in only five normal galaxy detections, three early-type and two late-type. This presents a critical issue for late-type galaxies, as there exists a factor ≈11 discrepancy between observed and simulated samples. Conversely, the early-type galaxy comparison is somewhat improved because the number of detections from SIXTE simulations has been reduced. In fact, Fig. 4 showed that most classifications of eFEDS-HECATE sources in the early-type region are low-luminosity AGN (Seyfert or LINER). When applying the ratios calculated in Basu-Zych et al. (2020), we assumed that there is no bias between morphological type. However, the majority of galaxies detected in simulations were early-types, which are skewed towards having AGN-like optical spectra, meaning that a larger fraction were identified as AGN in the ratios presented above. Conversely, most late-type galaxies detected in simulations had star-forming optical spectra, and thus preferentially classified as normal galaxies. If we approximated and accounted for the late/early-type designation in applying the ratios above, the discrepancy between late-types in simulations vs. observations would only be a factor of a few as opposed to ≈11. One caveat to these estimates is that there are 18 eFEDS-HECATE matches that have no spectrum and four that have a spectrum that cannot be classified, indicating the potential for an additional 22 normal galaxy detections, approximately split evenly into early-type and late-type.
Not only are the predictions from SIXTE simulations inconsistent with eROSITA observations, but the intersection between each sample of detected galaxies is minimal – only three galaxies were detected in both the eROSITA observations and the SIXTE simulations. The most concerning aspect of this result is that the prescriptions used for estimating X-ray emission of normal galaxies were not successful in predicting which galaxies would be detected. This points to an incomplete understanding of the X-ray emission from normal galaxy populations, particularly the hot gas scaling relations and contribution from dwarf galaxies, as well as stellar age, metallicity, merger history, and low-level/obscured nuclear activity.
3.3 eROSITA all-sky survey estimates compared
Basu-Zych et al. (2020) predicted that eRASS:8 would detect approximately 15 000 normal galaxies over the whole sky after the completion of the 4-yr survey. This was based on extrapolation from detections in a much smaller area of the sky (see their Fig. 1), due to the incompleteness of galaxy catalogues, particularly towards the faint end (e.g. dwarf galaxies), and the varying sensitivity limits of galaxy surveys. Nonetheless, these predictions provided a lower limit of the number of normal galaxies eROSITA should detect. However, as discussed in Sect. 3.2, a crucial caveat to these expectations was that these ‘normal’ galaxies are composed of a distribution of different supermassive black hole accretion rates, represented by quiescent (i.e. normal galaxy), composite, LINERs, and Seyferts. The result is that only 22.6% of the predicted 15 000 ‘normal’ galaxy detections were confirmed normal galaxies with quiescent supermassive black holes, whereas the remaining galaxies had some type of low-level AGN activity. Therefore, SIXTE simulations predicted eRASS:8 would detect a lower limit of ≈3400 confirmed normal galaxies (XRBs + hot gas) after the 4-year all-sky survey.
Using the results of eROSITA observations from the 140 deg2 eFEDS field, we estimated the number of normal galaxy detections expected from eRASS:8 because we expect that the sensitivity limit of each survey will be identical. From the 37 normal galaxies detected by eFEDS observations, we scaled the eFEDS survey area to the area of the whole sky to obtain an estimate of ≈12 500 eRASS:8 normal galaxy detections. This represents the number of detections based on the sensitivity limit from eFEDS observations. To compare directly to the SIXTE simulation prediction of Basu-Zych et al. (2020), we used only 22/37 normal galaxies detected by eFEDS observations at the same sensitivity limit that was used for SIXTE simulations, as well as the distance cut of D ≥ 50 Mpc. This one-to-one comparison resulted in an estimate of ≈6530 eRASS:8 normal galaxy detections, a factor of 1.9 larger than the ≈3400 confirmed normal galaxies expected from SIXTE simulations.
To further put these results in context, while SIXTE simulations for eRASS:8 underestimate the number of normal galaxies by a factor of 2, there are still 22 eFEDS-observed sources that have no classification and are potential normal galaxies. In addition, there are potentially tens of additional normal galaxies, particularly in the dwarf regime, that are eFEDS-detected but as of yet not identified as galaxies from, for example, optical surveys. Table 2 summarises the results of comparisons between SIXTE predictions and eROSITA observations.
4 Comparison with normal galaxy scaling relations
4.1 Scaling with specific star formation rate
The eFEDS-HECATE matches that are classified as normal galaxies (which are all star-forming based on the emission line diagnostics) can be compared with previous normal galaxy studies as a result of the ancillary galaxy parameter measurements that are available (SFR, stellar mass, metallicity). One caveat to the scaling relations studied in this section is that eROSITA detected the integrated emission from these galaxies in the soft band (0.5–2keV), whereas only two normal galaxies (eFEDS IDs 3372 and 29989) were detected in the eROSITA hard band (2–5 keV). Previous work with Chandra and XMM-Newton has focussed on the resolved XRB emission in galaxies and how that scales with galaxy SFR and stellar mass, but has not been combined with the hot gas emission. Mineo et al. (2012b) and Mineo et al. (2014) studied the properties of hot gas and integrated X-ray emission from star-forming galaxies and provided estimates of its contribution based on SFR. We utilized these results below to put our unresolved eROSITA detections in context.
In Fig. 8 we show the LX/SFR vs. sSFR for the 93 eFEDS-HECATE sources with SFR and stellar mass measurements. The symbols represent the classifications determined in Sect. 2.3. The scaling relation from Lehmer et al. (2016) is plotted as a solid black line with dispersion in grey and represents the XRB+hot gas emission of local (z ~ 0) normal galaxies (sub-sample from Lehmer et al. 2010) and stacked normal galaxy sub-samples from the CDF-S. The local (z ~ 0) normal galaxy sub-sample from Lehmer et al. (2010) was for 2–10 keV XRB emission only, so Lehmer et al. (2016) applied a bandpass correction to obtain the 0.5–2 keV emission and added the hot gas contribution based on the results of Mineo et al. (2012b). Mineo et al. (2012b) only studied late-type galaxies, although over a broad range of SFR from ~0.1–17 M⊙ yr−1, therefore this sample accurately reflects only the high-sSFR region of the scaling relation. The CDF-S stacked sub-samples were derived from the observed-frame 0.5–1 keV emission, which probes the restframe 0.5–2 keV band emission, and thus includes the integrated hot gas + XRB emission. The LX/SFR-sSFR scaling relation has generally been used to portray the connection between only the XRB emission of normal galaxies based on their SFR (scales with HMXB emission) and stellar mass (scales with LMXB emission).
Figure 8 shows that the star-forming galaxies have a large dispersion about the relation, particularly the dwarf galaxies at high sSFR. However, the locus of star-forming galaxies is consistent with the scaling relation. Somewhat surprisingly, the AGN-classified galaxies are also mostly consistent with the scaling relation, with the exception of the lowest-sSFR galaxy (eFEDS ID 150) that is well above the relation. The AGN classifications are relevant in the broader context of normal galaxy properties as these are low-luminosity AGN (see Fig. 4), and yet appear to be indistinguishable from the locus of normal early-type galaxies at low-sSFR, scattering above and below the relation. There are also a few AGN and composites that overlap the lower-end of the high-sSFR region (defined in Sect. 2.3), further motivating the need for robust spectroscopic classifications of galaxies from eROSITA surveys (e.g. eFEDS, eRASS). When plotting the LX–SFR and LX–M* relations we found similar trends showing an offset in both the dwarf galaxy population and a few of the most luminous AGN. We do not perform fitting of the Lx/SFR-sSFR relation for eFEDS-HECATE normal galaxies because we are effectively limited to a small region of high-sSFR normal galaxies.
Normal galaxy detections: simulation versus observation.
4.2 Scaling with metallicity
In the left panel of Fig. 9, we show the integrated (XRBs + hot gas) L0.5–2 keV/SFR as a function of galaxy gas-phase metallicity 12 + log (O/H) for eROSITA-detected star-forming galaxies. This metric is used to study the relation between HMXB emission (obtained from the 2–8 or 2–10 keV energy band) and metallicity in starburst galaxies (e.g. Basu-Zych et al. 2013b; Douna et al. 2015; Brorby et al. 2016; Lehmer et al. 2021). The top axis of Fig. 9 represents the metallicity expressed as Z (the mass fraction of elements heavier than Helium), converted by scaling 12 + log (O/H) = 8.69 to solar metallicity (Z⊙). A metallicity dependence of Lx/SFR is expected due to HMXBs being more numerous and more luminous with decreasing metallicity, since weaker stellar winds allow more mass retention and tighter binary orbits, as demonstrated in X-ray binary population synthesis models (Linden et al. 2010; Fragos et al. 2012). We do not have metallicity estimates for eFEDS-HECATE galaxies classified using 6dF spectra (Sect. 2.3), and therefore only 27/36 star-forming galaxies were studied here. As a result of only two normal galaxy detections in the eROSITA hard band (2–5 keV), we were unable to study HMXB-only emission from the population of normal galaxies in eROSITA. Thus data from previous surveys of Lyman break analogues, local star-forming galaxies, and luminous or ultraluminous infrared galaxies, that report HMXB-only emission, are not an accurate comparison to the eFEDS-HECATE sample. Nonetheless, we overplot galaxies from these various surveys to establish a reference sample. Bandpass corrections have been applied to convert from the 2–8 or 2–10 keV energy bands to 0.5–2 keV using the power-law spectral model defined at the end of Sect. 1. We also included the 0.5–2 keV theoretical prediction from Fragos et al. (2013) for HMXBs (solid dark grey line) and a range of values from z = 2 Lyman break galaxies (blue hatched region Basu-Zych et al. 2013b). The dashed blue line represents the average integrated (hot gas + HMXBs) L0.5–2 keV/SFR of normal galaxies from Lehmer et al. (2016).
We fitted the eFEDS-HECATE galaxies from Fig. 9 with the parametrization in Eq. (1):
 (1)
(1)
Using the glm function from the Python statsmodels package, we found a = −1.19 ± 0.18 and b = 40.95 ± 0.15 and dispersion about the fit of 0.28 dex. The dot-dashed black line with grey dispersion shows the best-fit to the eFEDS-HECATE star-forming galaxies. The eFEDS-HECATE sample exhibits elevated Lx/SFR across the metallicity range, especially at low metallicity. Comparing with the constant Lx/SFR integrated galaxy emission from Lehmer et al. (2016), the cluster of eFEDS-HECATE galaxies near solar metallicity (12 + log (O/H) = 8.69, or Z⊙) are mostly within the dispersion of the relation (0.37 dex). However, the discrepancy is much more pronounced at lower metallicities.
What is the origin of the excess Lx/SFR seen in the eFEDS-HECATE sample, particularly at low metallicity? To attempt to account for this elevated emission, we subtracted estimates of the hot gas and LMXB emission from each eFEDS-HECATE star-forming galaxy based on the scaling relations from Mineo et al. (2012b) and Gilfanov (2004), respectively. This allowed us to compare the estimate for HMXB-only emission from eFEDS-HECATE galaxies to the theoretical relation from Fragos et al. (2013) and data from previous surveys of Lyman break analogues, local star-forming galaxies, and luminous or ultraluminous infrared galaxies. This correction had a negligible effect on the total LX/SFR of most sources, with the most extreme decrease being ~0.1 dex. Therefore, unless the eFEDS-HECATE star-forming galaxies are part of a rare population with increased hot gas contribution that does not follow the known scaling relation, or have obscured AGN emission in the optical that is detected in the X-ray, these galaxies must have elevated HMXB emission due to low metallicity beyond what was already observed by previous studies of low-metallicity galaxies.
In the right panel of Fig. 9, we show the integrated (XRBs + hot gas) log(L0.5–8 keV) as a function of log(SFR) − 0.59 × [12 + log(O/H) − 8.69] for eROSITA-detected star-forming galaxies. This is the LX-SFR-metallicity relation from Brorby et al. (2016), which was fitted to the integrated emission of Lyman break analogue galaxies. We converted the eROSITA 0.5–2 keV flux to 0.5–8 keV to match the results from Brorby et al. (2016) using the same power-law model as above. This comparison is more accurate than the left panel of Fig. 9 because it represents the observed integrated emission of galaxies at various metallicities that have been shown to exhibit elevated HMXB emission. The eROSITA star-forming galaxies with high SFRs are consistent with the LX-SFR-metallicity relation whereas at low SFR they exhibit increased scatter and are elevated above the relation. This may be the result of an eROSITA selection effect where the rarest and brightest star-forming galaxies are detected. The galaxies showing significant scatter have lower stellar masses (≲109 M⊙) and SFRs (<0.5 M⊙ yr−1), which resemble dwarf galaxies harbouring a single ULX that dominates the integrated X-ray emission. While these stochastic effects at low stellar masses and SFRs are known (Justham & Schawinski 2012; Lehmer et al. 2021), the complete eROSITA survey will provide valuable measurements of the scatter at the most luminous end.
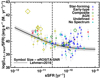 |
Fig. 8 Total 0.5–2.0 keV LX scaled by SFR as a function of sSFR for each eROSITA source matched to a HECATE galaxy. The X-ray emission for each source includes that from XRBs and hot gas. The solid black line represents the scaling relation for normal galaxies from Lehmer et al. (2016), which includes local galaxies and stacked samples from the CDF-S. Source classifications are the same as those from Fig. 5. Many star-forming galaxies, especially those at high sSFR, show large dispersion about the scaling relation. The AGN and composite sources are broadly consistent with the scaling relation, which is unexpected, indicating obscured and/or low-level AGN emission. The handful of star-forming galaxies at high sSFR that are offset from the relation are dwarf galaxies. |
5 Discussion
The results from studying normal galaxies in the eFEDS field are mixed when compared with predictions from simulations and scaling relations. SIXTE simulations from Basu-Zych et al. (2020) were not consistent with observations, when comparing the overall number of normal galaxy detections and their morphological distribution. The findings also indicate some agreement with scaling relations but inconsistency at high sSFR. The key results are (1) eFEDS observations found 1.9 times more normal galaxies than expected from simulations, and these were, except for one, all late-type galaxies, as opposed to an approximately even split in morphological type from simulations and (2) Star-forming galaxies nearer the dwarf mass regime at high sSFR were found to have excess LX/SFR relative to both sSFR and metallicity when compared with observational and theoretical expectations. In this section we discuss possible explanations for these results and their implications for studies of normal galaxies with eROSITA and beyond.
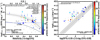 |
Fig. 9 Left: LX/SFR as a function of galaxy gas-phase metallicity for the eFEDS-HECATE galaxies classified as star-forming. LX represents the integrated galaxy X-ray luminosity (XRBs + hot gas). We overlay Lyman break analogues from (Basu-Zych et al. 2013b, unfilled black circles) and Jia et al. (2011, filled grey plusses), local star-forming galaxies from Colbert et al. (2004, filled grey squares) and Mineo et al. (2012a, filled grey diamonds), and luminous or ultraluminous infrared galaxies from Lehmer et al. (2010, inverted filled grey triangles) and Iwasawa et al. (2011, filled grey triangles). The blue hatched region shows the range of values for z = 2 Lyman break galaxies (Basu-Zych et al. 2013b). The theoretical prediction from Fragos et al. (2013) for HMXBs is shown as a solid dark grey line. The dashed blue line represents the average integrated (hot gas + HMXBs) L0.5–2 keV/SFR of normal galaxies from Lehmer et al. (2016). We do not have metallicity estimates for eFEDS-HECATE galaxies classified using 6dF spectra (Sect. 2.3). The dot-dashed black line with grey dispersion shows the best-fit to the eFEDS-HECATE star-forming galaxies. The sample shows elevated LX/SFR across metallicity, especially at low metallicity. This may be due to an obscured AGN, excessive contribution from hot gas, or increased HMXB emission (see Sect. 4.2). Right: LX-SFR-metallicity relation from Brorby et al. (2016) showing the best-fit from their paper for integrated L0.5–8 keV Lyman break analogues (dashed grey line with dispersion in dark grey). The offset between the eFEDS-HECATE galaxies and the relation for Lyman break analogues is pronounced towards low-SFR and low-metallicity. |
5.1 Quantifying normal galaxies with eROSITA
To place the eFEDS sample in the context of the broader normal galaxy surveys, we show the eFEDS X-ray source luminosity as a function of distance to the matched host galaxy for eFEDS-HECATE matches in Fig. 10. The eFEDS galaxies are consistent with the sensitivity limit of eRASS:8, as expected, given the slightly improved flux limit attained by eFEDS of ~7 × 10⁻¹⁵ erg s−1 cm−2. Galaxies classified as AGN and composite compose many of the most luminous sources (see right panel of Fig. 4), whereas star-forming galaxies dominate the lower-end of the scale. When compared with nearby and high-redshift galaxies, the eFEDS sample (and subsequently eRASS) probes a region of LX–D parameter space that has not been studied previously due to limitations of current and past observatories. In particular, many of the high-sSFR dwarf galaxies detected thus far in eFEDS-HECATE would require targeted observations by existing X-ray telescopes, which would be expensive a priori based on the expected fluxes from the X-ray scaling relations. eROSITA will make significant advancements in the study of normal galaxies by increasing the sample size and detecting rare populations, such as metal-poor dwarf starbursts (green peas, blue compact dwarfs) and Wolf-Rayet galaxies.
While 37 normal galaxies were identified from the 94 eFEDS-HECATE matches, eROSITA observations of the eFEDS field also detected 32 684 X-ray sources, most of which were AGN. Planned optical spectroscopic follow-up of these X-ray sources will lead to the classification of additional normal galaxies, particularly star-forming galaxies, due to bias in the diagnostic criteria as explained in Sects. 2.3 and 3.2. The eFEDS-HECATE matches were detected out to D ≈ 200 Mpc, the approximate distance limit of the HECATE galaxy catalogue. The completeness of HECATE decreases with increasing distance, estimated at 50% at D ~ 170 Mpc in terms of LB and M*. In terms of SFR, the completeness is much lower at 50% for 30 < D < 150 Mpc. There were 13 dwarf galaxies from HECATE (none matched to an eFEDS X-ray source) not plotted in Fig. 5 due to their low masses (M* ≤ 107 M⊙), which had sSFR distributed between 0.01 Gyr−1 to 1 Gyr−1 and D < 3 Mpc. Past studies of X-ray emission from dwarf galaxies was mainly due to targeted observations, and therefore was limited and biased. Considering that the completeness of HECATE significantly affects low-mass (low-luminosity) galaxies, and approximately half of the normal galaxies detected in eFEDS were star-forming galaxies in the dwarf regime, this population is the most likely to dominate future identifications in the eFEDS field.
5.2 Outliers in the star-forming regime
The comparison between detections of normal galaxies in SIXTE simulations (Basu-Zych et al. 2020) and eFEDS observations summarised in Table 2 showed a significant discrepancy. eFEDS observations detected 1.9 times more normal galaxies than predicted from simulations, when scaled to the entire sky and calculated at identical flux and distance limits. This disagreement likely stems from the stochastic nature of low-mass galaxies near the dwarf regime (M* ≲ 109 M⊙). Figure 5 shows that almost half of the detected star-forming galaxies in eFEDS have stellar masses centred at ~109 M⊙. The scaling relations used to predict XRB and hot gas emission from normal galaxies have mostly excluded dwarf galaxies (e.g. Lehmer et al. 2016, M* ≲ 109 M⊙, SFR ≲ 0.1 M⊙ yr−1), mainly because they are less luminous, making detection difficult, and thus do not contribute substantially to the global X-ray emission of the Universe. However, a small subset of the dwarf galaxy population is vigorously star-forming with high sSFR, showing elevated LX/SFR (e.g. Fig. 8). This offset was noticed by Vulic et al. (2018) when investigating XRB emission from galaxies with NuSTAR. The increased X-ray emission from some dwarf galaxies has been attributed to their low-metallicity, which increases the number and mass of compact objects and thus the total X-ray emission from XRBs (e.g. Basu-Zych et al. 2013a,b, 2016; Douna et al. 2015; Brorby et al. 2016; Fornasini et al. 2019; Lehmer et al. 2021). The integrated X-ray emission from these low-metallicity dwarf galaxies is usually dominated by one source – a ULX with LX > 1039 erg s−1 (e.g. Walton et al. 2013, 2015). Studies have shown that the numbers of ULXs increase with decreasing metallicity (Mapelli et al. 2010; Prestwich et al. 2013; Brorby et al. 2014; Douna et al. 2015; Basu-Zych et al. 2016; Kovlakas et al. 2020). The stochastic nature of both low-metallicity dwarf galaxies in the local Universe and the formation of ULXs within these galaxies, combined with observational completeness issues, has made this population difficult to study to date. These characteristics, particularly the lack of empirical relations to predict the integrated X-ray emission from dwarf galaxies, resulted in part of the increased number of late-type galaxies detected in eFEDS observations. The flux-limited nature of eFEDS can be interpreted in this context as eROSITA having selected the brightest sources compared to the undetected population at similar metallicity, stellar mass, and SFR. While efforts are underway to measure the effects of stochasticity in the X-ray emission at low SFRs, stellar masses, and metallicities, the small numbers of such objects is a limiting factor (Kouroumpatzakis et al. 2020; Lehmer et al. 2021). By detecting larger samples of galaxies with these conditions, the rarest and most luminous low-metallicity dwarf galaxies in their respective metallicity, stellar mass, and SFR bins, eROSITA would significantly improve the current constraints on the scatter in scaling relations.
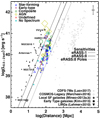 |
Fig. 10 LX versus distance for eFEDS X-ray sources matched with HECATE galaxies and classified using optical spectra (see Sect. 2.3 for details). We show the eROSITA sensitivity limits for one epoch of the all-sky survey (eRASS:1, ≈250 s), the full 4-yr survey (eRASS:8, ≈2 ks), and the full 4-yr survey at the ecliptic poles (≈20 ks). As expected, the eFEDS sources lie approximately at or above the eRASS:8 line, within uncertainty. We show nearby star-forming (black filled stars; Mineo et al. 2012a,b) and early-type (black filled squares; Kim & Fabbiano 2013) galaxies. A few well-known galaxies are labelled with their names for reference. Luminous Infrared galaxies (LIRGS; Lehmer et al. 2010) are shown as black filled inverted triangles. We also show galaxies from the COSMOS Legacy Survey (grey plusses; Marchesi et al. 2016) and CDF-S 7 Ms survey (filled grey circles; Luo et al. 2017). eROSITA probes a region of LX–D parameter space that has not been well studied. |
5.3 Early-type galaxies: are they missing or misunderstood?
Further examination of the discrepancy between eFEDS observations and simulations reveals the paucity of early-type galaxy detections in eFEDS observations. Predictions of the integrated X-ray emission from early-type galaxies were dominated by the hot gas component, which carried large uncertainties from the known scaling relations. By extension, this incorporated large uncertainties on the total number of expected early-type galaxy detections, and may be a viable explanation for the lack of detections from eFEDS observations. However, a more likely explanation for the lack of early-type galaxy detections via eFEDS observations is that early-type galaxies were detected, except they hosted, and thus their X-ray emission was dominated by, low-luminosity AGN. The early-type region of Fig. 8 contains one confirmed normal early-type galaxy, seven sources with no optical spectrum, two sources with low-quality spectra that prevented accurate classifications, three sources classified as composites, and 18 AGN. The early-types that were detected and classified were almost all AGN emitters (82%). Studies of eRASS early-type galaxies must accurately assess their designation as normal or AGN-hosting to avoid misclassification.
Lastly, Fig. 10 shows that nearby early-type galaxies from Kim & Fabbiano (2013, filled black squares) are located at the lowest luminosities probed by eROSITA in the eFEDS field, between 1039 and 5 × 1039 erg s−1. Even though late-type galaxies are detected in this LX range, including a few unclassified sources, the early-type population may be underluminous in the eFEDS field, or preferentially host low-luminosity AGN. Thus, it is not surprising that early-type normal galaxies, whether similar to this nearby sample or simply faint, are not detected. In addition to uncertainties on the hot gas component, studies of early-type galaxies have shown that the LMXB X-ray emission per unit stellar mass decreases with stellar age (Lehmer et al. 2014, 2017), and that LMXB emission per optical luminosity increases with globular cluster specific frequency (Humphrey & Buote 2008; Boroson et al. 2011). While some subset of the eFEDS sample may harbour relatively old stellar populations and low globular cluster specific frequencies, contributing to a reduction in the total X-ray emission, the eFEDS field is large enough to avoid these selection effects and provide an unbiased, representative sample of early-type galaxies. Using optical and IR colour diagnostics, Salvato et al. (2022) identified a population of brightest cluster galaxies that were consistent with SO and elliptical galaxy spectral energy distribution template tracks. Whether these sources are true passive (normal) galaxies or AGN was not evident and required further investigation.
5.4 Implications for eRASS normal galaxy detections
The first results from eROSITA show that there is still much to be learned about normal galaxies in the Universe. The predictions from SIXTE simulations based on known scaling relations of XRBs and hot gas in normal galaxies were inaccurate in predicting exactly which galaxies would be detected (only three galaxies were detected by eROSITA observations and SIXTE simulations), as well as the overall number of detections. A more comprehensive analysis of the hot gas emission from normal galaxies is required to understand the integrated X-ray emission from normal galaxies and model the X-ray output across cosmic time. In addition, the lack of early-type normal galaxy detections from eFEDS observations was unexpected based on simulations from Basu-Zych et al. (2020), although optical spectroscopic classifications indicate that most host low-luminosity AGN. Understanding the X-ray emission from early-type galaxies is critical to evaluate the results of eRASS surveys and discerning why most within eFEDS are AGN-hosting and not normal galaxies. The high rate of AGN identifications among early-types represents a tracer of the SMBH accretion rate in this population. Even within the 140 deg2 eFEDS field, we can conclude that the SMBH accretion rate in early-type galaxies must be large, even if at low-luminosities of LX < 3 × 1041 erg s−1 when compared to luminous AGN.
The predictions also did not foresee the number of low-mass (dwarf) galaxy detections that were found within eFEDS, partly because we do not understand the ULX-hosting rate and metallicity effects of this population (cf. Kovlakas et al. 2020). The scaling relations for XRBs and hot gas that are used for predicting X-ray emission from galaxies do not extend into the dwarf regime, hampering our ability to predict the properties of these galaxies. Improving scaling relations for the integrated X-ray emission of normal galaxies, particularly the hot gas contribution and effects of stellar age and metallicity, will help in understanding the total X-ray output of normal galaxies in the local Universe. The elevated values of Lx/SFR, when compared with empirical relations and theoretical predictions (Figs. 8 and 9) for dwarf galaxies are likely the result of increased HMXB and/or ULX emission due to low-metallicity. However, the presence of an intermediate mass BH in these dwarf starbursts cannot be ruled out based on their identification in previous studies (e.g. Baldassare et al. 2015; Mezcua 2017; Huang 2019). This elevated X-ray emission from dwarf galaxies could be attributed to active massive (104.1–5.8 M⊙) BH that may be off-nuclear (Reines et al. 2020). The overall implications for eRASS normal galaxies are that many detections will be late-type star-forming galaxies, and early-type normal galaxies will be rarer than predicted due to the presence of low-luminosity AGN.
6 Conclusions
Based on its expected 4-year survey coverage and sensitivity, eROSITA will significantly increase the number of X-ray detected normal galaxies and further our understanding of the X-ray emission produced in galaxies. In this paper, we report on the detection of 37 normal galaxies in the eROSITA eFEDS survey, representing the first view of X-ray emission from XRBs and the hot ISM at the full depth of the eRASS survey that is being conducted over the interval 2019–2023. We summarise our main results as follows:
We found 94 eFEDS X-ray sources that were matched within the D25 ellipse of galaxies from the HECATE catalogue. These associations are consistent with the counterpart identifications determined by Salvato et al. (2022) in all but seven cases, for detection likelihoods ≥6. Using optical spectroscopy from SDSS and 6dF, we classified sources as galaxies (late-type, early-type), composite, and AGN. We identified 37 normal galaxies, comprised of 36 late-type (star-forming) galaxies and one early-type galaxy;
Contrary to expectations from the simulations of Basu-Zych et al. (2020), we found 1.9 times more normal galaxies, dominated by an increased number of late-type galaxies and a dearth of early-type galaxies in the eFEDS X-ray detected sample, compared with those predictions. It was noted by Basu-Zych et al. (2020) that the properties of the hot interstellar medium in ‘less extreme’ (e.g. −11 < log sSFR < −10) galaxies is not well understood. Future research should focus on a careful investigation of early-type galaxies in eRASS, which were mostly found to host AGN in the eFEDS field.
Based on extrapolation from the eFEDS field, we expect at least 12 500 normal galaxies will be detected in eRASS:8, dominated by star-forming galaxies. The absence of all but one early-type galaxy may be due to a high SMBH accretion rate at low luminosity, or differences in the hot gas prescriptions for this population, which was expected to dominate the X-ray emission of early-type galaxies in simulations.
We find general consistency between the eROSITA-detected sample and previous X-ray surveys in terms of correlations such as LX-sSFR and LX-metallicity, but do find large scatter, towards higher X-ray luminosities, at the high-sSFR end. This sub-sample represents dwarf galaxies that are low-metallicity and are generally dominated by one (or possibly a few within the eROSITA PSF) luminous source(s) (e.g. ULX, intermediate-mass BH). As eROSITA will be populating the extreme end of such relations with more rare populations such as vigorous starbursts, more detailed studies of these rare galaxies will be possible.
The follow-up of eFEDS X-ray sources is underway to confirm their nature and characterize their multiwavelength properties. eRASS, the first X-ray all-sky survey since Röntgensatellit, will revolutionise our understanding of normal galaxies in the nearby Universe, detecting a statistically significant population free from the selection effect of targeted observations studying specific galaxies. Complementing deeper pencil-beam surveys (e.g. the Chandra Deep Fields) whose power was in detecting distant and faint sources, eROSITA will significantly boost the detection numbers and survey completeness for the brightest, yet rarest, nearby galaxy populations which may be those most representative of the first, primordial, galaxies. Therefore, these studies will have far-reaching implications on galaxy formation and evolution, particularly the constraints placed on local analogues of high-redshift galaxies thought to contribute to the heating of the intergalactic medium.
Acknowledgements
We thank the referee for useful comments that improved the manuscript. N.V. acknowledges support for this work provided by the National Aeronautics and Space Administration through Chandra Award Number GO9-20038B issued by the Chandra X-ray Observatory Center, which is operated by the Smithsonian Astrophysical Observatory for and on behalf of the National Aeronautics Space Administration under contract NAS8-03060. A.R.B. acknowledges support from NASA under award number 80GSFC21M0002. This work is based on data from eROSITA, the soft X-ray instrument aboard SRG, a joint Russian-German science mission supported by the Russian Space Agency (Roskosmos), in the interests of the Russian Academy of Sciences represented by its Space Research Institute (IKI), and the Deutsches Zentrum für Luftund Raumfahrt (DLR). The SRG spacecraft was built by Lavochkin Association (NPOL) and its subcontractors, and is operated by NPOL with support from the Max Planck Institute for Extraterrestrial Physics (MPE). The development and construction of the eROSITA X-ray instrument was led by MPE, with contributions from the Dr. Karl Remeis Observatory Bamberg & ECAP (FAU Erlangen-Nuernberg), the University of Hamburg Observatory, the Leibniz Institute for Astrophysics Potsdam (AIP), and the Institute for Astronomy and Astrophysics of the University of Tübingen, with the support of DLR and the Max Planck Society. The Argelander Institute for Astronomy of the University of Bonn and the Ludwig Maximilians Universität Munich also participated in the science preparation for eROSITA. Funding for the Sloan Digital Sky Survey (SDSS) has been provided by the Alfred P. Sloan Foundation, the Participating Institutions, the National Aeronautics and Space Administration, the National Science Foundation, the US Department of Energy, the Japanese Monbukagakusho, and the Max Planck Society. The SDSS Web site is http://www.sdss.org/. The SDSS is managed by the Astrophysical Research Consortium (ARC) for the Participating Institutions. The Participating Institutions are The University of Chicago, Fermilab, the Institute for Advanced Study, the Japan Participation Group, The Johns Hopkins University, Los Alamos National Laboratory, the Max-Planck-Institute for Astronomy (MPIA), the Max-PlanckInstitute for Astrophysics (MPA), New Mexico State University, University of Pittsburgh, Princeton University, the United States Naval Observatory, and the University of Washington. This research has made use of data obtained from the Chandra Source Catalog, provided by the Chandra X-ray Center (CXC) as part of the Chandra Data Archive. This research has made use of data obtained from the 4XMM XMM-Newton serendipitous source catalogue compiled by the 10 institutes of the XMM-Newton Survey Science Centre selected by ESA. This publication makes use of data products from the Wide-field Infrared Survey Explorer, which is a joint project of the University of California, Los Angeles, and the Jet Propulsion Laboratory/California Institute of Technology, funded by the National Aeronautics and Space Administration. This publication makes use of data products from the Two Micron All Sky Survey, which is a joint project of the University of Massachusetts and the Infrared Processing and Analysis Center/California Institute of Technology, funded by the National Aeronautics and Space Administration and the National Science Foundation. This research has made use of the NASA/IPAC Extragalactic Database (NED) which is operated by the Jet Propulsion Laboratory, California Institute of Technology, under contract with the National Aeronautics and Space Administration. We acknowledge the usage of the HyperLeda database (http://leda.univ-lyon1.fr).
Appendix A Additional table
Table A.1 – Source characteristics for eFEDS−HECATE matches
References
- Abbott, B. P., Abbott, R., Abbott, T. D., et al. 2019, ApJ, 882, L24 [Google Scholar]
- Agostino, C. J., & Salim, S. 2019, ApJ, 876, 12 [NASA ADS] [CrossRef] [Google Scholar]
- Baldassare, V. F., Reines, A. E., Gallo, E., & Greene, J. E. 2015, ApJ, 809, L14 [NASA ADS] [CrossRef] [Google Scholar]
- Baldwin, J. A., Phillips, M. M., & Terlevich, R. 1981, PASP, 93, 5 [Google Scholar]
- Basu-Zych, A. R., Lehmer, B. D., Hornschemeier, A. E., et al. 2013a, ApJ, 762, 45 [NASA ADS] [CrossRef] [Google Scholar]
- Basu-Zych, A. R., Lehmer, B. D., Hornschemeier, A. E., et al. 2013b, ApJ, 774, 152 [NASA ADS] [CrossRef] [Google Scholar]
- Basu-Zych, A. R., Lehmer, B., Fragos, T., et al. 2016, ApJ, 818, 140 [NASA ADS] [CrossRef] [Google Scholar]
- Basu-Zych, A. R., Hornschemeier, A. E., Haberl, F., et al. 2020, MNRAS, 498, 1651 [NASA ADS] [CrossRef] [Google Scholar]
- Bogdán, Á., Forman, W. R., Kraft, R. P., & Jones, C. 2013, ApJ, 772, 98 [CrossRef] [Google Scholar]
- Boroson, B., Kim, D.-W., & Fabbiano, G. 2011, ApJ, 729, 12 [NASA ADS] [CrossRef] [Google Scholar]
- Brinchmann, J., Charlot, S., White, S. D. M., et al. 2004, MNRAS, 351, 1151 [Google Scholar]
- Brorby, M., Kaaret, P., & Prestwich, A. 2014, MNRAS, 441, 2346 [NASA ADS] [CrossRef] [Google Scholar]
- Brorby, M., Kaaret, P., Prestwich, A., & Mirabel, I. F. 2016, MNRAS, 457, 4081 [NASA ADS] [CrossRef] [Google Scholar]
- Brunner, H., Liu, T., Lamer, G., et al. 2022, A&A, 661, A1 (eROSITA EDR SI) [NASA ADS] [CrossRef] [EDP Sciences] [Google Scholar]
- Cappelluti, N., Brusa, M., Hasinger, G., et al. 2009, A&A, 497, 635 [NASA ADS] [CrossRef] [EDP Sciences] [Google Scholar]
- Cid Fernandes, R., Mateus, A., Sodré, L., Stasmska, G., & Gomes, J. M. 2005, MNRAS, 358, 363 [CrossRef] [Google Scholar]
- Colbert, E. J. M., Heckman, T. M., Ptak, A. F., Strickland, D. K., & Weaver, K. A. 2004, ApJ, 602, 231 [NASA ADS] [CrossRef] [Google Scholar]
- Dauser, T., Falkner, S., Lorenz, M., et al. 2019, A&A, 630, A66 [NASA ADS] [CrossRef] [EDP Sciences] [Google Scholar]
- Dennerl, K., Andritschke, R., Bräuninger, H., et al. 2020, in SPIE Conf. Ser., 11444, 114444Q [NASA ADS] [Google Scholar]
- Douna, V. M., Pellizza, L. J., Mirabel, I. F., & Pedrosa, S. E. 2015, A&A, 579, A44 [NASA ADS] [CrossRef] [EDP Sciences] [Google Scholar]
- Evans, I. N., Primini, F. A., Miller, J. B., et al. 2020, in Am. Astron. Soc. Meet. Abstr., #235, 154.05 [NASA ADS] [Google Scholar]
- Fornasini, F. M., Kriek, M., Sanders, R. L., et al. 2019, ApJ, 885, 65 [NASA ADS] [CrossRef] [Google Scholar]
- Fragos, T., Tremmel, M., Lehmer, B., et al. 2012, in 10th Hellenic Astronomical Conference, eds. I. Papadakis, & A. Anastasiadis, 15–15 [Google Scholar]
- Fragos, T., Lehmer, B., Tremmel, M., et al. 2013, ApJ, 764, 41 [NASA ADS] [CrossRef] [Google Scholar]
- Gilfanov, M. 2004, MNRAS, 349, 146 [NASA ADS] [CrossRef] [Google Scholar]
- Huang, C. Y. 2019, Contrib. Astron. Observ. Skalnate Pleso, 49, 7 [NASA ADS] [Google Scholar]
- Humphrey, P. J., & Buote, D. A. 2008, ApJ, 689, 983 [NASA ADS] [CrossRef] [Google Scholar]
- Iwasawa, K., Sanders, D. B., Teng, S. H., et al. 2011, A&A, 529, A106 [NASA ADS] [CrossRef] [EDP Sciences] [Google Scholar]
- Jia, J., Ptak, A., Heckman, T. M., et al. 2011, ApJ, 731, 55 [NASA ADS] [CrossRef] [Google Scholar]
- Jones, D. H., Saunders, W., Colless, M., et al. 2004, MNRAS, 355, 747 [NASA ADS] [CrossRef] [Google Scholar]
- Jones, D. H., Read, M. A., Saunders, W., et al. 2009, MNRAS, 399, 683 [Google Scholar]
- Justham, S., & Schawinski, K. 2012, MNRAS, 423, 1641 [NASA ADS] [CrossRef] [Google Scholar]
- Kauffmann, G., Heckman, T. M., Tremonti, C., et al. 2003, MNRAS, 346, 1055 [Google Scholar]
- Kewley, L. J., & Ellison, S. L. 2008, ApJ, 681, 1183 [Google Scholar]
- Kim, D.-W., & Fabbiano, G. 2013, ApJ, 776, 116 [NASA ADS] [CrossRef] [Google Scholar]
- Kim, D.-W., & Fabbiano, G. 2015, ApJ, 812, 127 [NASA ADS] [CrossRef] [Google Scholar]
- Kouroumpatzakis, K., Zezas, A., Sell, P., et al. 2020, MNRAS, 494, 5967 [NASA ADS] [CrossRef] [Google Scholar]
- Kovlakas, K., Zezas, A., Andrews, J. J., et al. 2020, MNRAS, 498, 4790 [Google Scholar]
- Kovlakas, K., Zezas, A., Andrews, J. J., et al. 2021, MNRAS, 506, 1896 [NASA ADS] [CrossRef] [Google Scholar]
- Kroupa, P. 2001, MNRAS, 322, 231 [NASA ADS] [CrossRef] [Google Scholar]
- LaMassa, S. M., Georgakakis, A., Vivek, M., et al. 2019, ApJ, 876, 50 [NASA ADS] [CrossRef] [Google Scholar]
- Lehmer, B. D., Alexander, D. M., Bauer, F. E., et al. 2010, ApJ, 724, 559 [Google Scholar]
- Lehmer, B. D., Berkeley, M., Zezas, A., et al. 2014, ApJ, 789, 52 [NASA ADS] [CrossRef] [Google Scholar]
- Lehmer, B. D., Basu-Zych, A. R., Mineo, S., et al. 2016, ApJ, 825, 7 [Google Scholar]
- Lehmer, B. D., Eufrasio, R. T., Markwardt, L., et al. 2017, ApJ, 851, 11 [NASA ADS] [CrossRef] [Google Scholar]
- Lehmer, B. D., Eufrasio, R. T., Basu-Zych, A., et al. 2021, ApJ, 907, 17 [NASA ADS] [CrossRef] [Google Scholar]
- Li, J.-T., Bregman, J. N., Wang, Q. D., et al. 2017, ApJS, 233, 20 [NASA ADS] [CrossRef] [Google Scholar]
- Linden, T., Kalogera, V., Sepinsky, J. F., et al. 2010, ApJ, 725, 1984 [Google Scholar]
- Liu, T., Merloni, A., Comparat, J., et al. 2022, A&A, 661, A27 (eROSITA EDR SI) [NASA ADS] [CrossRef] [EDP Sciences] [Google Scholar]
- Luo, B., Brandt, W. N., Xue, Y. Q., et al. 2017, ApJS, 228, 2 [Google Scholar]
- Madau, P., & Fragos, T. 2017, ApJ, 840, 39 [Google Scholar]
- Makarov, D., Prugniel, P., Terekhova, N., Courtois, H., & Vauglin, I. 2014, A&A, 570, A13 [NASA ADS] [CrossRef] [EDP Sciences] [Google Scholar]
- Mapelli, M., Ripamonti, E., Zampieri, L., Colpi, M., & Bressan, A. 2010, MNRAS, 408, 234 [NASA ADS] [CrossRef] [Google Scholar]
- Marchesi, S., Lanzuisi, G., Civano, F., et al. 2016, ApJ, 830, 100 [Google Scholar]
- Masini, A., Hickox, R. C., Carroll, C. M., et al. 2020, ApJS, 251, 2 [Google Scholar]
- Mateus, A., Sodré, L., Cid Fernandes, R., et al. 2006, MNRAS, 370, 721 [NASA ADS] [CrossRef] [Google Scholar]
- Merloni, A., Predehl, P., Becker, W., et al. 2012, ArXiv e-prints [arXiv:1289.3114] [Google Scholar]
- Mesinger, A., Ewall-Wice, A., & Hewitt, J. 2014, MNRAS, 439, 3262 [NASA ADS] [CrossRef] [Google Scholar]
- Mezcua, M. 2017, Int. J. Mod. Phys. D, 26, 1730021 [Google Scholar]
- Mineo, S., Gilfanov, M., & Sunyaev, R. 2012a, MNRAS, 419, 2095 [Google Scholar]
- Mineo, S., Gilfanov, M., & Sunyaev, R. 2012b, MNRAS, 426, 1870 [NASA ADS] [CrossRef] [Google Scholar]
- Mineo, S., Gilfanov, M., Lehmer, B. D., Morrison, G. E., & Sunyaev, R. 2014, MNRAS, 437, 1698 [NASA ADS] [CrossRef] [Google Scholar]
- Pacucci, F., Mesinger, A., Mineo, S., & Ferrara, A. 2014, MNRAS, 443, 678 [CrossRef] [Google Scholar]
- Pettini, M., & Pagel, B. E. J. 2004, MNRAS, 348, L59 [NASA ADS] [CrossRef] [Google Scholar]
- Predehl, P., Andritschke, R., Arefiev, V., et al. 2021, A&A, 647, A1 [EDP Sciences] [Google Scholar]
- Prestwich, A. H., Tsantaki, M., Zezas, A., et al. 2013, ApJ, 769, 92 [NASA ADS] [CrossRef] [Google Scholar]
- Reines, A. E., Condon, J. J., Darling, J., & Greene, J. E. 2020, ApJ, 888, 36 [NASA ADS] [CrossRef] [Google Scholar]
- Ruiz, A., Corral, A., Mountrichas, G., & Georgantopoulos, I. 2018, A&A, 618, A52 [NASA ADS] [CrossRef] [EDP Sciences] [Google Scholar]
- Salvato, M., Buchner, J., Budavári, T., et al. 2018, MNRAS, 473, 4937 [Google Scholar]
- Salvato, M., Wolf, J., Dwelly, T., et al. 2022, A&A, 661, A3 (eROSITA EDR SI) [NASA ADS] [CrossRef] [EDP Sciences] [Google Scholar]
- Shu, Y., Koposov, S. E., Evans, N. W., et al. 2019, MNRAS, 489, 4741 [Google Scholar]
- Stampoulis, V., van Dyk, D. A., Kashyap, V. L., & Zezas, A. 2019, MNRAS, 485, 1085 [NASA ADS] [CrossRef] [Google Scholar]
- Taylor, M. B. 2006, in Astronomical Society of the Pacific Conference Series, 351, Astronomical Data Analysis Software and Systems XV, eds. C. Gabriel, C. Arviset, D. Ponz, & S. Enrique, 666 [NASA ADS] [Google Scholar]
- Tremonti, C. A., Heckman, T. M., Kauffmann, G., et al. 2004, ApJ, 613, 898 [Google Scholar]
- Vulic, N., Hornschemeier, A. E., Wik, D. R., et al. 2018, ApJ, 864, 150 [NASA ADS] [CrossRef] [Google Scholar]
- Walton, D. J., Miller, J. M., Harrison, F. A., et al. 2013, ApJ, 773, L9 [NASA ADS] [CrossRef] [Google Scholar]
- Walton, D. J., Middleton, M. J., Rana, V., et al. 2015, ApJ, 806, 65 [Google Scholar]
- Webb, N. A., Coriat, M., Traulsen, I., et al. 2020, A&A, 641, A136 [NASA ADS] [CrossRef] [EDP Sciences] [Google Scholar]
Pre-launch estimate from Merloni et al. (2012) was 28″.
All Tables
All Figures
|
Fig. 1 Cosmological slice showing the distribution of HECATE galaxies in the eFEDS field (black points). The eFEDS-HECATE matches are subdivided into early-type (red plusses) and late-type (blue diamonds) galaxies, which have been classified solely based on a cut in specific SFR (sSFR), and does not necessarily indicate the nature of the X-ray source emission (e.g. normal star-forming or elliptical galaxy, AGN). Those matches without an estimate of sSFR are shown as green crosses. |
| In the text | |
|
Fig. 2 Left: histogram of sSFR for all HECATE galaxies in eFEDS with sSFR estimates (solid black line) and those matched to eFEDS X-ray sources (dot-dashed blue line). The bimodal distribution of galaxies is apparent, where log sSFR = −10.6 (black dashed line) falls between the two peaks and separates the galaxy population into early-types (<−10.6) and late-types (>−10.6). Right: histogram of eROSITA LX for eFEDS-HECATE matches (solid black line) and those with SDSS and 6dF optical spectra (dashed red line), showing that the spectroscopic sub-sample is representative of the eFEDS-HECATE sample. |
| In the text | |
|
Fig. 3 BPT diagram, which uses the log([O III]/Hβ) and log([N II]/Hα) optical emission line ratios to separate sources into star-forming galaxies, composites, and AGN classes. To obtain robust classifications, we also incorporated log([S II]/Hα) and log([O I]/Hα) line ratios following Stampoulis et al. (2019). The colourbar indicates the separation between the eFEDS X-ray source and the HECATE galaxy in arcsec. |
| In the text | |
|
Fig. 4 Left: histograms showing sSFR of eFEDS-HECATE matches (black) and the sub-classifications based on sources matched to SDSS and 6dF optical spectra. Details of the classification methods are described in Sect. 2.3. Right: histograms of eROSITA LX showing the sub-classifications based on SDSS and 6dF optical spectroscopy of eFEDS-HECATE matches. The remaining eFEDS-HECATE matches are missing optical spectroscopic data and thus do not have sub-classifications. |
| In the text | |
|
Fig. 5 SFRs and stellar masses M* for all HECATE galaxies in the eFEDS field (filled black circles) and the eFEDS-HECATE matches split into their respective classifications as described in Sect. 2.3. Only galaxies that have these parameter estimates are shown. The symbol size is proportional to the eROSITA detection likelihood. We also overlay lines of sSFR for reference. The AGN-hosting galaxies are at preferentially lower SFR (early-type) when compared with the star-forming galaxies. We only plotted galaxies having M* > 108 M⊙; there are 13 galaxies below this limit. |
| In the text | |
|
Fig. 6 Comparison between the integrated (XRB + hot gas) flux predicted using normal galaxy scaling relations as in Basu-Zych et al. (2020) and the observed eROSITA flux from sources detected in the eFEDS field. All eFEDS-HECATE matches with sSFR estimates are shown as unfilled black circles, whereas the spectroscopically classified normal galaxies are shown as filled blue circles. The light grey area represents the approximate dispersion from the scaling relations used to predict the flux of normal galaxies. |
| In the text | |
|
Fig. 7 Histogram of sSFR comparing eFEDS-HECATE normal galaxies detected in eROSITA observations (solid black line) with the predictions for eFEDS detections based on SIXTE simulations (dashed red line). The black vertical dashed line shows the sSFR cut adopted to separate early-type and late-type galaxies. eFEDS observations detected almost exclusively late-type galaxies, at odds with SIXTE simulations that predicted an approximately even split within the eFEDS field. |
| In the text | |
|
Fig. 8 Total 0.5–2.0 keV LX scaled by SFR as a function of sSFR for each eROSITA source matched to a HECATE galaxy. The X-ray emission for each source includes that from XRBs and hot gas. The solid black line represents the scaling relation for normal galaxies from Lehmer et al. (2016), which includes local galaxies and stacked samples from the CDF-S. Source classifications are the same as those from Fig. 5. Many star-forming galaxies, especially those at high sSFR, show large dispersion about the scaling relation. The AGN and composite sources are broadly consistent with the scaling relation, which is unexpected, indicating obscured and/or low-level AGN emission. The handful of star-forming galaxies at high sSFR that are offset from the relation are dwarf galaxies. |
| In the text | |
|
Fig. 9 Left: LX/SFR as a function of galaxy gas-phase metallicity for the eFEDS-HECATE galaxies classified as star-forming. LX represents the integrated galaxy X-ray luminosity (XRBs + hot gas). We overlay Lyman break analogues from (Basu-Zych et al. 2013b, unfilled black circles) and Jia et al. (2011, filled grey plusses), local star-forming galaxies from Colbert et al. (2004, filled grey squares) and Mineo et al. (2012a, filled grey diamonds), and luminous or ultraluminous infrared galaxies from Lehmer et al. (2010, inverted filled grey triangles) and Iwasawa et al. (2011, filled grey triangles). The blue hatched region shows the range of values for z = 2 Lyman break galaxies (Basu-Zych et al. 2013b). The theoretical prediction from Fragos et al. (2013) for HMXBs is shown as a solid dark grey line. The dashed blue line represents the average integrated (hot gas + HMXBs) L0.5–2 keV/SFR of normal galaxies from Lehmer et al. (2016). We do not have metallicity estimates for eFEDS-HECATE galaxies classified using 6dF spectra (Sect. 2.3). The dot-dashed black line with grey dispersion shows the best-fit to the eFEDS-HECATE star-forming galaxies. The sample shows elevated LX/SFR across metallicity, especially at low metallicity. This may be due to an obscured AGN, excessive contribution from hot gas, or increased HMXB emission (see Sect. 4.2). Right: LX-SFR-metallicity relation from Brorby et al. (2016) showing the best-fit from their paper for integrated L0.5–8 keV Lyman break analogues (dashed grey line with dispersion in dark grey). The offset between the eFEDS-HECATE galaxies and the relation for Lyman break analogues is pronounced towards low-SFR and low-metallicity. |
| In the text | |
|
Fig. 10 LX versus distance for eFEDS X-ray sources matched with HECATE galaxies and classified using optical spectra (see Sect. 2.3 for details). We show the eROSITA sensitivity limits for one epoch of the all-sky survey (eRASS:1, ≈250 s), the full 4-yr survey (eRASS:8, ≈2 ks), and the full 4-yr survey at the ecliptic poles (≈20 ks). As expected, the eFEDS sources lie approximately at or above the eRASS:8 line, within uncertainty. We show nearby star-forming (black filled stars; Mineo et al. 2012a,b) and early-type (black filled squares; Kim & Fabbiano 2013) galaxies. A few well-known galaxies are labelled with their names for reference. Luminous Infrared galaxies (LIRGS; Lehmer et al. 2010) are shown as black filled inverted triangles. We also show galaxies from the COSMOS Legacy Survey (grey plusses; Marchesi et al. 2016) and CDF-S 7 Ms survey (filled grey circles; Luo et al. 2017). eROSITA probes a region of LX–D parameter space that has not been well studied. |
| In the text | |
Current usage metrics show cumulative count of Article Views (full-text article views including HTML views, PDF and ePub downloads, according to the available data) and Abstracts Views on Vision4Press platform.
Data correspond to usage on the plateform after 2015. The current usage metrics is available 48-96 hours after online publication and is updated daily on week days.
Initial download of the metrics may take a while.