| Issue |
A&A
Volume 661, May 2022
The Early Data Release of eROSITA and Mikhail Pavlinsky ART-XC on the SRG mission
|
|
|---|---|---|
| Article Number | A32 | |
| Number of page(s) | 9 | |
| Section | Stellar structure and evolution | |
| DOI | https://doi.org/10.1051/0004-6361/202141410 | |
| Published online | 18 May 2022 | |
Peculiar X-ray transient SRGA J043520.9+552226/AT2019wey discovered with SRG/ART-XC
1
Space Research Institute, Russian Academy of Sciences,
Profsoyuznaya 84/32,
117997
Moscow,
Russia
e-mail: This email address is being protected from spambots. You need JavaScript enabled to view it.
2
Sternberg Astronomical Institute, Moscow M.V. Lomonosov State University,
Universitetskij pr., 13,
119992
Moscow,
Russia
3
Institute of Solar-Terrestrial Physics, Russian Academy of Sciences,
Siberian Branch, PO Box 4026,
664033
Irkutsk,
Russia
4
Max Planck Institute for Astrophysics,
Karl-Schwarzschild-Str. 1, Postfach 1317,
85741
Garching,
Germany
Received:
28
May
2021
Accepted:
16
October
2021
Abstract
Context. During its ongoing all-sky survey, the Mikhail Pavlinsky ART-XC (Astronomical Roentgen Telescope - X-ray Concentrator) telescope on board the Spectrum-Roentgen-Gamma (SRG) observatory is set to discover new X-ray sources, many of which can be transient. Here we report the discovery and multiwavelength follow-up of a peculiar X-ray source SRGA J043520.9+552226 = SRGe J043523.3+552234. This is the high-energy counterpart of the optical transient AT2019wey.
Aims. Through its sensitivity and the survey strategy, the Mikhail Pavlinsky ART-XC telescope uncovers poorly studied weak transient populations. Using the synergy with current public optical surveys, we aim to reveal the nature of these transients to study their parent populations. SRGA J043520.9+552226 is the first transient detected by ART-XC that has a bright optical counterpart suitable for further studies.
Methods. We used available public X-ray and optical data and observations with SRG, INTEGRAL, NuSTAR, NICER, Swift, and ground-based telescopes to investigate the spectral energy distributions of the source in different phases of the outburst.
Results. Based on X-ray spectral and timing properties derived from space observations, optical spectroscopy, and photometry obtained with the 2.5 m and RC600 telescopes of the Caucasian Mountain Observatory of the Sternberg Astronomical Institute of Moscow State University, we propose that the source is a black hole in a low-mass close X-ray binary system.
Key words: X-rays: binaries / X-rays: individuals / SRGA J043520.9+552226
© ESO 2022
1 Introduction
Since December 2019, the Spectrum-Roentgen-Gamma observatory (SRG, Sunyaev et al. 2021) has been performing a continuous all-sky survey in X-rays using its two instruments, the extended ROentgen Survey with an Imaging Telescope (eROSITA, Predehl et al. 2021) and the Mikhail Pavlinsky Astronomical Roentgen Telescope – X-ray Concentrator (ART-XC, Pavlinsky et al. 2021). This survey is expected to be the deepest in soft and hard X-rays. Along with already known X-ray sources, both telescopes detect new objects, including transient objects. Populations of weak transients that are not easily observable by current X-ray all-sky monitors and wide field telescopes (e.g., INTEGRAL, Swift/BAT, and MAXI) are particularly interesting. One of the best examples of such a population are very faint X-ray transients (VFXTs, see, e.g., Muno et al. 2005; Wijnands et al. 2006) that reach a peak luminosity of 1034–1036 erg s−1 during outbursts. VFXTs have been unveiled in the recent years by extensive monitoring programs of the Galactic center region. With the advent of ART-XC, we now have the opportunity to search for similar families of dim sources over the entire sky.
Since its launch, the Mikhail Pavlinsky ART-XC telescope has revealed a number of outbursts from known objects (see, e.g., Mereminskiy et al. 2020a,c) and has discovered several new transients (Mereminskiy et al. 2019; Semena et al. 2020, 2021). Most of these new sources, although interesting, were difficult to study, given the lack of established optical counterparts. This makes it practically impossible to unveil the nature of these sources.
On March 18, 2020, SRG/ART2-XC1 discovered the bright (F4−12keV ≈ 10−11 erg cm−2 s−1) X-ray source SRGA J043520.9+552226 at a position coinciding with the orphan (i.e., not associated with any background galaxy) optical transient AT2019wey, which was found earlier in ZTF (Masci et al. 2019), ATLAS (Tonry et al. 2018), and Gaia (Gaia Collaboration 2016) surveys. The source was also detected by SRG/eROSITA in the soft and standard X-ray bands, which provided a more accurate localization and reliably identified the new X-ray source with AT2019wey (Mereminskiy et al. 2020b). This allowed us to initiate follow-up optical observations, which were supported by different ground-based telescopes and other X-ray observatories. Based on these observations, SRGA J043520.9+552226 was established as a new Galactic microquasar in a low-mass X-ray binary system (LMXB) showing a resolved compact jet (Yadlapalli et al. 2021), an unusual relation LX – Lopt between X-ray and optical emissions, and a strong reflection (see Yao et al. 2021a,b).
In this paper, we report in Sect. 2 the discovery of the new transient SRGA J043520.9+552226, and in Sect. 3 we describe comprehensive X-ray and optical observations of the source. The observed properties are summarized in Sect. 4. In Sect. 5 we discuss the features and the nature of the source, and we formulate our conclusions in Sect. 6.
2 Discovery of SRGA J043520.9+552226 = SRGe J043523.3+552234/AT2019wey
SRGA J043520.9+552226 was first detected on March 18, 2020, by the ART-XC near-real time analysis pipeline and was identified as a new X-ray transient. The source was also detected by the eROSITA telescope, which provided a more accurate position and spectral information in the low-energy part of its X-ray spectrum. An improved position of the source (RA = 68.8472, Dec = 55.3760, J2000, the 68% error circle radius is 5″) was just ~0.8″ off the position of AT2S19wey, the optical transient discovered by ZTF on December 2, 2019, and later independently detected by ATLAS and Gaia. This positional coincidence enabled us to identify the discovered X-ray source SRGA J043520.9+552226 = SRGe J043523.3+552234 as the X-ray counterpart of AT2019wey. The X-ray spectrum is relatively hard and absorbed (Mereminskiy et al. 2020b, see Sect. 4 for details), indicating that the source is not nearby.
To investigate the nature of the source, we initiated quick follow-up observations at the 1.6 m Sayan telescope (Burenin et al. 2016). The first optical spectrum was obtained on March 19, 2020. Based on the featureless blue spectrum with a low signal-to-noise ratio, Lyapin et al. (2020) proposed the source to be a blazar in outburst. However, this conclusion was initially considered questionable because unstable weather conditions resulted in a poor-quality optical spectrum.
A high-quality optical spectrum of the source was acquired on the 2.5 m telescope of the Caucasian Mountain Observatory of the Sternberg Astronomical Institute of Moscow State University (CMO SAI MSU) on March 27, 2020. The spectrum exhibited the Balmer hydrogen lines (Hα-Hϵ) in absorption at rest, implying a Galactic origin of the transient.
Most bright galactic X-ray transients reside in binary systems in which an increase in X-ray emission is related to the onset of the accretion onto a compact object (white dwarf, neutron star, or black hole). We therefore inspected archival optical observations in which a secondary star could have been detected.
Earlier, this sky area was observed by the SDSS (Alam et al. 2015) and Pan-STARRS1 (Chambers et al. 2016) surveys, but no source was found at the position of AT2019wey. This enables constraining the presence of a hot, massive optical component in this system. Both surveys give an upper limit on the brightness of SRGA J043520.9+552226/AT2019wey in quiescence at ≈23 mag in the g filter. The Galactic extinction along the line of sight is E(g – r) = 0.7, Ag = 3.5, (Green et al. 2019), which enables us to exclude any star with a spectral class earlier than F0V(Mg = 3.1, the absolute magnitudes for main-sequence stars of different spectral classes were taken from Bilir et al. 2009) up to a distance of about 20 kpc. Therefore the source cannot be a Galactic high-mass X-ray binary (HMXB).
On the other hand, a typical K5V optical star in a low-mass X-ray binary (Smith & Dhillon 1998) with Mg = 8.3 located within 2.5 kpc from the Sun would be detected. Therefore the source is unlikely to be a nearby LMXB. Using the ΔV-period relation from Shahbaz & Kuulkers (1998) and assuming that ΔV ≈ Δg ≳ 6, we could place an upper limit on a binary period of ~ 15 h. Based on the considerations described above, that is, the source Galactic coordinates (l ≃ 151.16, b ≃ 5.30) and the lack of a luminous star in the archival data, we can assume that SRGA J043520.9+552226 is an LMXB or a cataclysmic variable (CV) located in the far part of the Perseus spiral arm or in the outer arm.
The discovery of the new transient SRGA J043520.9+552226 initiated a chain of follow-up observations from X-rays to the optical and radio. Part of these multiwavelength observations were summarized in Yao et al. (2021a). These authors placed tight constrains on the secondary star mass M2 ≲ 0.8 M⊙ and source distance of 1 kpc ≲ D ≲ 10 kpc. The X-ray behavior was found to be typical for black-hole LMXBs undergoing a “hard-only” outburst (Tetarenko et al. 2016), with the source slowly transitioning from a ‘low-hard’ state to a ‘hard-intermediate’ state (Yao et al. 2021b). Finally, interfero-metric radio observations discovered a variable extended source, indicating powerful jets in this system (Yadlapalli et al. 2021). These arguments suggest that SRGA J043520.9+552226 = SRGe J043523.3+552234 is another Galactic microquasar in an LMXB system.
3 Observations and data reduction
Over the course of 2019–2020 the SRGA J043520.9+552226 was observed with different optical and X-telescopes. Below we describe the obtained observations and data reduction processes for different instruments.
3.1 X-ray observations
3.1.1 Spectrum-Roentgen-Gamma
SRGA J043520.9+552226 has been observed four times by the SRG observatory, including three observations during the first, second, and third all-sky surveys in March 2020, September 2020, and March, 2021. These observations were relatively short, so that not many data could be extracted. The eROSITA raw data were processed by the calibration pipeline based on the eROSITA Science Analysis Software System (eSASS) (Brunner et al. 2018). During the second and third observations, the source was bright enough for photon pile-up to become important, therefore we did not use these data and limited ourselves to the first scan.
The fourth SRG observation was performed on October 5, 2020 (see Table 1 for details of the observation) during a survey break that was intended for an orbital correction manoeuvre. The eROSITA telescope, with its detectors working at cryogenic temperatures, was turned off during this observation to prevent a possible contamination by the engine exhaust. Only ART-XC data were therefore available. The observation was performed in pointing mode with an exposure of ≃15 ks. These observations had been proposed for cross-calibration purposes and were performed simultaneously with those of INTEGRAL.
We used ART-XC pipeline ARTPRODUCTS v0.9 with the CALDB version 20200401 to extract the source spectrum in the 5–30 keV band and a light curve in the 4–12 keV energy band from a circular region (R = 135″) centered on the source. Spectra from all seven telescope modules were binned into 25 bins (24 logarithmic bins in 5–25 keV, plus one wide 25–30 keV bin) in order to reasonably sample detector energy resolution and provide at least 3σ source detection in each channel.
List of long-pointed X-ray observations used for the spectral analysis.
3.1.2 Swift/XRT
Monitoring observations of SRGA J043520.9+552226 were carried out by Swift/XRT (Burrows et al. 2005) on board the Neil Gehrels Swift observatory (Gehrels et al. 2004). Data from Swift/XRT were processed using an online tool (Evans et al. 2009). The Swift/XRT spectra obtained in the photon-counting mode were used in the 0.3–9 keV range (0.8–9 keV for the windowed mode) and were grouped to also have at least 30 counts per energy bin.
3.1.3 NICER
The NICER (Gendreau et al. 2012) telescope, mounted on the International Space Station, obtained a detailed light curve during the outburst brightening. High-level NICER products were extracted using the latest HEASOFT 6.28 version. To trace the outburst profile, we extracted the overall 0.4–9 keV light curve binned per 1 ks. No background was subtracted. The source dominates the mean background by a factor of one hundred or more.
3.1.4 NuSTAR
Three long observations by NuSTAR (Harrison et al. 2013) (hereafter denoted as NUI, NUII, and NUIII, respectively) were used to construct broadband spectral energy distributions (SEDs). Spectra and light curves were extracted using NuSTARDAS v2.0.0. Spectra were extracted from circular regions with 72″, 105″, and 75″ and, background regions were selected at the same chip where possible. Spectra were grouped to have at least 30 counts per energy bin.
3.1.5 INTEGRAL
We initiated long target-of-opportunity (ToO) observations of SRGA J043520.9+552226 with the INTEGRAL observatory (Winkler et al. 2003) simultaneously with the pointed ART-XC observations and short (1.5 ks) Swift ToO on October 4–6, 2020. Observations were performed in the hexagonal pointing pattern (HEX), providing a nearly uninterrupted monitoring of the source variability during the entire 180 ks observational run. The 30–150 keV spectrum was extracted from the IBIS/ISGRI (Ubertini et al. 2003; Lebrun et al. 2003) data using a proprietary analysis package developed at the Space Research Institute (details available in Krivonos et al. 2010; Churazov et al. 2014). We also produced long time series with 100s resolution using IBIS/ISGRI data in the 30–60 keV band and JEM-X (Lund et al. 2003) data in the 3–12 keV band using the OSA 11. 1 package.
3.2 Optical observations
3.2.1 1.6 m Sayan telescope
We used the 1.6 m Sayan telescope of the Institute of Solar-Terrestrial Physics (ISTP) of the Russian Academy of Sciences observatory to perform initial observations of the source following its discovery. The spectrum with a 7 Å resolution in the 4000–9500 Å band with a mean signal-to-noise ratio of 20 was obtained with the ADAM spectrometer (Afanasiev et al. 2016; Burenin et al. 2016). Unfortunately, the seeing conditions were unfavorable during these observations.
3.2.2 CMO SAI MSU
The optical spectroscopic observations were performed on the 2.5 m telescope of the Caucasian Mountain Observatory of the Sternberg Astronomical Institute of Moscow State University (Kornilov et al. 2014; Shatsky et al. 2020), which is equipped with the Transient Double-beam Spectrograph (TSD1, Potanin et al. 2020) in the 3500–7400 Å range with a spectral resolution of R ~ 1500. The first spectrum was obtained on March 27, 2020, but most of the observations (nine nights) were carried out in August–October 2020. During each observational night, from two to ten spectra were acquired with an exposure time of ≃20 min, which provides a signal-to-noise ratio of 10–30 for a single spectrum. The data reduction was performed in a standard way as described in Potanin et al. (2020). It includes dark frame subtraction, cleaning for cosmic rays, 2D wavelength calibration with a Ne-Kr-Pb arc lamp, and flat-field correction.
The radiation flux was integrated within an aperture of 3 arc-sec and the background was estimated using the clean regions above and below the target and was removed before the integration. The flux was calibrated using ESO spectral standards2. However, because we used a narrow slit, an absolute calibration was impossible due to the slit losses. Using the night-sky emission lines, the wavelength calibration was corrected to an accuracy of 0.2 and 0.1 Å in the blue and red beam of the TDS spectrograph, respectively.
Additionally, photometric observations in g, r, i bands were obtained from March 27 to October 17, 2020, with the automated 60 cm RC600 telescope of CMO SAI MSU (Berdnikov et al. 2020). Optical monitoring carried out in August–October, 2020 revealed that AT2019wey demonstrated some variability from 0.1 magnitude (in the r band) to 0.2 magnitude (in the g band) during 3–1 h of observations. In this case, the accuracy of individual measurements was from 0.01 (r band) to 0.02 (g band) magnitude.
Near-infrared J, H, K photometry was performed from August to October 2020 with the ASTRONIRCAM camera-spectrograph of the 2.5 m telescope CMO SAI MSU (Nadjip et al. 2017). Photometric measurements were converted into pha-files using the flx2xsp procedure from the FT00LS package. The measurement results are presented in the Table 2.
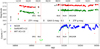 |
Fig. 1 Upper panel: light curve of AT2019wey as observed by ZTF and Gaia. The dotted vertical lines denote the times at which the source was observed by SRG, NuSTAR, and INTEGRAL. The dotted black lines show a linear decay with 4 mmag day−1 for observations in December 2019–January 2020 and 1 mmag day−1 for observations in August-December 2020. Ticks at top of the panel show the beginnings of the corresponding months in MM/YY format. Lower panel: ART-XC (red points), NICER (blue points), and Swift/XRT (green points) count rates in the broad energy bands (4–12 keV for ART-XC, 0.4–9 keV for NICER, and 0.3-9 keV for Swift/XRT). The Swift/XRT data are arbitrarily scaled to roughly match the NICER observations, and ART-XC data are scaled for clarity. The dotted vertical lines show the times of the SRG, NuSTAR, and INTEGRAL observations. |
3.2.3 Swift/UVOT
The Swift/UVOT (Roming et al. 2005) data were used to expand our spectral energy distributions (SED) into the ultraviolet range. We performed photometry in different filters using standard preprocessed images and the uvotsource tool, extracting the source counts from the recommended 5″ radius.
The UVOT observations performed in April 2020 were coad-ded to improve the statistics and to secure the source detection in bluer filters. Given the lack of a strong week-scale variability in both the optical and X-ray bands, we concluded that the source variability is negligible.
Near-infrared J, H, K photometry of AT2019wey as observed by ASTRONIRCAM CMO SAI MSU.
4 Observational properties
4.1 Long-term evolution
A combined long-term optical – X-ray light curve of SRGA J043520.9+552226 is shown in Fig. 1. Long-term optical photometric observations in g, r-filters from ZTF (Masci et al. 2019) were obtained through the Lasair alert broker (Smith et al. 2019) and were augmented with Gaia measurements.
The latest nondetection of the source by Gaia allows us to place an upper limit on the source brightness immediately before the outburst, assuming that during a single scan, Gaia reaches at least 19 magnitude in the G filter. The light curve clearly shows that after a sharp rise, the source underwent a long steady decay with a mean rate of 0.04 magnitude per day in the ZTF r filter. Two months after the beginning of the outburst, AT2019wey reached a plateau at the ≈ 17.65 r-filter magnitude. After a gap due to the lack of source visibility, it was found to be bright again, with another long plateau, decaying at approximately 0.01 magnitude per day. Two-filter ZTF photometry suggests no obvious color evolution throughout the outburst.
To trace the variability of the X-ray emission, we produced light curves based on all available Swift/XRT and NICER observations. The Swift/XRT light curve in the 0.3–9 keV energy band was binned per observation, while for NICER, we chose a bin of 1 ks in the 0.4–9 keV energy band. We then scaled the Swift/XRT measurements by a factor of 12 in order to roughly match the normalization of NICER observations. A comparison of the optical (ZTF and Gaia) and X-ray long-term light curves presented in Fig. 1 shows that despite the strong variability in X-rays, the optical light curve is nearly featureless.
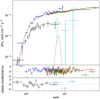 |
Fig. 2 X-ray spectra of SRGA J043520.9+552226 obtained in March-April 2020. The spectrum at the discovery is shown in black (eROSITA) and cyan (ART-XC) and is scaled down by a factor of two for clarity. The spectrum of the first NuSTAR observation is shown by green and red points (NuSTAR A and B mirror modules, respectively). The blue points correspond to Swift/XRTdata. The solid black line shows the best-fit model for the NuSTAR + Swift/XRT observation, and the dashed black line indicates a Fe Kα line contribution. The dashed red line corresponds to the best-fit model for the SRG observation. |
4.2 Observations in March–April 2020: low-hard state
The first X-ray spectrum of SRGA J043520.9 + 552226 was obtained by SRG on March 18, 2020. The joint eROSITA/ART-XC spectrum, shown in Fig. 2, was described with a simple absorbed power law (tbabs*pow in the XSPEC notation). Hereafter we use elemental abundances from Wilms et al. (2000) and cross-sections from Verner et al. (1996). The absorbing column density was measured to be  , and the photon index was
  The total observed flux in the 0.2–20 keV energy band can be estimated as FX = (3.2 ± 0.5) × 10−11 erg cm−2 s−1. All errors correspond to a 90% confidence interval.
We then employed the first NuSTAR observation, performed on April 18, 2020, and merging first four Swift/XRT observations to study the broadband X-ray spectrum with a higher sensitivity. The X-ray spectra shown in Fig. 2 could be described by a simple power law with a photon index of Γ ≈ 1.8 in the whole 0.5–80 keV range with an addition of a weak Fe Kα line. The best-fit parameters of the const*tbabs*(pow + gauss) model are listed in Table 3. The parameters of the Fe Kα line are not well constrained, and we decided to freeze its centroid at 6.4 keV during the fit. Notably, neither the spectral shape of SRGA J043520.9+552226 or its flux changed significantly over the month between the discovery and the NuSTAR observation.
Using NuSTAR data, we also extracted the source light curve in the 3–78 keV energy band. After the barycentric correction, the power spectrum of the source variability exhibits the typical shape for black-hole transients with a strong low-frequency noise (LFN) and a narrow peak of quasi-periodic oscillations (QPO) with a central frequency of ≃55 mHz (Fig. 3) and high-quality factor (defined as the ratio of the peak frequency to the peak FWHM) Q ≈ 15. From the overall shape of the power spectrum, we can identify the QPO to be of type C, according to the classification scheme of Casella et al. (2005). Although type C QPOs below 0.1 Hz are rare, they have previously been observed in several transient black-hole binaries, for example, in MAXI J1820 + 070 (Buisson et al. 2019).
The energy spectrum and timing properties suggest that during the March-April of 2020, the source was in the classical low-hard state (see, e.g., Homan & Belloni 2005; Gilfanov 2010 for the state definitions). Similar states are often observed during the rise stage of outbursts, including in short-period black-hole binaries, which are thought to be the parent class of SRGA J043520.9+552226 (Yao et al. 2021b). In particular, in early observations of MAXI J1659-152 (Kennea et al. 2011), a similar hard spectrum was observed along with QPOs at 148 mHz, although the source rapidly brightened during these observations, while SRGA J043520.9+552226 remained at a similar flux level for at least a month between March 18 and April 18. Perhaps a more relevant example is XTE J1118+480, where a similar combination of low-frequency QPOs (85 mHz) and hard spectrum was observed during the plateau phase of a mini-outburst (Frontera et al. 2003).
Best-fit parameters of X-ray spectrum obtained with NuSTAR/Swift/XRT in April 2020.
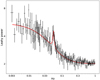 |
Fig. 3 Power density spectrum (in Leahy units) of the first NuSTAR observation. In addition to a strong low-frequency noise, a prominent QPO peak is seen at 55 mHz. |
4.3 The July-November 2020 plateau
Optical observations in July–August 2020 found the source to be still active. The ZTF light curve demonstrates a long, smooth plateau, with a gradual decay of about one millimagnitude per day in the r filter. During this stage, the source was extensively monitored by Swift/XRT and NICER. The X-ray count rates presented in Fig. 1 suggest that the X-ray emission varied significantly during this period. A detailed analysis of NUII observation by Yao et al. (2021b) showed that X-ray spectrum underwent drastic change, with the appearance of a thermal disk emission and a strong reflection component. Applying a complex spectral model, consisting of a thermal disk emission upscattered by a Comptonizing electron cloud (Steiner et al. 2017) simplcutx(diskbb) plus the relativistic reflection model relxillCp (García et al. 2014; Dauser et al. 2014), Yao et al. (2021b) estimated the physical parameters of the accretion disk, that is, its inclination and the radius of the inner boundary. Using the data from NICER monitoring, they also showed that the variability of X-ray flux is primarily due to an accretion disk, while the power-law component, usually associated with a coronal emission, remains relatively stable. Because this conclusion was drawn from the analysis of data below 10 keV, it is interesting to take an another look at the variability of the high-energy emission. Notably, no strong correlation between soft X-rays and optical brightness of SRGA J043520.9+552226 was seen.
At first, we examined two long NuSTAR observations obtained at this stage (NUII and NUIII). We used the simple pexrav model (Magdziarz & Zdziarski 1995) to describe only the hard X-ray part of the spectrum above 10 keV and study its evolution over time. For source spectra in the two NuSTAR observations, this model has three free parameters defining the shape of the Comptonized emission: the power-law index Γ, the reflected fraction R, and the cutoff energy Ecut. The cutoff energy was not well constrained, providing only lower limits (90%) of > 100 keV and > 200 keV for NUII and NUIII, respectively. Therefore it was fixed at 1000 keV in the following approximations. In the course of ≈ 10 days, while the reflected fraction R grew from  to
to  , the power-law index softened from
  to
to  We also estimated hard X-ray fluxes (in the 10-100 keV band) for both observations as 9.4 × 10⁻¹⁰ and 8.9 × 10⁻¹⁰ erg cm−2 s−1, respectively.
Motivated by the hardness of the observed spectrum, we initiated joint follow-up observations with ART-XC, INTEGRAL, and Swift/XRT in order to probe even higher energies and to study the evolution of the high-energy part of the spectrum. In order to describe a broadband energy spectrum, we extended our model, adding components that represent the multicolor blackbody disk and iron fluorescent line (i.e., tbabs (diskbb + gauss + pexrav)). This model provides an adequate description of the observed spectrum (see Fig. 4 and Table 4).
Interestingly, even the addition of the INTEGRAL data is not enough to securely constrain the cutoff energy Ecut, yielding again only a lower limit of Ecut > 700 keV. From the spectral fit, it is also evident that the incident power law became slightly softer, with  The reflected fraction R continued to grow, while the 10–100 keV X-ray flux decreased to 7.6 × 10⁻¹⁰ erg cm−2 s−1. Thus we can conclude that despite of the ~20% decrease in the hard X-ray flux over 50 days, no corresponding changes in the optical brightness are observed.
Assuming a disk-on geometry (consistent with i ≲ 30° obtained by Yao et al. 2021b) and using a color-correction factor (Kubota et al. 1998), we can estimate the inner radius of the accretion disk Rin from a derived normalization of multicolor blackbody disk component as  km, where Dkpc is the distance to the source in kiloparsec. During the high-intermediate state, an inner disk boundary should be close to the radius of the innermost stable circular orbit RISCO. For a plausible distance of 5 kpc, we estimated Rin ≈ 17 km, which is comparable with RISCO = 14 km for a typical black hole in LMXBs (Corral-Santana et al. 2016) with a mass of 6 M⊙ and high spin (a = 0.98), which is also commonly observed in LMXBs (Miller & Miller 2015). At the same time, even for an extreme distance of 10 kpc, SRGA J043520.9+552226 could not host a black hole with a mass >30 M⊙.
Long INTEGRAL observation also provided the possibility of studying the long-scale variability of SRGA J043520.9+552226. We analyzed source light curves obtained by the IBIS, JEM-X, and ART-XC instruments, but no periodic variability was found in data on 0.1–5000 s timescales.
Overall, the SRGA J043520.9+552226 spectral shape measured during observations at the plateau stage indicates that the source was in the hard-intermediate state, with a prominent and variable thermal disk and hard nonthermal emission with a strong reflection component. We found a significant spectral variability above 20 keV, but there is no corresponding variability in the optical emission (see Figs. 1 and 4).
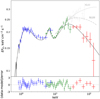 |
Fig. 4 Energy spectra of the joint Swift/XRT-ART-XC-INTEGRAL/IBIS observation. Blue points are from Swift/XRT, green points represent ART-XC data, and red points are INTEGRAL/IBIS measurements. the solid black line shows the best-fit model, and dashed and dot-dashed lines are best fits to NUII and NUIII data (only data from module A are shown), shown with gray crosses. |
Best-fit parameters of X-ray spectra obtained during the plateau stage.
4.4 Optical observations at the CMO SAI telescopes
We have obtained a few dozen optical spectra of the source with the CMO SAI 2.5 m telescope at different dates between March 2020 and November 2020. The spectrum exhibits a significant intra-night and night-to-night variability that is mainly produced by continuum variations.
The stacked normalized optical spectrum is presented in Fig. 5. The hydrogen Balmer absorption lines (Hα–Hϵ) and diffuse interstellar band features are clearly seen. The Hα line profile is composed of a broad absorption component and a narrow emission core. Weaker emission lines are clearly seen in the spectrum at 4600–4700 Å, including the Bowen blend of Ciii, Niii emission lines at 4630–4660 Å, and the He ii 4686 Å line. This blend is thought to arise on the surface of the optical star, which experiences strong UV-X-ray irradiation from the accretion disk and corona (Schachter et al. 1989). A detection of this feature gives an another possibility for the measurement of the orbital motion (Cornelisse et al. 2008), which is crucial for a determination of the mass of the compact object. Because this blend is not readily seen in single spectra obtained with large telescopes (Yao et al. 2021a), however, such measurements will likely require a massive observational campaign. The He ii 4686Å line has an FWHM ~ 1500km s−1 that suggests the presence of a high mass in the system if the velocity traces the gravitational potential. Another possibility to achieve V ~ 1000 kms−1 is an acceleration in a wind, but in this case, strong emission lines, related to the circumstellar gas, should be observed. Some weaker lines are probably also traced in the spectrum, for example, the feature at 5193 Å, which has also been detected by Neustroev et al. (2014) in SWIFT J1753.5–0127. The identification of this line is unclear, but as the authors argue, it is formed in the donor star.
Using all available data, we tried to trace the evolution of the SED in the range from the IR to the NUV during the outburst. In the left panel of Fig. 6 we show three sets of photometric measurements: one obtained by UVOT in April 2020 during the low-hard state, and two sets of optical-NIR points acquired with CMO SAI and UVOT in August–October 2020.
Yao et al. (2021a) constrained the interstellar extinction toward the source to be 0.8 ≲ EV ≲ 1.2 using measurements of equivalent widths of several diffuse interstellar band (DIB) features. Therefore we tried to fit the composite NUV-OIR SED obtained in August with the redden*pow model (Cardelli et al. 1989), using three fixed values of the reddening, E(B–V) = 0.8,1.0, and 1.2. These single power laws fit the data poorly, especially in the NIR, indicating a more complex shape of the underlying continuum, which is not unexpected. In particular, a collimated jet was shown during radio observations on August 28, 2020 (Yao et al. 2021a). Such a jet can contribute to the NIR continuum, while the irradiated disk and the secondary star dominate in the UV-optical emission. We therefore excluded a K-band measurement from the fits to limit the jet contribution to the SED. The resulting fits are shown in the right panel of Fig. 6. It is hard to securely constrain the SED shape in the absence of precise measurements of the extinction toward the source.
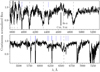 |
Fig. 5 Averaged continuum-normalized optical spectrum. The positions of the Balmer lines are marked with the dashed lines. Many narrow features have an interstellar origin and are marked with the blue lines. |
5 Discussion
It is worth noting that the optical spectra of SRGA J043520.9+552226 display broad absorption and emission lines (see Fig. 5 and the discussion in Yao et al. 2021a). Model optical spectra of irradiated accretion disks can demonstrate both absorption (Suleimanov 1996) and emission lines (Hubeny & Long 2021), depending on the X-ray illumination from the inner parts. In these models, the viscosity alpha-parameter is also significant: the smaller alpha, the smaller the equivalent width of the absorption lines (mostly hydrogen Banner lines). A strong external illumination of the disk makes the absorption lines shallow and can even invert them into emissions (Hubeny & Long 2021). Therefore an accurate modeling of the disk line spectrum can probe the accretion physics.
The broadband continuum emission of accretion disks is usually described by the disk black body model. The electron scattering should also be taken into account. It is well known (see, e.g., Zel’dovich & Shakura 1969; Shakura & Sunyaev 1973; Taam & Meszaros 1987) that the electron scattering changes the spectrum (modified blackbody radiation). Instead of the standard disk power-law dependence fv ~ v1/3, the broadband disk continuum becomes almost flat at high frequencies. In LMXBs with black holes, the external X-ray illumination of the outer disk also significantly modifies the low-energy part of the disk spectrum, up to inverting it to fv ~ v−1 (usually in the IR bands); at even lower frequencies, the spectrum becomes the Rayleigh-Jeans continuum (see, e.g., Kato et al. 2008).
By adopting the standard interstellar absorption (see Sect. 4.4 above), we can determine the power-law approximation to the broad band IR-UV spectrum of the source. Depending on the assumed EB–v, within the allowed ranges from 0.8 to 1.2 (Yao et al. 2021a), the power-law continuum of the quasi-simultaneous SAI CMO - Swift/UVOT observations (August 27, 2020; the red points in the left panel of Fig. 6) can be approximately fit as fv~ vα with α = 0.7, 1.2, and 1.7 for EB–V = 0.8, 1.0, and 1.2, respectively (Fig. 6, right panel). This is close to what is observed by other telescopes (α ≈ 0.75 for EB–V =0.8 for the March 2020 observations, Yao et al. 2021a). For EB–V ≃ 1, these power-law approximations can be consistent with model accretion disk calculations α ≈ 0.9 (Suleimanov 1996; Hubeny & Long 2021). However, an account of the external X-ray irradiation of a modified blackbody disk atmosphere would tend to flatten the continuum (i.e., decrease the model power-law photon index from fv ~ v0. 9), and could explain fv ~ v0.75 obtained for smaller EB–V = 0.8 – 0.9. This issue can be quite interesting and important for black-hole transients, but this is beyond the scope of the present study and should be further investigated.
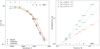 |
Fig. 6 Left panel: NIR-optical-NUV SEDs. The black points denote measurements obtained with UVOT in April 2020, the red points mark quasi-simultaneous CMO and UVOT observations around August 27, 2020, and the green point shows the CMO photometry on October 16, 2020. Right panel: August CMO-UVOT composite SED, dereddened using different extinction coefficients (EB–V = 0.8, 1.0, 1.2) and fit with power-law models. |
6 Summary
The Mikhail Pavlinsky ART-XC discovery of SRGA J043520.9+552226, the X-ray counterpart of AT2019wey, triggered an extensive observational campaign of the source. Follow-up observations in radio, optical, and X-rays allowed us to establish SRGA J043520.9+552226 as a new LMXB and a Galactic microquasar in outburst.
In particular, joint observations with ART-XC, INTEGRAL, and Swift/XRT were performed to probe the source properties at high energies and to study the evolution of the high-energy part of the spectrum. Despite the addition of the INTEGRAL data, we were unable to securely constrain the cutoff energy Ecut, yielding only a lower limit of Ecut > 700 keV. Although we do find some evolution in high-energy emission of the source during the long plateau stage, it is still unclear how to interpret its broadband SED correctly, with possible contributions from the accretion disk, corona, and jets, as the lack of a strong Lopt – LX correlation is unexpected for such systems. The detection of LF QPOs in the early stage of the outburst provides another strong indication that during April–March 2020, the source was in a typical low-hard state of black-hole X-ray binaries, but the rise time of the outburst in X-rays was significantly longer than usual for such systems.
Based on the CMO data, we detected the Bowen blend in the stacked optical spectrum of the source. This blend likely originates in the illuminated atmosphere of the optical companion and offers the possibility of determining the orbital parameters of the system. This is promising, given that SRGA J043520.9+552226 is still bright in the optical more than a year after its discovery.
The broadband NIR-UV continuum of the source significantly changed over the period from April to October 2020. It can be roughly fit by a power law fv~vα with α~ 0.7–1.7, depending on the assumed interstellar reddening. The power law of the NIR-UV continuum and shallow absorption lines could originate in an X-ray irradiated accretion disk around a compact object, presumably a black hole. The system has been in outburst since the discovery and deserves further multiwavelength investigation.
Acknowledgements
We thank the anonymous referee for useful comments. This work is based on data from Mikhail Pavlinsky ART-XC and eROSITA, X-ray instruments aboard the SRG observatory. The SRG observatory was built by Roskosmos in the interests of the Russian Academy of Sciences represented by its Space Research Institute (IKI) in the framework of the Russian Federal Space Program, with the participation of the Deutsches Zentrum für Luft- und Raum-fahrt (DLR). The eROSITA X-ray telescope was built by a consortium of German Institutes led by MPE, and supported by DLR. The SRG spacecraft was designed, built, launched and is operated by the Lavochkin Association and its subcontractors. The science data are downlinked via the Deep Space Network Antennae in Bear Lakes, Ussurijsk, and Baykonur, funded by Roskosmos. The eROSITA data used in this work were processed using the eSASS software system developed by the German eROSITA consortium and proprietary data reduction and analysis software developed by the Russian eROSITA Consortium. The ART-XC and eROSITA teams thank the Russian Space Agency, Russian Academy of Sciences and State Corporation Rosatom for the support of the SRG project and ART-XC telescope and the Lavochkin Association (NPOL) with partners for the creation and operation of the SRG spacecraft (Navigator). In this work we used also data from NuSTAR and INTEGRAL observatories. INTEGRAL is an ESA project with instruments and science data centre funded by ESA member states (especially the PI countries: Denmark, France, Germany, Italy, Switzerland, Spain) and with the participation of Russia and the USA. This research has made use of data, software and/or web tools obtained from the High Energy Astrophysics Science Archive Research Center (HEASARC). This work made use of data supplied by the UK Swift Science Data Centre at the University of Leicester. Observations in X-rays and corresponding data analysis were performed under support of the Russian Science Foundation grant 19-12-00423, to which I.A.M., A.A.L., S.A.N. and S.V.M. are grateful. The work of A.V.D. and A.M.T. was partially supported by the RSF grant 17-12-01241 (optical and IR data reduction). Optical observations at SAI MSU 2.5-m telescope are supported by the Interdisciplinary Scientific Educational School of Moscow University “Fundamental and applied space research”.
References
- Afanasiev, V. L., Dodonov, S. N., Amirkhanyan, V. R., & Moiseev, A. V. 2016, Astrophys. Bull., 71, 479 [NASA ADS] [CrossRef] [Google Scholar]
- Alam, S., Albareti, F. D., Allende Prieto, C., et al. 2015, ApJS, 219, 12 [Google Scholar]
- Berdnikov, L. N., Belinskii, A. A., Shatskii, N. I., et al. 2020, Astron. Rep., 64, 310 [NASA ADS] [CrossRef] [Google Scholar]
- Bilir, S., Karaali, S., Ak, S., et al. 2009, MNRAS, 396, 1589 [CrossRef] [Google Scholar]
- Brunner, H., Boller, T., Coutinho, D., et al. 2018, SPIE Conf. Ser., 10699, 106995G [Google Scholar]
- Buisson, D. J. K., Fabian, A. C., Barret, D., et al. 2019, MNRAS, 490, 1350 [NASA ADS] [CrossRef] [Google Scholar]
- Burenin, R. A., Amvrosov, A. L., Eselevich, M. V., et al. 2016, Astron. Lett., 42, 295 [Google Scholar]
- Burrows, D. N., Hill, J. E., Nousek, J. A., et al. 2005, Space Sci. Rev., 120, 165 [Google Scholar]
- Cardelli, J. A., Clayton, G. C., & Mathis, J. S. 1989, ApJ, 345, 245 [Google Scholar]
- Casella, P., Belloni, T., & Stella, L. 2005, ApJ, 629, 403 [Google Scholar]
- Chambers, K. C., Magnier, E. A., Metcalfe, N., et al. 2016, ArXiv e-prints [arXiv:1612.05560] [Google Scholar]
- Churazov, E., Sunyaev, R., Isern, J., et al. 2014, Nature, 512, 406 [NASA ADS] [CrossRef] [Google Scholar]
- Cornelisse, R., Casares, J., Muñoz-Darias, T., et al. 2008, AIP Conf. Ser., 1010, 148 [NASA ADS] [CrossRef] [Google Scholar]
- Corral-Santana, J. M., Casares, J., Muñoz-Darias, T., et al. 2016, A&A, 587, A61 [NASA ADS] [CrossRef] [EDP Sciences] [Google Scholar]
- Dauser, T., Garcia, J., Parker, M. L., Fabian, A. C., & Wilms, J. 2014, MNRAS, 444, L100 [Google Scholar]
- Evans, P. A., Beardmore, A. P., Page, K. L., et al. 2009, MNRAS, 397, 1177 [Google Scholar]
- Frontera, F., Amati, L., Zdziarski, A. A., et al. 2003, ApJ, 592, 1110 [NASA ADS] [CrossRef] [Google Scholar]
- Gaia Collaboration (Prusti, T., et al.) 2016, A&A, 595, A1 [NASA ADS] [CrossRef] [EDP Sciences] [Google Scholar]
- García, J., Dauser, T., Lohfink, A., et al. 2014, ApJ, 782, 76 [Google Scholar]
- Gehrels, N., Chincarini, G., Giommi, P., et al. 2004, ApJ, 611, 1005 [Google Scholar]
- Gendreau, K. C., Arzoumanian, Z., & Okajima, T. 2012, SPIE Conf. Ser., 8443, 844313 [Google Scholar]
- Gilfanov, M. 2010, X-Ray Emission from Black-Hole Binaries, eds. T. Belloni (Berlin: Springer), 794, 17 [NASA ADS] [Google Scholar]
- Green, G. M., Schlafly, E., Zucker, C., Speagle, J. S., & Finkbeiner, D. 2019, ApJ, 887, 93 [NASA ADS] [CrossRef] [Google Scholar]
- Harrison, F. A., Craig, W. W., Christensen, F. E., et al. 2013, ApJ, 770, 103 [Google Scholar]
- Homan, J., & Belloni, T. 2005, Ap&SS, 300, 107 [Google Scholar]
- Hubeny, I., & Long, K. S. 2021, MNRAS, 503, 5534 [CrossRef] [Google Scholar]
- Kato, S., Fukue, J., & Mineshige, S. 2008, Black-Hole Accretion Disks-Towards a New Paradigm (Kyoto: Kyoto University Press) [Google Scholar]
- Kennea, J. A., Romano, P., Mangano, V., et al. 2011, ApJ, 736, 22 [NASA ADS] [CrossRef] [Google Scholar]
- Kornilov, V., Safonov, B., Kornilov, M., et al. 2014, PASP, 126, 482 [NASA ADS] [CrossRef] [Google Scholar]
- Krivonos, R., Revnivtsev, M., Tsygankov, S., et al. 2010, A&A, 519, A107 [NASA ADS] [CrossRef] [EDP Sciences] [Google Scholar]
- Kubota, A., Tanaka, Y., Makishima, K., et al. 1998, PASJ, 50, 667 [NASA ADS] [CrossRef] [Google Scholar]
- Lebrun, F., Leray, J. P., Lavocat, P., et al. 2003, A&A, 411, L141 [NASA ADS] [CrossRef] [EDP Sciences] [Google Scholar]
- Lund, N., Budtz-Jørgensen, C., Westergaard, N. J., et al. 2003, A&A, 411, L231 [NASA ADS] [CrossRef] [EDP Sciences] [Google Scholar]
- Lyapin, A., Zaznobin, I., Khorungev, G., et al. 2020, ATel, 13576, 1 [NASA ADS] [Google Scholar]
- Magdziarz, P., & Zdziarski, A. A. 1995, MNRAS, 273, 837 [Google Scholar]
- Masci, F. J., Laher, R. R., Rusholme, B., et al. 2019, PASP, 131, 018003 [Google Scholar]
- Mereminskiy, I., Pavlinsky, M., Lapshov, I., et al. 2019, ATel, 13095, 1 [NASA ADS] [Google Scholar]
- Mereminskiy, I., Lutovinov, A., Semena, A., et al. 2020a, ATel, 14051, 1 [NASA ADS] [Google Scholar]
- Mereminskiy, I., Medvedev, P., Semena, A., et al. 2020b, ATel, 13571, 1 [Google Scholar]
- Mereminskiy, I., Semena, A., Pavlinsky, M., et al. 2020c, ATel, 13606, 1 [NASA ADS] [Google Scholar]
- Miller, M. C., & Miller, J. M. 2015, Phys. Rep., 548, 1 [NASA ADS] [CrossRef] [Google Scholar]
- Muno, M. P., Lu, J. R., Baganoff, F. K., et al. 2005, ApJ, 633, 228 [NASA ADS] [CrossRef] [Google Scholar]
- Nadjip, A. E., Tatarnikov, A. M., Toomey, D. W., et al. 2017, Astrophys. Bull., 72, 349 [NASA ADS] [CrossRef] [Google Scholar]
- Neustroev, V. V., Veledina, A., Poutanen, J., et al. 2014, MNRAS, 445, 2424 [NASA ADS] [CrossRef] [Google Scholar]
- Pavlinsky, M., Tkachenko, A., Levin, V., et al. 2021, A&A, 650, A42 [EDP Sciences] [Google Scholar]
- Potanin, S. A., Belinski, A. A., Dodin, A. V., et al. 2020, Astron. Lett., 46, 836 [NASA ADS] [CrossRef] [Google Scholar]
- Predehl, P., Andritschke, R., Arefiev, V., et al. 2021, A&A, 647, A1 [EDP Sciences] [Google Scholar]
- Roming, P. W. A., Kennedy, T.E., Mason, K. O., et al. 2005, Space Sci. Rev., 120, 95 [NASA ADS] [CrossRef] [Google Scholar]
- Schachter, J., Filippenko, A. V., & Kahn, S. M. 1989, ApJ, 340, 1049 [NASA ADS] [CrossRef] [Google Scholar]
- Semena, A., Mereminskiy, I., Lutovinov, A., Molkov, S., & Pavlinsky, M. 2020, ATel, 13415, 1 [Google Scholar]
- Semena, A., Doroshenko, V., Arefiev, V., et al. 2021, ATel, 14357, 1 [Google Scholar]
- Shahbaz, T., & Kuulkers, E. 1998, MNRAS, 295, L1 [NASA ADS] [Google Scholar]
- Shakura, N. I., & Sunyaev, R. A. 1973, A&A, 500, 33 [NASA ADS] [Google Scholar]
- Shatsky, N., Belinski, A., Dodin, A., et al. 2020, in Ground-Based Astronomy in Russia. 21st Century, 1, 127 [CrossRef] [Google Scholar]
- Smith, D. A., & Dhillon, V. S. 1998, MNRAS, 301, 767 [NASA ADS] [CrossRef] [Google Scholar]
- Smith, K. W., Williams, R. D., Young, D. R., et al. 2019, Res. Notes Am. Astron. Soc., 3, 26 [Google Scholar]
- Steiner, J. F., Garcia, J. A., Eikmann, W., et al. 2017, ApJ, 836, 119 [NASA ADS] [CrossRef] [Google Scholar]
- Suleimanov, V. F. 1996, Astron. Lett., 22, 92 [NASA ADS] [Google Scholar]
- Sunyaev, R., Arefiev, V., Babyshkin, V., et al. 2021, A&A, 656, A132 [NASA ADS] [CrossRef] [EDP Sciences] [Google Scholar]
- Taam, R. E., & Meszaros, P. 1987, ApJ, 322, 329 [NASA ADS] [CrossRef] [Google Scholar]
- Tetarenko, B. E., Sivakoff, G. R., Heinke, C. O., & Gladstone, J. C. 2016, ApJS, 222, 15 [Google Scholar]
- Tonry, J. L., Denneau, L., Heinze, A. N., et al. 2018, PASP, 130, 064505 [Google Scholar]
- Ubertini, P., Lebrun, F., Di Cocco, G., et al. 2003, A&A, 411, L131 [CrossRef] [EDP Sciences] [Google Scholar]
- Verner, D. A., Ferland, G. J., Korista, K. T., & Yakovlev, D. G. 1996, ApJ, 465, 487 [Google Scholar]
- Wijnands, R., In’t Zand, J. J. M., Rupen, M., et al. 2006, A&A, 449, 1117 [NASA ADS] [CrossRef] [EDP Sciences] [Google Scholar]
- Wilms, J., Allen, A., & McCray, R. 2000, ApJ, 542, 914 [Google Scholar]
- Winkler, C., Courvoisier, T. J. L., Di Cocco, G., et al. 2003, A&A, 411, L1 [NASA ADS] [CrossRef] [EDP Sciences] [Google Scholar]
- Yadlapalli, N., Ravi, V., Yao, Y., Kulkarni, S. R., & Brisken, W. 2021, ApJ, 909, L27 [NASA ADS] [CrossRef] [Google Scholar]
- Yao, Y., Kulkarni, S. R., Burdge, K. B., et al. 2021a, ApJ, 920, 120 [NASA ADS] [CrossRef] [Google Scholar]
- Yao, Y., Kulkarni, S. R., Gendreau, K. C., et al. 2021b, ApJ, 920, 121 [NASA ADS] [CrossRef] [Google Scholar]
- Zel’dovich, Y. B., & Shakura, N. I. 1969, Sov. Astron., 13, 175 [NASA ADS] [Google Scholar]
All Tables
Near-infrared J, H, K photometry of AT2019wey as observed by ASTRONIRCAM CMO SAI MSU.
Best-fit parameters of X-ray spectrum obtained with NuSTAR/Swift/XRT in April 2020.
All Figures
|
Fig. 1 Upper panel: light curve of AT2019wey as observed by ZTF and Gaia. The dotted vertical lines denote the times at which the source was observed by SRG, NuSTAR, and INTEGRAL. The dotted black lines show a linear decay with 4 mmag day−1 for observations in December 2019–January 2020 and 1 mmag day−1 for observations in August-December 2020. Ticks at top of the panel show the beginnings of the corresponding months in MM/YY format. Lower panel: ART-XC (red points), NICER (blue points), and Swift/XRT (green points) count rates in the broad energy bands (4–12 keV for ART-XC, 0.4–9 keV for NICER, and 0.3-9 keV for Swift/XRT). The Swift/XRT data are arbitrarily scaled to roughly match the NICER observations, and ART-XC data are scaled for clarity. The dotted vertical lines show the times of the SRG, NuSTAR, and INTEGRAL observations. |
| In the text | |
|
Fig. 2 X-ray spectra of SRGA J043520.9+552226 obtained in March-April 2020. The spectrum at the discovery is shown in black (eROSITA) and cyan (ART-XC) and is scaled down by a factor of two for clarity. The spectrum of the first NuSTAR observation is shown by green and red points (NuSTAR A and B mirror modules, respectively). The blue points correspond to Swift/XRTdata. The solid black line shows the best-fit model for the NuSTAR + Swift/XRT observation, and the dashed black line indicates a Fe Kα line contribution. The dashed red line corresponds to the best-fit model for the SRG observation. |
| In the text | |
|
Fig. 3 Power density spectrum (in Leahy units) of the first NuSTAR observation. In addition to a strong low-frequency noise, a prominent QPO peak is seen at 55 mHz. |
| In the text | |
|
Fig. 4 Energy spectra of the joint Swift/XRT-ART-XC-INTEGRAL/IBIS observation. Blue points are from Swift/XRT, green points represent ART-XC data, and red points are INTEGRAL/IBIS measurements. the solid black line shows the best-fit model, and dashed and dot-dashed lines are best fits to NUII and NUIII data (only data from module A are shown), shown with gray crosses. |
| In the text | |
|
Fig. 5 Averaged continuum-normalized optical spectrum. The positions of the Balmer lines are marked with the dashed lines. Many narrow features have an interstellar origin and are marked with the blue lines. |
| In the text | |
|
Fig. 6 Left panel: NIR-optical-NUV SEDs. The black points denote measurements obtained with UVOT in April 2020, the red points mark quasi-simultaneous CMO and UVOT observations around August 27, 2020, and the green point shows the CMO photometry on October 16, 2020. Right panel: August CMO-UVOT composite SED, dereddened using different extinction coefficients (EB–V = 0.8, 1.0, 1.2) and fit with power-law models. |
| In the text | |
Current usage metrics show cumulative count of Article Views (full-text article views including HTML views, PDF and ePub downloads, according to the available data) and Abstracts Views on Vision4Press platform.
Data correspond to usage on the plateform after 2015. The current usage metrics is available 48-96 hours after online publication and is updated daily on week days.
Initial download of the metrics may take a while.