Fig. 2
Download original image
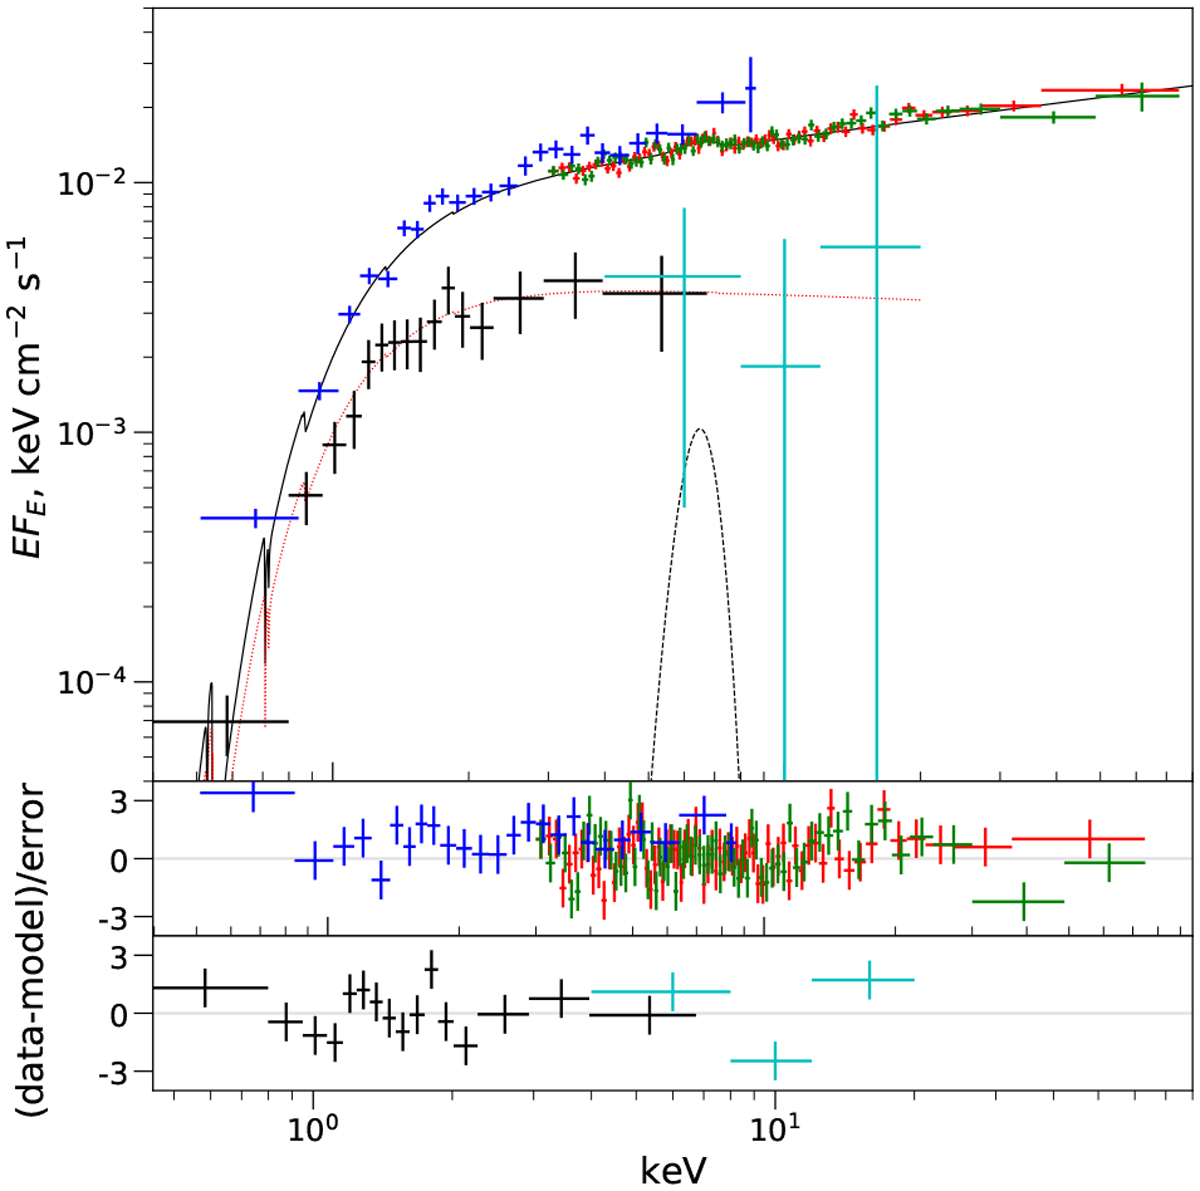
X-ray spectra of SRGA J043520.9+552226 obtained in March-April 2020. The spectrum at the discovery is shown in black (eROSITA) and cyan (ART-XC) and is scaled down by a factor of two for clarity. The spectrum of the first NuSTAR observation is shown by green and red points (NuSTAR A and B mirror modules, respectively). The blue points correspond to Swift/XRTdata. The solid black line shows the best-fit model for the NuSTAR + Swift/XRT observation, and the dashed black line indicates a Fe Kα line contribution. The dashed red line corresponds to the best-fit model for the SRG observation.
Current usage metrics show cumulative count of Article Views (full-text article views including HTML views, PDF and ePub downloads, according to the available data) and Abstracts Views on Vision4Press platform.
Data correspond to usage on the plateform after 2015. The current usage metrics is available 48-96 hours after online publication and is updated daily on week days.
Initial download of the metrics may take a while.