Fig. 1
Download original image
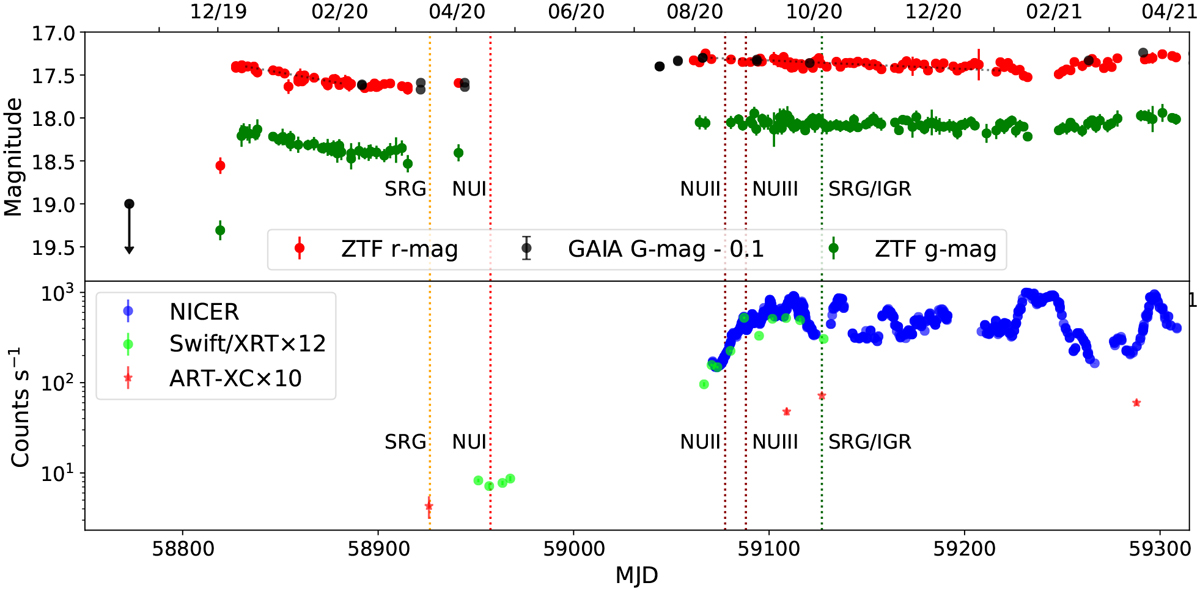
Upper panel: light curve of AT2019wey as observed by ZTF and Gaia. The dotted vertical lines denote the times at which the source was observed by SRG, NuSTAR, and INTEGRAL. The dotted black lines show a linear decay with 4 mmag day−1 for observations in December 2019–January 2020 and 1 mmag day−1 for observations in August-December 2020. Ticks at top of the panel show the beginnings of the corresponding months in MM/YY format. Lower panel: ART-XC (red points), NICER (blue points), and Swift/XRT (green points) count rates in the broad energy bands (4–12 keV for ART-XC, 0.4–9 keV for NICER, and 0.3-9 keV for Swift/XRT). The Swift/XRT data are arbitrarily scaled to roughly match the NICER observations, and ART-XC data are scaled for clarity. The dotted vertical lines show the times of the SRG, NuSTAR, and INTEGRAL observations.
Current usage metrics show cumulative count of Article Views (full-text article views including HTML views, PDF and ePub downloads, according to the available data) and Abstracts Views on Vision4Press platform.
Data correspond to usage on the plateform after 2015. The current usage metrics is available 48-96 hours after online publication and is updated daily on week days.
Initial download of the metrics may take a while.