Fig. 4
Download original image
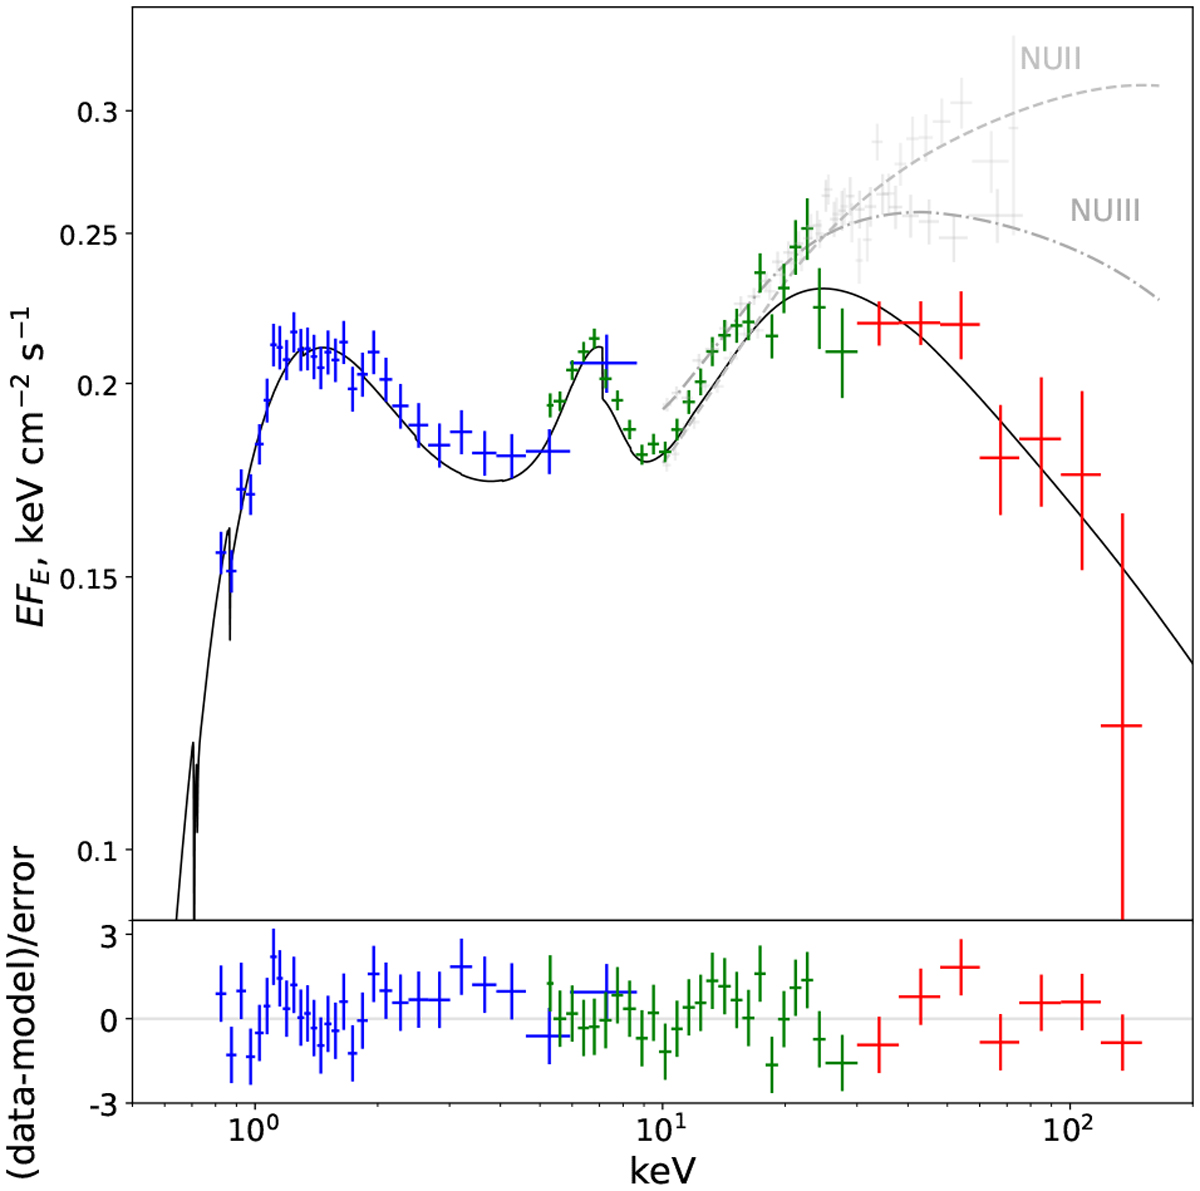
Energy spectra of the joint Swift/XRT-ART-XC-INTEGRAL/IBIS observation. Blue points are from Swift/XRT, green points represent ART-XC data, and red points are INTEGRAL/IBIS measurements. the solid black line shows the best-fit model, and dashed and dot-dashed lines are best fits to NUII and NUIII data (only data from module A are shown), shown with gray crosses.
Current usage metrics show cumulative count of Article Views (full-text article views including HTML views, PDF and ePub downloads, according to the available data) and Abstracts Views on Vision4Press platform.
Data correspond to usage on the plateform after 2015. The current usage metrics is available 48-96 hours after online publication and is updated daily on week days.
Initial download of the metrics may take a while.