Fig. 6
Download original image
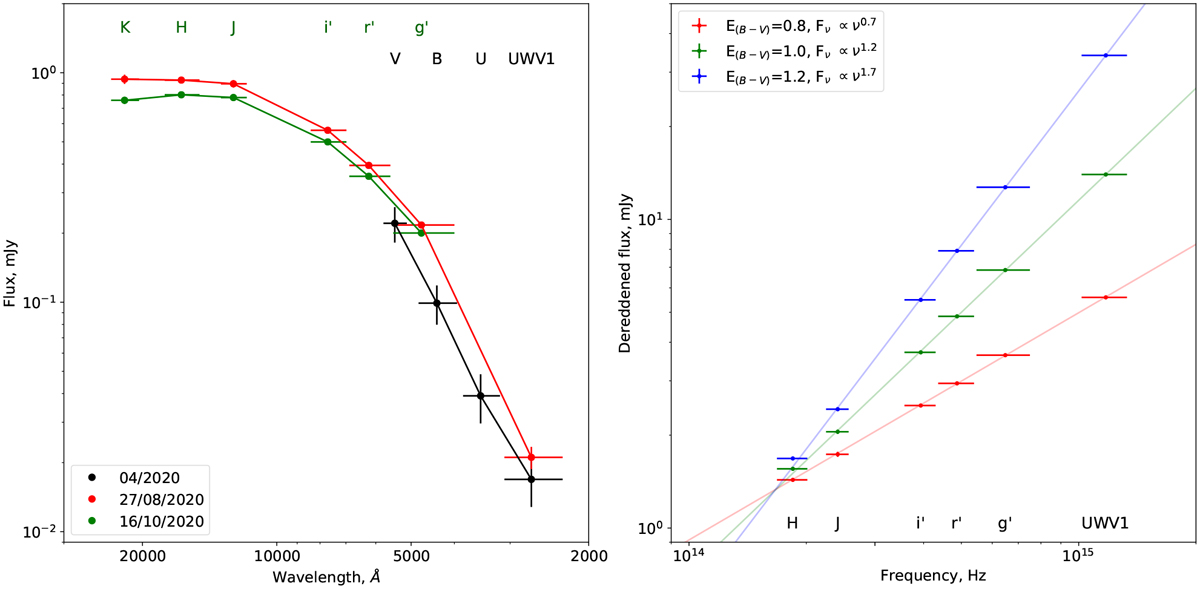
Left panel: NIR-optical-NUV SEDs. The black points denote measurements obtained with UVOT in April 2020, the red points mark quasi-simultaneous CMO and UVOT observations around August 27, 2020, and the green point shows the CMO photometry on October 16, 2020. Right panel: August CMO-UVOT composite SED, dereddened using different extinction coefficients (EB–V = 0.8, 1.0, 1.2) and fit with power-law models.
Current usage metrics show cumulative count of Article Views (full-text article views including HTML views, PDF and ePub downloads, according to the available data) and Abstracts Views on Vision4Press platform.
Data correspond to usage on the plateform after 2015. The current usage metrics is available 48-96 hours after online publication and is updated daily on week days.
Initial download of the metrics may take a while.