| Issue |
A&A
Volume 661, May 2022
The Early Data Release of eROSITA and Mikhail Pavlinsky ART-XC on the SRG mission
|
|
|---|---|---|
| Article Number | A44 | |
| Number of page(s) | 19 | |
| Section | Stellar atmospheres | |
| DOI | https://doi.org/10.1051/0004-6361/202141232 | |
| Published online | 18 May 2022 | |
A first eROSITA view of ultracool dwarfs★
1
Institut für Astronomie & Astrophysik, Eberhard-Karls-Universität Tübingen
Sand 1
72076
Tübingen, Germany
e-mail: stelzer@astro.uni-tuebingen.de
2
INAF – Osservatorio Astronomico di Palermo,
Piazza del Parlamento 1
90134
Palermo, Italy
3
Max-Planck Institut für extraterrestrische Physik
Giessenbachstrasse,
85748
Garching, Germany
Received:
1
May
2021
Accepted:
2
June
2021
We present the first X-ray detections of ultracool dwarfs (UCDs) from the first all-sky survey of the extended ROentgen Survey with an Imaging Telescope Array (eROSITA) onboard the Russian Spektrum-Roentgen-Gamma mission. We use three publicly available input catalogs of spectroscopically confirmed UCDs and Gaia-selected UCD candidates that together comprise nearly 20000 objects. In a careful source identification procedure we first extracted all X-ray sources from the catalog of the first survey, eRASS1, that have a UCD or candidate within three times their positional uncertainty. Then we examined all Gaia objects in the vicinity of these 96 X-ray sources and we associated them to the most plausible counterpart on the basis of their spatial separation to the X-ray position and their multiwavelength properties. This way we find 40 UCDs that have a secure identification with an X-ray source (that is bonafide UCD X-ray emitters) and 18 plausible UCD X-ray emitters for which we consider it likely that the X-ray source has its origin in the UCD. Twenty-one of the bonafide and plausible X-ray emitting UCDs have a spectroscopic confirmation, while the others have been selected based on Gaia photometry and we computed spectral types from the G–J color. The spectral types of the X-ray emitting UCDs and candidates range between M5 and M9. The distances of the eRASS1 UCDs range from 3.5 to 190 pc. The spectroscopically confirmed UCDs at the high end of the distance distribution are known to be members of nearby star forming regions. The majority of the UCDs from the eRASS1 sample show a ratio of X-ray to bolometric luminosity well above the canonical saturation limit of log (Lx/Lbol) ≈ −3. For the two most extreme outliers, we verified the hypothesis that these high values are due to flaring activity through an analysis of the eRASS1 light curve. X-ray spectra could be analyzed for the two brightest objects in terms of count rate, both showing an emission-measure weighted plasma temperature of 〈kT〉 = 0.75 keV. These observations demonstrate the potential of eROSITA for advancing our knowledge on the faint coronal X-ray emission from UCDs by building statistical samples for which the average X-ray brightness, flares, and coronal temperatures can be derived.
Key words: X-rays: stars / stars: activity / stars: coronae / stars: flare / brown dwarfs
Full Tables 1 and 2 are only available at the CDS via anonymous ftp to cdsarc.u-strasbg.fr (130.79.128.5) or via http://cdsarc.u-strasbg.fr/viz-bin/cat/J/A+A/661/A44
© ESO 2022
1 Introduction
Ultracool dwarfs (UCDs) are defined as objects with spectral type (SpT) M7 and later. This group spans the hydrogen-burning mass limit (at M ~ 0.075 M⊙; Baraffe et al. 2002) and it comprises both very low-mass stars and brown dwarfs. By coincidence, for late-M SpTs (Teff ~ 2500 K), the photospheres become effectively neutral, which leads to high electrical resistivity, that is reduced coupling between the magnetic field and matter (Mohanty et al. 2002). This is expected to drastically decrease magnetic activity which is the result of magnetic stress that built up in photospheric fields through their interaction with convective motions. The most widely used observational diagnostics of magnetic activity for M dwarfs is Hα emission from a chromosphere. In fact, a strong drop of Hα emission is observed at late-M and early-L SpTs (e.g., Gizis et al. 2000; Mohanty & Basri 2003; West et al. 2006). On the other hand, numerous studies have detected Hα emission on UCDs, especially during flares (e.g., Liebert et al. 1999; Schmidt et al. 2007). Various possibilities on how late-M and L-type objects may maintain such chromospheric activity have been discussed by Schmidt et al. (2015). With the advent of the Kepler mission white-light flares have been observed on some L dwarfs (Gizis et al. 2013; Paudel et al. 2020), further demonstrating that the magnetic activity in such photospherically cool objects shares many similarities with the phenomena observed on higher-mass late-type stars. Further clues as to the nature of magnetic activity of UCDs can be obtained from a study of their outermost atmospheric layer, the corona, which in active stars is heated to temperatures of several 106 K leading to radiation in the X-ray band.
Stelzer et al. (2013) show that for M dwarfs, coronal X-ray emission is a more sensitive activity diagnostics than Hα emission: many early- to mid-M dwarfs with undetectable Hα emission have been detected with ROSAT in soft X-rays. However, even for the optimistic estimate that the X-ray to bolometric luminosity (Lx/Lbol) remains constant throughout the M and L spectral classes, UCDs are faint X-ray emitters as a result of their low bolometric luminosity. As a consequence, so far only few UCDs have deep enough X-ray observations to constrain their coronal emission (Stelzer et al. 2006a). In fact, X-ray detections of UCDs have remained rare, with only two detections of L dwarfs (Audard et al. 2007; De Luca et al. 2020). On the other hand, the abovementioned higher sensitivity to coronal, rather than chromospheric emission of the currently available instrumentation, might at least partially make up for the weakening of activity signatures at the cool end of the main-sequence. Therefore, the sparse sample of X-ray detected UCDs is likely also related to the lack of a deep wide-area X-ray survey.
Studying the emission level and variability in the X-ray band is essential for understanding the nature of the outer atmospheres of the objects at the bottom of the main-sequence. This is particularly relevant in view of the peculiar behavior of UCDs in the radio band where a violation of the Güdel–Benz relation, an empirical correlation between radio and X-ray luminosities that holds for all other coronal sources (Güdel et al. 1993), is observed (Berger et al. 2005). Another peculiarity of the radio properties of UCDs is that for some of them a highly circularly polarized pulsed emission component is overlaid on their quiescent, nonvariable gyro-synchrotron emission (Burgasser & Putman 2005; Hallinan et al. 2006, 2008).
Despite two decades of observational efforts samples of UCDs with data in all relevant wavebands are still sparse. Stelzer et al. (2012) have provided evidence for a distinction of two groups in the heterogeneous observational picture of UCD activity: A group of objects with X-ray flares and persistent X-ray emission but no detected radio emission resembles ‘typical’ active stars, and a second group of objects with radio bursts, mostly also with detected quiescent radio emission, but no or very weak X-ray emission that dramatically deviates from this ‘canonical’ behavior. Williams et al. (2014) argue that the origin of the observed division be the magnetic field strength and morphology rather than rotation. The puzzling multiwavelength picture that has emerged for this object class has recently been reviewed by Pineda et al. (2017).
Many observations of magnetic activity on UCDs have occurred serendipitously, and the most interesting objects were subsequently observed at other wavebands to search for connections between the different magnetically induced emissions. As a result, the sample of UCDs with sensitive multiwavelength data may not be representative of the UCDs as a class. With the recent launch of the extended ROentgen Survey with an Imaging Telescope Array (eROSITA) onboard the Spektrum-Röntgen-Gamma mission (Predehl et al. 2021) we have entered a new era for the study of X-ray activity on UCDs: While the higher sensitivity of observatories like XMM-Newton and Chandra is required to detect the quiescent X-ray emission of all but the most nearby UCDs, the enormous statistical samples to be observed with eROSITA (many thousand objects) can be expected to boost the number of detections among UCDs and provide an unprecedented wealth of information on their flaring activity. In this article we carry out the first exploration for UCD X-ray emission based on the first eROSITA All-Sky Survey (eRASS1) which was completed in summer 2020.
We introduce our input sample of UCDs and UCD candidates in Sect. 2. Then we proceed to the source identification where we match the eRASS1 catalog with our input samples and subsequently inspect for all matches the plausibility that the UCD rather than another known Gaia source is the X-ray emitter (Sect. 3). In Sect. 4, the multiwavelength properties of those UCDs to which we have assigned an X-ray source are presented, and in Sect. 5 we describe the analysis of X-ray light curves and spectra for the two UCDs with the largest number of counts in eRASS1. Section 6 comprises our results and a discussion thereof. Finally, in Sect. 7 we summarize the findings and draw the conclusions. Appendices are presented for different subsamples of objects that are in the vicinity of the UCDs and that we assign as the more likely counterpart of the X-ray source (Appendices A, and C), and Appendix B holds a short discussion on the distinction of stellar and extragalactic objects in multiwavelength diagrams based on eROSITA data from an observation obtained during the CalPV phase.
2 Sample
We have compiled a list of UCDs to be matched against the eRASS1 source catalog. Our input list comprises both spectro-scopically confirmed UCDs and new candidate UCDs identified with Gaia. The known UCDs are drawn from the “list of M6-M9 dwarfs” maintained by J. Gagné1 henceforth referred to as Gag-néM, and the GUCDS catalog from Smart et al. (2019) which comprises mostly L and T dwarfs. The new Gaia discovered UCD candidates are from Reylé (2018). For the sake of homogeneity we limit the sample of known UCDs to the objects with full photometry and astrometry in Gaia DR2, using the selection criteria of Reylé (2018) from her definition of the new candidate UCD sample.
To perform this selection on the GagnéM catalog, we first matched it separately against catalogs available from the advanced ADQL (Astronomical Data Query Language) interface of the Gaia archive2 in the following way. We used the 2MASS designation given in GagnéM for the match with the Gaia-DR1 2MASS original valid catalog. This step provides the parameter TMASS_OID which is the 2MASS identifier in the Gaia catalogs. To map the 2MASS identifier to the Gaia source number (col. SOURCE_ID) we matched this output with the Gaia DR2 2 MASS best neighbor catalog. Subsequently, we extracted all relevant Gaia DR2 information by matching the output of the last step using col. SOURCE_ID with the full Gaia DR2 catalog. As of June 2020 the GagnéM catalog contains 8683 late-M dwarfs of which with the above procedure 8301 are matched with Gaia DR2.
For consistency with the Reylé (2018) catalog we required that the objects from GagnéM that we keep in the list have full photometry (fluxG, fluxBP, fluxRP > 0) and astrometry (pmRA, pmDEC, parallax measured), and that the uncertainty of the parallax ![${\sigma _\varpi } < 10\%$]](/articles/aa/full_html/2022/05/aa41232-21/aa41232-21-eq1.png) . This reduces the GagnéM sample to 4326 objects, mainly due to the criterion on the error of the parallax.
. This reduces the GagnéM sample to 4326 objects, mainly due to the criterion on the error of the parallax.
The inspection of the multiband photometry in GagnéM showed that further cleaning of this catalog was necessary: a number of objects present SDSS magnitudes much too high for the J band magnitude. These mismatches in GagnéM could be removed with the exclusion criteria zSDSS > 18.0 && J < 15.5 and zSDSS > 18.5 && J < 16.5. Another 130 objects were disregarded this way. An additional 2 objects were removed because they are outliers in the MG vs G − GBP diagram and with difference between the position in the 2MASS catalog and the position in GagnéM larger than 10” although their proper motion is relatively small. We have also visually inspected these objects in ESASky3 confirming the wrong match. The final number of objects we consider from GagnéM is, therefore, 4194.
The GUCDS catalog was extracted by Smart et al. (2019) primarily from an earlier list of 1885 UCDs compiled by the same authors (Smart et al. 2017) that is based on the “list of ultracool dwarfs” by J. Gagné4, a catalog that complements GagnéM for cooler spectral types. Smart et al. (2019) also added late-M, L and T dwarfs from some other catalogs and defined the GUCDS sample as those objects from their list that have a match in Gaia-DR2 with accurate Gaia coordinates and astrometry. This list comprises 695 objects with spectral types M8 to T6. Applying the criteria on Gaia DR2 photometry and astrometry from Reylé (2018) as described above for GagnéM reduces this catalog to 610 objects. By way of construction of this catalog there is some overlap with GagnéM. We, therefore, removed all objects that are in both catalogs from GUCDS matching the two lists for their Gaia-DR2 source names. This way our final list from Smart et al. (2019) has 560 entries.
To summarize, our input catalogs of UCDs to be matched with the eROSITA source list consist of 4194 objects extracted from the original GagnéM catalog, 560 from Smart et al. (2019) and the full list of 14914 Gaia-UCD candidates from Reylé (2018). These lists are henceforth referred to as our ‘cleaned’ samples. Figure 1 shows the MG vs G − GBP diagram for this cleaned lists of UCDs. The GagnéM and Reylé (2018) catalogs define a similar area in the Gaia color-magnitude diagram because the latter one was constructed on the basis of the Gaia properties of the former one (see Reylé 2018). However, GagnéM starts at SpT M5 while Reylé (2018) includes only objects with photometric spectral types (SpTs) of M7 or later. This explains the extension of GagnéM at the upper left end of the distribution in Fig. 1. We also note that the GagnéM catalog comprises a number of late-M dwarfs that are members or candidate members of young moving groups. These stand out above the main-sequence in color-magnitude diagrams. While the focus of this work is to find X-ray emitting field dwarfs, we keep these young objects in the catalog as no systematic search for their X-ray emission has been performed yet.
The class of UCDs is defined through the spectral type. As described in the previous paragraphs our samples cover different SpT ranges, and the GagnéM sample comprises also objects that have slightly earlier SpTs than the canonical boundary for UCDs, M7. Moreover, for the new UCD candidates from Reylé (2018) only photometric SpTs are available. Since these have been derived on the basis of Gaia properties of the known confirmed UCDs, a good agreement between spectroscopic and photometric SpTs is expected. We have checked this by computing the photometric SpTs for the cleaned GagnéM and GUCDS samples using the polynomial relation with MG given by Reylé (2018). The comparison of the resulting values with the optical spectroscopic values for the SpT are shown in Fig. 2. While the overall agreement is good the scatter in the relation together with the inclusion of objects with SpT M5 and M6 in GagnéM implies that not all objects in our lists are genuine UCDs. Given that based on Fig. 2 the uncertainties, especially of the photometric SpTs, amount to a few spectral subclasses we prefer to keep all objects in our sample even if their spectroscopic SpTs are earlier than M7.
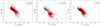 |
Fig. 1 Gaia color-magnitude diagram (MG vs G GRP) for the lists of UCDs defined in Sect. 2. In each panel, all three master tables are shown but one of them is high-lighted in red: left – known late-M dwarfs from J. Gagnés M6…M9 dwarf archive, middle – known MLTY dwarfs with Gaia-DR2 data from the GUCDS sample (Smart et al. 2019), right – new Gaia-discovered UCD candidates (Reylé 2018). |
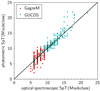 |
Fig. 2 Comparison of spectroscopic and photometric spectral types for the ‘cleaned’ GagnéM and GUCDS samples. The spectroscopic SpTs are obtained from the original catalogs, the Gagné dwarf archive and Smart et al. (2019), while the photometric SpTs have been computed using the polynomial relation with MG from Reylé (2018). Objects with a flag indicating youth or uncertain spectroscopic SpT in the two catalogs have been omitted, as the MG–SpT relation fron Reylé (2018) is valid for the main-sequence. |
3 Identification of UCDs among eRASS1 sources
The Spektrum-Roentgen-Gamma (SRG)/eROSITA data on which we base this work are the results of the first All-Sky Survey, eRASS1. The eRASS1 source catalog is produced at Max Planck Institut für extraterrestrische Physik (MPE) in Garching with the eROSITA software eSASS; see Brunner et al. (2022) for a description of the eSASS software. We use the catalog version 201008 generated with the data processing version c9465, and we henceforth call this catalog eRASS1cat. This catalog comprises all eRASS1 sources in the western half of the sky in terms of Galactic coordinates, that is l ≥ 180°. The eRASS data from the other half of the sky is the property of the Russian eROSITA consortium and is not available to us.
We cross-matched each of the three cleaned input catalogs of UCDs and UCD candidates described in Sect. 2 separately with eRASS1cat. For this task we first corrected the Gaia DR2 positions (J2015.5) to the expected position at the mean eRASS1 observing date (mid-March 2020) using the Gaia DR2 proper motions (PM) from our cleaned input catalogs. Then we matched these PM-corrected coordinates with the eRASS1 boresight-corrected X-ray positions (Cols. RA_CORR, DEC_CORR) in a radius of 30″. Subsequently, we removed all matches for which the separation between the PM corrected positions and the eRASS1 positions (henceforth termed sepox) deviate by >3× the uncertainty in the X-ray position (Col. RADEC_ERR in eRASS1cat). This way we obtained 24 matches in eRASS1cat for our cleaned GagnéM sample with the widest separation being 24″, and 73 matches for the sample from Reylé (2018) where the largest value of sepox is 20″. The latter output catalog comprises one object with joint Russian-German ownership which was removed from the sample to adhere to the consortium policies. No matches with our cleaned GUCDS sample, derived from the catalog of Smart et al. (2019), fulfilled the separation criterion, that is no objects from this sample are associated with an eRASS1 X-ray source.
The corresponding tables of associations between our input catalogs GagnéM and Reylé (2018) are henceforth referred to as fullmatch-eRASS1-GagnéM and fullmatch-eRASS1-Reyle, respectively. We present the most relevant parameters of these catalogs in Table 1. Next to the Gaia SOURCE_ID (Col. 1) we provide the boresight corrected eRASS1 positions (Cols. 2 and 3), the error on the eRASS1 positions (Col. 4), and the separation between the proper motion corrected optical positions and the X-ray positions (sepox in Col. 5). The broad band (0.2–5.0 keV) source count rates and the associated errors are given in Col. 6. In Col. 7 we provide the maximum likelihood for the X-ray detection in the broad band. In Col. 8, we list flags for UCDs that are unique Gaia counterparts to the eRASS1 source (‘U’), objects with archival X-ray detections (‘X’), and common proper motion pairs involving a UCD or UCD candidate (‘C’). In Col. 9, we mark all UCDs that after our analysis are considered ‘bonafide’ or ‘plausible’ counterparts to the eRASS1 sources. For the objects not marked in Col. 9 we discard the UCD as being responsible for the X-ray emission. The flags in the last two columns are based on the detailed examination of alternative possible counterparts as described in the remainder of this section.
Given the relatively large eROSITA positional error in the survey mode, the UCDs associated with a source from eRASS1cat according to the cross-match described above are not necessarily the correct counterparts of the X-ray source. We searched for alternative optical/IR counterparts to the eRASS1 detections identified in the first step with a UCD by reversing the search, that is we matched each of our two fullmatch-eRASS1 samples again with Gaia DR2 centering the search on the X-ray coordinates (RA_CORR, DEC_CORR) and using a match radius of 24″, the maximum value with a reliable UCD-eRASS1 association in the first step. Then we removed all matches with sepox > 3 RADEC_ERR. Since the “reverse match” involved no PM correction, in this step the previously found UCD candidates could be removed if they do not fulfill the separation criterion. This is, in fact, the case for one object from fullmatch-eRASS1-GagnéM, and we added this object again to the list. The resulting list of potential Gaia DR2 counterparts comprises now 50 objects for fullmatch-eRASS1-GagnéM and 233 for fullmatch-eRASS1-Reyle. The task is now to determine for each of the 96 X-ray sources whether the UCD or UCD candidate is the most likely Gaia counterpart.
Basic X-ray parameters from eRASS1cat for the UCDs from GagnéM and UCD candidates from Reylé (2018) that are within 3× the uncertainty of the X-ray position.
3.1 Bonafide eRASS 1 counterparts
We found that 12 X-ray sources in fullmatch-eRASS1-GagnéM and 24 in fullmatch-eRASS1-Reyle have a single Gaia counterpart, namely the UCD or UCD candidate. In the following for simplicity we occasionally omit the distinction between UCD and UCD candidate, but the reader should keep in mind that the objects from GagnéM are spectroscopically confirmed while those from Reylé (2018) are not. In the abovementioned 36 cases the UCD can safely be considered to be the cause for the X-ray emission as there is no other Gaia source within 3× the error of the X-ray position.
To establish the correct counterpart in the remaining cases we took into account several criteria. First, we carried out a visual inspection of all cases with multiple Gaia DR2 counterparts in ESASky. This way we found that among our eRASS1 detections 2 from fullmatch-eRASS1-GagnéM and 12 from fullmatch-eRASS1-Reyle have a common proper motion (CPM) companion; one of them is a triple system. In all but one cases the comoving companion is the more likely X-ray emitter because it is brighter and closer to the eRASS1 position than the UCD6. We, therefore, remove these 13 objects from the sample. The one exception is the UCD Gaia DR2 3181197137010596608 from our GagnéM catalog that shares a similar proper motion with the source Gaia DR2 3181197137010596480. These two objects have similar Gaia magnitudes and are a pair of UCDs. Since this pair is very tight (separation of 1.6″) we cannot infer which of the two is the X-ray source. We provide more information on this and all other CPM pairs involving UCDs in Appendix A.
Another criterion that was useful to assign the X-ray source to the correct Gaia source are the X-ray positions in observations with the higher spatial resolution instruments XMM-Newton and Chandra. Such detections are available for 7 of the 24 objects in fullmatch-eRASS1-GagnéM. In all these cases the archival X-ray source is spatially associated with the UCD according to our visual inspection. This relatively high fraction of objects with archival X-ray data is a result of dedicated studies of UCD X-ray emission in the past. Two of the corresponding eRASS1 sources have multiple potential Gaia counterparts, and we could assign the UCD as the X-ray emitter thanks to the archival X-ray detection. In fullmatch-eRASS1-Reyle only 4 objects are near an archived XMM-Newton or Chandra source. One of these archival X-ray sources is closer to the brighter comoving companion of a UCD candidate, and this object (Gaia DR25762038930728469888) has been disregarded as an X-ray emitter in our previous selection step. In another case both the UCD candidate (Gaia DR2 3777108250009273856) and its CPM companion are detected with Chandra. The eRASS1 source is closer to the CPM companion, and this object has also been removed from the list of UCD candidates in the previous selection step. For the third one, the UCD candidate Gaia DR2 3902395843353397248, both a Chandra and an XMM-Newton source are closer to another object, Gaia DR23902395813288871936, which has similar optical brightness as the UCD candidate. This object is a known quasar (see Appendix C). The last one, Gaia DR2 3754497583659096320, has an XMM-Newton source clearly identified with the UCD candidate and there is no other Gaia object in the vicinity that is nearly as bright and close to the eRASS1 X-ray position as the UCD candidate. The XMM-Newton detection of this UCD was discovered and discussed by Stelzer et al. (2020). To summarize, with help of the archival X-ray data we eliminated one additional UCD candidate from the eRASS1 source list fullmatch-eRASS1-Reyle because the X-ray source is identified as an extragalactic object.
We consider the objects identified above and flagged in Col. 8 of Table 1 ‘bonafide’ counterparts to eRASS1cat X-ray sources. To summarize, we have identified the optical counterpart to 16 eRASS1 sources from fullmatch-eRASS1-GagnéM and 38 from fullmatch-eRASS1-Reyle. Among those 54 ‘bonafide’ eRASS1 counterparts there are 40 UCDs (flagged in Col. 9 of Table 1 with ‘B’), 13 earlier-type CPM companions to UCDs, and 1 quasar. In this way we are more than doubling the number of existing X-ray detections from UCDs. We caution, however, that 25 of them, the ones from fullmatch-eRASS1-Reyle, are UCD candidates that still require spectroscopic confirmation.
On the left side of Fig. 3, we show various parameter combinations for the ‘bonafide’ counterparts to eRASS1cat X-ray sources. In particular, we display a Gaia color-color diagram (CCD) and a diagram involving the ratio of X-ray and optical flux, fx /fG. For this latter diagram the X-ray flux is taken from eRASS1cat column ML_FLUX_2, the eRASS1 energy band ‘2’. It represents the 0.6 − 2.3 keV band and is the energy band in eRASS1cat that comes closest to the 0.5–2.0 keV band typically used for studies of X-ray populations. The optical flux in our X-ray/optical ratio refers to the Gaia G band7. The curved path that forms the lower envelope in the G − GRP versus GBP − G diagram outlines the stellar main-sequence as demonstrated by the black line which represents the Gaia colors from the table “A Modern Mean Dwarf Stellar Color and Effective Temperature Sequence” maintained by E. Mamajek8. All UCDs show values for the X-ray flux above the canonical saturation limit of log(fx /fG) ≈ −3. We discuss this result in Sect. 6. Here, we only note that in Appendix B we argue based on the properties of the more than 20 000 X-ray sources from the eROSITA Final Equatorial-Depth Survey (eFEDS)9 that the part of the Gaia CCD occupied by the UCDs and UCD candidates is not populated by any other abundant population of X-ray emitters, such as extragalactic objects or stars. Specifically, while a small number of eFEDS objects classified ‘galactic’ are located in the same region as the UCDs the distribution of the ‘extragalactic’ sources are clearly separated from them (see Fig. B.1). In Appendix B, we also examine the other diagrams shown in Fig. 3, and specifically the one of W1 magnitude versus the abovementioned Band 2 X-ray flux (bottom panel in Fig. 3). In that diagram the black line denotes the empirical separatrix between ‘extragalactic’ (above) and ‘stellar’ (below) X-ray emitters that was defined by Salvato et al. (2018) from two X-ray samples that bracket the eRASS1 survey in terms of X-ray fluxes: the 2RXS (Boller et al. 2016) and XMMSL2 (XMM-SSC 2018) on the low-sensitivity end and the Chandra COSMOS Legacy Survey (Marchesi et al. 2016) on the high-sensitivity end. Some contamination between the ‘extragalactic’ and ‘stellar’ groups was seen in Salvato et al. (2018), and might be present in our sample as well. In particular, from Fig. 3 it can be seen that in our sample of ‘bonafide’ eRASS1 sources no confirmed UCDs but some of the UCD candidates are located in the ‘nonstellar’ part of this diagram.
3.2 Plausible eRASS 1 counterparts
Putting aside the 54 identified ‘bonafide’ eRASS1 objects, there are still 42 eRASS1cat sources to which we must assign the optical counterpart. Each of these X-ray sources has at least two Gaia objects in the search radius. In the right panels of Fig. 3, the full sample of possible counterparts to the 42 still unassigned X-ray sources from fullmatch-eRASS1-GagnéM and fullmatch-eRASS1-Reyle is shown. Since these eRASS1cat sources have several Gaia counterparts in the search radius they appear more than once in those panels of the figure that involve Gaia data. Some of the non-UCD Gaia sources are missing because they have incomplete photometry, while the UCDs and UCD candidates by definition of our input samples (Sect. 2) are fully characterized with Gaia.
The same features described above for the ‘bonafide’ counterparts are seen, such as the main-sequence path in the CCD and high values of fx/ fG for the UCDs. In addition a strongly populated area in the upper left of both diagrams (defined by relatively blue optical color and high fx/fG ratio) is evident. Only one of the bonafide eRASS1 counterparts is located in that region, the quasar 2XMM J123337.5+073133 (see left side of Fig. 3). That region is, therefore, likely dominated by extragalactic sources. For the position of different astrophysi-cal populations in the eRASS1 and Gaia parameter space we refer, again, to Appendix B. Here we define our criteria for selecting the counterpart to each X-ray source from its pool of Gaia objects.
To this end, we compare the separations between the positions of the Gaia DR2 and the eRASS1 sources, sepox, and the G magnitudes of all possible Gaia counterparts uncovered in our ‘reversed search’ for these 42 eRASS1 sources. The Gaia source with the smallest sepox value for each eRASS1 source is highlighted in the viewgraphs on the right side of Fig. 3 with an annu-lus. For six out of the eight still unassigned X-ray sources from fullmatch-eRASS1-GagnéM, the UCD is the closest counterpart to the X-ray position, and for the fullmatch-eRASS1-Reyle sample in 19 of 34 cases the UCD candidate has the smallest sepox value of all Gaia counterparts. The remaining 17 have a non-UCD as their closest counterpart.
As a baseline we define as the correct Gaia counterpart for the eRASS1 X-ray source the one with the smallest sepox value. 25 UCDs and UCD candidates fulfill this criterion. However, in this work we pursue a conservative approach in which we keep UCDs as counterparts to X-ray sources only if there is no other obviously more plausible optical counterpart. Therefore, we examined all other potential Gaia counterparts for these 25 cases. This way we identified 7 cases where an object with a brighter G magnitude is in the 3 × RADEC_ERR match radius. Their optical/IR properties are presented in Appendix C. Following the conservative approach described above, we consider these brighter Gaia sources as likely counterpart to the X-ray emitter, and we remove the corresponding UCDs from the X-ray sample. The other 18 UCDs (that are both the closest and the brightest Gaia counterpart to the X-ray source) are added to the sample investigated in this article. We henceforth term these UCD X-ray assignments as ‘plausible’, because due to the presence of other Gaia sources in the match radius they are somewhat less certain associations than the ‘bonafide’ objects from Sect. 3.1. These UCDs are marked with ‘P’ in Col. 9 of Table 1.
The 17 non-UCD counterparts with the smallest sepox among all Gaia counterparts are not of interest to our study. However, for completeness and future reference we provide opti-cal/IR parameters of these other astrophysical X-ray emitters in Appendix C. From a comparison of Fig. 3 and Fig. B.1 we can infer that those of them that are located in the upper left in the G − GRP vs GBP − G diagram are likely extragalactic, while for those that are located close to the stellar main-sequence the nature cannot be established based on the Gaia color-color diagram. Note that for Table C.1 when G and J magnitudes are available we have computed the corresponding main-sequence spectral type, but this parameter may be meaningless if the object is extragalactic.
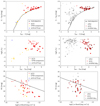 |
Fig. 3 Gaia color-color diagram (top), X-ray to G band flux ratio (middle) and W1 magnitude vs X-ray flux (bottom) for subsamples illustrating the process for the selection of the Gaia counterpart to the eRASS1cat source. The left panels show the eRASS1cat sources to which a ‘bonafide’ counterpart has been assigned and the right panels show the possible counterparts for the remaining sources from eRASS1cat. Small circles represent UCD candidates from Reylé (2018) and large circles spectroscopically confirmed UCDs from GagnéM. UCDs from the input master lists are shown in red, their CPM companions in yellow, and counterparts assigned based on archival X-ray detections in blue. All other Gaia sources within the search box around the eRASS1cat X-ray positions are marked in gray. In the right panel the brightest Gaia source and the one closest to the X-ray position is indicated for each eRASS1cat source. The black line in the bottom panels is an empirical separator between extragalactic candidates (above) and stellar candidate (below) introduced by Salvato et al. (2018). |
Multi-wavelength properties of the UCDs and UCD candidates identified as bonafide or plausible counterparts to an eRASS1 X-ray source.
3.3 Reliability of the X-ray sources
The detection threshold for the source detection applied to generate eRASS1cat was DET_LIKE_0 = 6. At this threshold about ~6.9% of sources are expected to be spurious (Brunner et al. 2022). Among the 58 eRASS1 detected UCDs 4 have DET_LIKE_0 ≤ 6.5, that is statistically none of them is expected to be a spurious detection.
4 Multiwavelength properties of eRASSI-detected UCDs
As we anticipated in Sect. 3 all UCDs that we have identified as X-ray emitters are marked in the last column of Table 1. To summarize, we have associated 21 spectroscopically confirmed UCDs from GagnéM to an X-ray source from eRASS1cat, of which 15 as bonafide and 6 as plausible counterparts. Among the UCD candidates from Reylé (2018) 37 have been assigned as eRASS1 X-ray emitter, 25 as bonafide and 12 as plausible counterparts.
While the multiwavelength properties of the non-UCD X-ray emitters are presented in the appendices of this work as described above, here we summarize relevant parameters forthe X-ray emitting UCDs and UCD candidates. Table 2 lists the photometry used in this article, that is the Gaia G band, 2MASS J band and AllWISE W1 band (Cols. 2–4). For the objects from GagnéM we provide the SpT from optical spectroscopy (Col. 5). In order to have a common SpT scale for the GagnéM and the Reylé (2018) sample we have computed spectral types from the G − J color using the table maintained by E. Mamajek8 for all bonafide and plausible UCDs and UCD candidates (Col. 6). This scale has the advantage that it is valid for the full SpT sequence, while the SpT-MG relation used in Reylé (2018) has been calibrated only for SpT M7 and later. In fact, we find that the few M5 objects in GagnéM would all have an early- to mid-M SpT assigned when using the SpT-MG calibration from Reylé (2018), at odds with their spectroscopic values.
Since the distance is crucial for the determination of luminosities we have checked the reliability of the values obtained from inverting the parallaxes. To this end we have matched all bonafide and plausible X-ray emitting UCDs with the catalog of Bailer-Jones et al. (2018) in which a probabilistic approach was used to infer distances from Gaia parallaxes and its standard deviation and a model for Gaia’s length scale in the Galaxy. The values  , where
  is the Gaia DR2 parallax, are for all targets in excellent agreement with the distances obtained by Bailer-Jones et al. (2018). This is not unexpected since our sample by construction comprises only objects with well-constrained parallax (see Sect. 2). We conclude that all bonafide and plausible eRASS1 detections among the UCDs and UCD candidates have a reliable distance value. In Col. 7 of Table 2 we provide the Gaia distance extracted from the catalog of Bailer-Jones et al. (2018).
Columns 8 and 9 of Table 2 hold the X-ray luminosity (Lx) and the fractional X-ray luminosity (Lx/Lbol) in logarithmic scale. The bolometric luminosity required for the Lx/Lbol ratio has been calculated with the polynomial fit with SpT from Filippazzo et al. (2015), and the spectral types used were those derived from the G − J color. The X-ray flux that together with the distance defines Lx was derived from the 0.2–2.3 keV count rates in eRASS1cat by summing the values in cols. ML_RATE_1 and ML_RATE_2 and applying the rate-to-flux conversion factor CFM‚12 = (7.37 ± 0.55) × 10−13 erg cts−1 cm−2. This value was derived from fits of a thermal model (APEC) to eFEDS spectra of early-M dwarfs studied by Magaudda et al. (2022). Note that in Magaudda et al. (2022) a slightly higher value is reported which refers to a broader eROSITA energy band (0.2–5.0keV), but the same approach and the same sample of M dwarf eROSITA spectra was used to derive the value for the 0.2–2.3 keV band (that is the sum of eRASS1 energy bands ‘1’ and ‘2’) cited above specifically for our work.
We recall that in the multiwavelength diagrams that supported the source identification (Fig. 3) we have made use of the X-ray fluxes tabulated in eRASS1cat. These fluxes have been calculated for an absorbed power-law (with NH = 1020 cm−2 and Γ = 1.7) which is an incorrect assumption for coronal X-ray emitters. The use of these fluxes for our source identification procedure is justified by the fact that many of the potential Gaia counterparts to the X-ray sources are nonstellar. To get an idea on the effect of the inappropriate use of eRASS1cat fluxes on our sample of UCDs we have computed the CF for the power-law model given above as the mean of the ratio between the 0.2–2.3 keV count rates and the fluxes in the same band given in eRASS1cat. We find for our sample of 58 UCDs and UCD candidates a mean and standard deviation of CFPL = (9.75 ± 0.21) × 10−13 erg cts−1 cm−2, that is a 30% higher CF than the value obtained from the M dwarf spectra.
5 eRASS1 light curves and spectra
As a result of a combination of the weak activity levels of UCDs and the limited sensitivity of eRASS1 most X-ray detections of UCDs have a small number of counts. Although, as we argued in Sect. 3.3, statistically no spurious detections are expected in our UCD X-ray emitter sample, 25% of them have a detection likelihood DET_LIKE_0 ≤ 8. For these weak sources on average only 7 source counts were collected during eRASS1.
Two sources stick out with a count rate (>1 ctss−1) much above the average. These are also the only two UCDs for which more than 100 counts have been collected during eRASS1, and thus a meaningful spectral and timing analysis is feasible. We study the eRASS1 spectra and light curves of these two UCDs for which 227 counts and 292 counts are listed for the 0.2–5.0keV band in eRASS1cat, respectively. These values are clear outliers from the trend of low count numbers in our sample and lead one to suspect flaring activity. One of the two is the binary UCD Gaia DR2 3181197137010596608 and Gaia DR2 3181197137010596480 (Sect. 3.1), also known as WDSJ04469-1117A and B and listed with SpT M5 + M6 in GagnéM (based on measurements presented by Shkolnik et al. 2009). The other one is Gaia DR25355751581627180288, alias TWA 22 AB, which is – contrary to its historical assignment to the TW Hya association – a member of the β Pic moving group (Malo et al. 2013) and an astrometric binary (Bonnefoy et al. 2009) with two components of SpT M6. Both objects for which we are performing eRASS1 timing and spectral analysis are, thus, not genuine UCDs. Nevertheless, since the X-ray properties for mid- to late-M stars are not well known, their X-ray variability and plasma temperature are of high interest.
Our analysis of the light curves and spectra of WDS J04469-1117AB and TWA22AB is based on the merged events files of all seven telescopes for the corresponding sky tiles that comprise our targets. We extracted the 0.2–5.0keV band light curves and spectra, and all required complementary files with the SRCTOOL task of the eROSITA Science Analysis System (eSASS), version eSASSuser_201009. To this end, we have defined a 40″-radius circular region centered on the boresight corrected position of the X-ray source associated with the UCD. For the background region we chose an annular region with the same center and an inner and outer radius of 90″ and 180″, respectively.
We used the SRCTOOL command with the REGULAR- option which produces a light curve with regularly spaced bins in which time intervals without data are automatically discarded. As a result of the sparse sampling in the survey mode the light curves are dominated by such data gaps. During its All-Sky Survey eROSITA visits a given sky position several times with a typical time lapse between one and the next visit of ~4 h (corresponding to one full rotation of the spacecraft and called the ‘scan rate’). Each such visit is called an eRODay. The average number of eRODays for a source is six, and it is determined by the combination of the scan rate, the orbital speed of eROSITA (~ 1° d−1) and the field-of-view of the instrument (diameter 1°). However, the number of eRODays and the total on-source exposure time depend also on the sky position, with more visits taking place for objects near the ecliptic poles where the great circles traced by the telescope intersect each other for longer than the abovemen-tioned average. Moreover, the exposure time per eRODay varies between one scan and the next one since in subsequent scans the source crosses the circular field-of-view at different positions.
The REGULAR- option of SRCTOOL produces a light curve with bins of user-defined length irrespective of the temporal sequence of the data-taking which is different for each source. Since the time interval from the first to the last eRODay is dominated by data gaps, an arbitrary choice of bin size is likely to lead to a light curve which comprises bins with extremely low exposure time, such as when a bin just scratches the beginning or end of an eRODay. For faint sources this results in bins with very large uncertainties on the count rate. To take account of these peculiarities related to the survey mode, we have used a trial-and-error approach to adjust the bin size and the start time of the binning such as to obtain one single bin per visit of the source.
The eRASS1 spectra of WDS J04469-1117AB and TWA 22AB, the spectra of their associated background regions, and the response matrix and ancillary response files were extracted with SRCTOOL. The spectra were then binned to a minimum of 10 counts per bin, and subsequently fitted in the XSPEC environment v 12.11.1 (Arnaud 1996).
Details of the spectral fitting and the results from the spectral and temporal analysis for these two objects are presented in Sect. 6.2.
6 Results on UCDs detected in eRASS1
6.1 Overall properties of the population
Figure 4 shows the X-ray emitting bonafide and plausible UCDs and UCD candidates together with the full cleaned input samples GagnéM and Reylé (2018) in the Gaia color-magnitude diagram. Throughout the remainder of this paper, the spectroscopically confirmed X-ray emitting UCDs (from GagnéM) are shown in red and the X-ray emitting UCD candidates (from Reylé 2018) in blue.
A number of the spectroscopically confirmed UCDs detected in eRASS1 belong to the group of objects above the main-sequence (flagged ‘Young’ in Table 2). These are late-M stars in young nearby moving groups. The strong X-ray emission associated with the youth (~ 10… 100 Myr) of stars has played a major role in the discovery of such co-moving stellar associations based on ROSAT data (e.g., Kastner et al. 1997, 2003). It is, therefore, not surprising that an disproportionate fraction of these young objects is detected in eRASS1. In fact, the young objects are among the strongest X-ray emitters in the sample of eRASS1 UCD detections (as we show at the end of this Section). There are only two young objects in the Reylé (2018) sample of X-ray emitting UCD candidates because that sample was selected from Gaia data on the basis of the field dwarfs from J. Gagné’s dwarf archive.
In the leftmost panel of Fig. 5, we show the SpT distribution for the combined sample of bonafide and plausible UCDs detected in eRASS1. Recall that while the GagnéM catalog comprises spectroscopic spectral types, the new UCD candidates from Reylé (2018) have only photometric estimates for the SpT. In Sect. 2, we have demonstrated that there is overall good agreement between spectroscopic and photometric SpTs derived from the absolute Gaia magnitude, MG, but in Sect. 4 we have argued in favor of a calibration with G − J color which covers the full range of SpTs present in our sample. In any case, we caution that in absence of a spectroscopic confirmation the values provided in Reylé (2018) must be considered tentative. Keeping this in mind, we see in Fig. 5 that the distributions of the number of X-ray detections for both the known UCDs and the UCD candidates are peaked at SpT M6…M7. Note that one UCD, Gaia DR2 4963614887043956096, has an L4-type companion (Artigau et al. 2015). However, since the higher-mass component is the more likely X-ray emitter we have assigned a SpT of M6 (the value for the primary) to this object. The latest SpT with an eRASS1 detection is M9. This is Gaia DR2 5761985432616501376 (2MASS J08533434-0329432) with spectroscopic SpT M9 (in the optical) and M8.5 (in the NIR) according to GagnéM. No UCDs from the GUCDS sample are detected in eRASS1. Therefore, no X-ray detection from any confirmed L dwarf can be reported from our work.
The distance distribution of the eRASS1-detected UCDs is displayed in the middle panel of Fig. 5. It shows a peak at ~30 pc and comprises values from 3.5 to 190pc. This sample is clearly drawn among the more nearby objects from the input catalogs, GagnéM and Reylé (2018), which is not surprising given the fact that eRASS is a flux-limited survey. The UCD with the largest distance among the eRASS1 detections is CHSM 17173, a member of the Cha I cloud and likely the youngest in this sample.
The most important parameters to be delivered from this study are the X-ray luminosities and the Lx/Lbol values. In Sect. 4, we have explained how we have computed the Lx values from the tabulated count rates in eRASS1cat and a rate-to-flux conversion factor derived from eROSITA observations of early M dwarfs. The distribution of the X-ray luminosities computed with this CF and the distances from Bailer-Jones et al. (2018) are visualized in the right panel of Fig. 5. The Lx values are remarkably high, similar to those of mid-M dwarfs. This is seen in the top panel of Fig. 6 where we show the new eRASS1 X-ray detected UCDs and UCD candidates together with a compilation of X-ray emission from mid-M stars to L-type UCDs from the literature. The literature data for UCDs (black symbols with SpT M6 and later in Fig. 6) are from Stelzer et al. (2012), Cook et al. (2014), Williams et al. (2014) and De Luca et al. (2020). The earlier-type stars shown as black triangles are from Magaudda et al. (2020, 2022). While these mid-M dwarfs show X-ray to bolometric luminosity ratios at or below the canonical saturation limit of log (Lx/Lbol) ≈ −3, for most of the UCDs the X-ray to bolometric luminosity ratio is much higher, and about half of them have log(Lx/Lbol) values above the upper envelope observed in mid-M dwarfs. As the literature data on UCDs shows, values as high as log (Lx/Lbol) ≈ −1 have occasionally been observed before on UCDs but only during flares (asterisks in Fig. 6).
Since we have seen that the distances are reliable and the probability even for the faintest objects to be spurious is small, the only remaining possible error source in the calculation of the X-ray luminosity is the CF. However, we have shown that even a clearly wrong spectral model leads to a difference in the CF on the 30% level only. We may caution that many of the UCDs detected in eRASS1 might have been in a high-activity flaring state during the eROSITA measurement, and therefore the plasma temperatures could be higher than those of the M dwarfs studied in Magaudda et al. (2022). In fact, the two UCDs with the highest number of collected counts for which we analyzed the eRASS1 light curves both show evidence for flares (see Sect. 6.2). From their X-ray spectra we derive a mean CFUCD‚f = 9.27 × 10⁻¹³ erg cts−1 cm−2. This is about 25% higher than the value we used and would, therefore, lead to even higher Lx values. On the other hand, there is virtually no observational basis for our assumption that the X-ray temperatures of UCDs are similar to those of early-M dwarfs. It is, actually, not implausible to speculate that the coronae of UCDs are somewhat cooler than those of objects with earlier M spectral type given the typical correlation between X-ray luminosity and temperature observed in GKM stars (Johnstone & Güdel 2015). The consequence would be a lower CF. However, considering that all these uncertainties are on the percent level, the CF cannot be responsible for the very high log (Lx/Lbol) level of the eRASS1 UCD detections. The final possibility for the apparent high log (Lx/Lbol) values we observe is a wrong identification of the UCDs and UCD candidates as an X-ray emitter. However, we recall that more than half of the UCDs that we assigned to an X-ray source have no other known Gaia object within 3× the uncertainty of the X-ray position; the 36 objects with flag ‘U’ in Table 1.
To summarize, there is no obvious reason to question the observed values of Lx and log(Lx/Lbol) of these X-ray detections. Therefore, the most viable conclusion is that many of these objects showed significant flaring activity during the eRASS1 observation. To test this hypothesis we have extracted the light curves of the two UCD candidates with the most extreme log (Lx/Lbol) values in Fig. 6 following the scheme explained in Sect. 5. These objects are weak detections that have ~10 times less counts than the two UCDs mentioned in Sect. 5 that we discuss in detail in Sect. 6.2. Their eRASS1 light curves clearly show that outside a short time interval the count rate is consistent with zero, therefore fully confirming the suspicion that the high activity levels in our sample results from flares. A detailed study of X-ray variability in the full sample will be performed in another publication. Here, as an illustration for the morphology of eRASS light curves, the eROSITA spectral response and, thus, the potential of eROSITA for UCD science we discuss only the two objects with the largest number of counts in our sample. This analysis is presented in the next subsection.
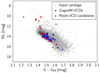 |
Fig. 4 Gaia color-magnitude diagram (MG vs G GRP) for the two input lists of UCDs (GagnéM) and UCD candidates (Reylé 2018) described in Sect. 2. The subsamples that our source identification from Sect. 3 ascribes as bonafide or plausible counterpart to an eRASS1 X-ray source are highlighted with larger circles and colors, red for the known UCDs and blue for the UCD candidates. |
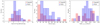 |
Fig. 5 Distribution of spectral types, distances and X-ray luminosities for the ‘bonafide’ and ‘plausible’ X-ray emitting UCDs and UCD candidates detected in eRASS1. SpTs from the GagnéM sample of known UCDs are from optical spectroscopy, while those from the Gaia UCD candidates from Reylé (2018) are photometric estimates based on G J color. |
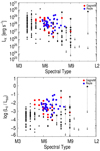 |
Fig. 6 X-ray luminosity and its ratio with bolometric luminosity for UCDs and UCD candidates detected in eRASS1 compared to literature samples described in the text of Sect. 6.1. |
6.2 Information from X-ray light curves and spectra
As explained in Sect. 5 we have extracted the eRASS1 light curves and spectra of the two UCDs with the largest number of counts. The eRASS1 light curves of these two objects, WDS J04469-1117AB and TWA 22, are displayed in Fig. 7. Each bin seen in the figure represents one visit of the target by eROSITA, an eRODay.
Both objects show clear evidence of flaring. The time lapse between two consecutive eRODays is 14.4 ks, corresponding to the 4 h interval required for one satellite rotation. Flares with a duration on the order of 1 h – as seen before on UCDs (e.g., Stelzer et al. 2006b) – thus show up as a single upwards outlying bin. This is the case for WDS J04469-1117AB. For TWA22AB an event with a decay of at least three and maybe five to six eRODays is seen, that is this flare lasted up to half a day. As mentioned above a more detailed analysis of UCD X-ray variability is deferred to a later work.
The X-ray spectra are fitted with a thermal APEC model. The two targets are very close (distance ≲20 pc each), and for such small distances the galactic absorption does not play a relevant role. With a one-temperature model these spectra are poorly fitted (high χ2 values and significant residuals). We, therefore, adopted two APEC components. We performed fits with different fixed values for the global abundance ranging between Z = 0.3 Z⊙ and Z = 1.0 Z⊙, and we noticed the expected degeneracy between abundance and emission measure, that is the fits with higher abundance yielded a lower emission measure. Within the uncertainties, however, all emission measures found for the abovemen-tioned range of Z are compatible with each other. We, therefore, adopted the fit with Z = 0.3 Z⊙, a typical value used for modelling stellar corona observed with poor photon statistics, and we provide the results from the spectral analysis in Table 3. The EM-weighted mean temperatures are 〈kT〉 = 0.73 ± 0.11 keV for WDSJ04469-1117AB and 〈kT〉 = 0.76 ± 0.10 for TWA22AB. These mean temperatures are higher than the values derived for early-M dwarfs from eROSITA spectra (Magaudda et al. 2022). While this might be surprising at first sight, this is likely to be attributed to a combination of the young age, which is ~ 10 Myr for TWA 22AB (Teixeira et al. 2009) and 60 – 300 Myr for WDS J04469-1117AB (Shkolnik et al. 2009), combined with their evident flaring activity.
For the faint sources the only way to study spectral characteristics is the hardness ratio (HR), traditionally defined as (Xj − Xi)/(Xj + Xi)where Xj and Xi are the count rates in a high (j) and a low (i) energy band, respectively. For convenience we assign letters S (soft), M (medium) and H (hard) to the standard energy bands of eRASS1cat, Band1 (0.2–0.6keV; S), Band 2 (0.6–2.3keV, M) and Band3 (2.3–5.0keV, H). We have examined the HR involving H and M but 50% of the eRASS1 detected UCDs and UCD candidates have no counts in the hard band making this HR of limited use. Fig. 9 displays the HR defined with M and S versus the summed X-ray flux of Band 1 and Band 2 (0.2–2.3 keV). Side-by-side with the scale of the HR we provide an estimate of the plasma temperature. The conversion between kT and HR was calculated by Foster et al. (2022) from simulated 1T-APEC models. According to their analysis, the hardness ratio (M − S)(M + S) saturates that is it loses its sensitivity to temperature, at HR ≈ 0.75 and kT ≈ 0.5 keV. This is due to the fact that the bulk of a typical coronal spectrum is comprised in the energy range defined by M while the S -band holds only the softest emission. A boundary between different energy bands at ~ 1 keV would be more appropriate to characterize stellar X-ray sources, but this information is not present in the current version of eRASS1cat. Figure 9 shows, however, that the majority of UCDs are captured well by (M − S)/(M + S), that is they are not saturated.
A caveat to this HR−kT conversion is that eROSITA spectra of UCDs can probably not be well described by a 1 –T plasma. This is seen from the spectral analysis we performed for the two UCDs with the largest number of counts, WDS J04469-1117 AB and TWA22 AB. Both have HR ~ 0. 46, that is according to Fig. 9 we would infer kT < 0.35 keV. This is, however, much lower than the mean temperature we have computed above from the spectral fits. We conclude that HR1 is a useful parameter to evaluate the relative spectral hardness in a sample of eROSITA spectra but quantitative inferences on the plasma temperature must be taken with caution.
Results from spectral fitting of the two brightest eRASS1-detected UCDs.
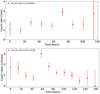 |
Fig. 7 eRASS1 light curves of the two UCDs with more than 100 counts in the eRASS1cat broad band: top – the UCD binary WDS J04469-1117AB (bin size is 80 s), bottom – TWA 22 (bin size is 50 s). |
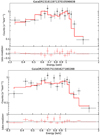 |
Fig. 8 eRASS1 spectra of the two UCDs with more than 100 counts in the eRASS1cat broad band: top – the UCD binary WDS J04469-1117AB, bottom – TWA22AB. Both are shown together with their best-fitting 2-T APEC model and the residuals of the fit. |
Archival X-ray fluxes of UCDs and UCD candidates extracted from the 4XMM-DR9 and CSC 2.0 catalogs.
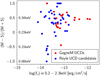 |
Fig. 9 eRASS hardness ratios versus flux for UCDs and UCD candidates. The flux refers to the 0.2 2.3 keV band (the sum of eRASS1 Band 1 and Band 2) and the hardness ratio is based on the count rates in the 0.6 2.3 keV band (eRASS1 Band 2, M) and the 0.2 0.6 keV band (eRASS1 Band 1, S); see text in Sect. 6.2 for more details. |
6.3 Comparison with previous X-ray detections
As described in Sect. 3.1 a total of 9 UCDs and candidates from fullmatch-eRASS1-GagnéM and fullmatch-eRASS1-Reyle had previous XMM-Newton and/or Chandra detections. For one of them the bulk of the eRASS1 emission was attributed to its nearby CPM companion which is a separate Chandra detection, and this object is not considered in the comparison between eRASS1 and archival X-ray fluxes that we present in this section.
For the other 8 objects we extracted the X-ray fluxes measured in the earlier observations from the 4XMM-DR9 (Webb et al. 2020) and CSC 2.0 (Evans et al. 2010) catalogs and list them in Table 4 together with the eRASS1 fluxes obtained as explained below. The majority of these archival X-ray detections have not been discussed in previous publications dedicated to UCDs, and a detailed investigation of eventual literature results would not provide much additional information in our context.
To enable a comparison with the eRASS1 detections of the same objects we selected the energy band ‘9’ (0.5−4.5 keV) from 4XMM-DR9. The CSC 2.0 catalog presents only the broad band flux in the 0.5–7.0 keV band. However, since UCDs are soft X-ray emitters, the extension to higher energies should not provide much additional flux. This choice of XMM-Newton and Chandra energy bands allow for the closest match to the energy bands present in eRASS1cat, for which we can provide the flux in the 0.6 – 5.0keV band summing Band 2 and Band3. As a side remark we recall from Sect. 6.2 that for many of the eRASS1 sources associated with UCDs there are no counts in Band3. While there is some contribution from Band 1 (0.2–0.6 keV) the hardness ratio discussed in Sect. 6.2 shows that for most of them the largest number of counts are collected in Band 2. This is a combination of the energy dependence of the effective area of eROSITA and the peak of the X-ray spectrum of UCDs.
It is important to note that the fluxes in 4XMM-DR9 and CSC 2.0 refer to a power-law model. In Sect. 4 we have shown for a different energy band that there is a 30% difference between the fluxes obtained from a power-law vs a thermal model. Therefore, to examine the variability of the sources we refer to the power-law fluxes provided in eRASS1cat, even if this is not the appropriate model for our targets.
In Fig. 10, we compare the archival X-ray fluxes to the new measurements obtained during eRASS1, for which we adopt the summed fluxes ML_FLUX_2 + ML_FLUX_3 listed in eRASS1cat and their uncertainties. For 5 out of 8 UCDs the X-ray fluxes measured with eRASS1 are consistent with the earlier data. For the remaining three, two from fullmatch-eRASS1-GagnéM and one from fullmatch-eRASS1-Reyle, the eRASS1 flux is significantly higher than the XMM-Newton and Chandra flux. We caution that one of them has a low eRASS1 broad band detection likelihood of DET_LIKE_0≲ 10. In Sect. 3.3 we have, however, explained that likely none of the UCDs and UCD candidates that we have identified as eRASS1 X-ray emitters are spurious detections. Therefore, the most probable explanation for the enhanced eRASS1 flux is a flare. In any case, if these objects had been as faint as during the archival X-ray observation they would not have been detected during eRASS1.
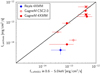 |
Fig. 10 X-ray flux from the 4XMM-DR9 and CSC 2.0 catalogs compared to the eRASS1cat flux for the 7 eRASS1 detected UCDs and the one UCD candidate with an archival XMM-Newton and/or Chandra detection (one object has both an XMM-Newton and a Chandra detection and is marked with a cross-symbol); the values for the archival X-ray fluxes are listed in Table 4. The black line corresponds to equal flux with the two compared instruments. To enable the comparison with the archival fluxes, the eROSITA fluxes were calculated with a power-law model. |
7 Summary and conclusions
We have presented the first X-ray observations for ultracool dwarfs from the eROSITA all-sky survey. This sample comprises 21 spectroscopically confirmed UCDs from the online catalog of M dwarfs maintained by J. Gagné and 37 UCD candidates identified with Gaia data by Reylé (2018). Through a careful examination of alternative optical counterparts to the eRASS1 X-ray sources and an estimate of the expected number of spurious detections for weak X-ray emission we have selected this sample from an initial input catalog of 96 UCDs and UCD candidates that are located in the vicinity of an eRASS1 X-ray source.
In the course of this selection procedure we found that 14 of these objects are in a comoving binary or triple system. This binary fraction of ~15% is similar to the multiplicity rate of 10.4% established by Reylé et al. (2021) irrespective of X-ray emission for the full sample of Gaia-selected UCD candidates, which is one of the two parent samples of our study.
Eight of the 58 eRASS1-detected UCDs and UCD candidates have a previous X-ray detection with XMM-Newton and/or Chandra. For one of them, the candidate UCD was identified as an X-ray emitter in our recent study for serendipitous XMM-Newton detections of Gaia-selected UCD candidates Stelzer et al. (2020).
With the scope to understand the nature of the eRASS1 X-ray emitters for which the optical counterpart is not obviously assigned to the UCD or a companion star we have studied three multiwavelength diagrams. To support our source classification we have compared the location of the UCDs and possible alternative Gaia counterparts in these diagrams with the source population from the large data base provided through the eFEDS fields using the systematic classification scheme from Salvato et al. (2022). As a side remark we note here that our investigation of this multiwavelength space largely confirms the distinction between galactic and extragalactic sources provided for the eFEDS X-ray detections by Salvato et al. (2022), but a small fraction of contaminants might be present in each of the two groups.
Our new eRASS1-detections more than triple the number of known X-ray detections in the UCD regime. The ratio between the X-ray and bolometric luminosities of most of them are much higher than the value of log (Lx/Lbol)~ − 3 which is the empirical upper envelope observed for higher-mass coronally active stars (see e.g., Magaudda et al. 2022). We have found strong evidence that this is the result of flaring activity. In fact, the faint quiescent X-ray emission levels of UCDs are − with the exception of the most nearby ones − not accessible to eRASS1 because of its shallow flux limit10, and they are at the limit even for dedicated XMM-Newton and Chandra observations as previous studies of this subject have shown; see e.g., Stelzer et al. (2006a). Impressive though the increase in X-ray detections we have achieved with eRASS1 is, one should be aware that we have revealed less than 0.5% of the targets in our input samples.
We note that a significant fraction of our new UCD X-ray detections do not belong, strictly speaking, to this object class as they have SpTs of M5/M6 and/or evidence of young age. In fact, 10 of the 21 spectroscopically confirmed UCDs with an eRASS1-detection have been characterized as ‘young’ in the literature (see Table 2). Our two brightest detections, TWA 22 AB and WDS J04469-1117 AB, belong to this group. These two objects show both quiescent and flaring X-ray emission in the eRASS1 light curve, and very similar coronal temperatures of kT ~ 0.74 keV. This is significantly higher than the temperatures derived from analogous observations with eROSITA for earlier-type M dwarfs (Magaudda et al. 2022), a result that we ascribe to the youth (~10 Myr and <300 Myr, respectively) and the variability of these two objects. Our detailed analysis of the eRASS1 data for TWA 22 AB and WDS J04469-1117 AB gives a preview on the potential of eROSITA for enhancing our knowledge of the spectral and timing properties of coronal emission at the bottom of the stellar main-sequence.
If we speculate that each of the 58 UCDs we detected has shown one X-ray flare during eRASS1 we can estimate the typical flare frequency for UCDs from our overall detection rate. Since the detection sensitivity is a strong function of distance we limit this calculation to a distance of 50 pc. About 10% of our full input samples, 1858 objects, are located in this sky volume, and 33 of the 58 X-ray detections are within the same distance limit. Therefore, under the above hypothesis ~1.7% of all UCDs are flaring during the typical timespan between the first and last eRODay of a given sky position. This coarse estimate does not take into account the strong dependence of eRASS exposure time on the sky position nor the long data gaps inbetween individual eRODays. This value for the flare duty cycle should be verified by a systematic analysis of the eROSITA light curves of all detected UCDs as well as on higher statistics that will be obtained by combining our results with similar studies for the other seven all-sky surveys.
It is finally worth pointing out that while significant efforts are being dedicated to measuring the X-ray activity levels of UCDs, and the X-ray emission is being studied for large samples of early-M dwarfs (e.g., Stelzer et al. 2013; Magaudda et al. 2020, 2022), the regime of mid-M dwarfs (SpT M5 and M6) seems now the most poorly examined domain. In this vein, the inclusion of such spectral types in the GagnéM sample is a useful addition. The biases of most studies toward stars earlier than M5 is mainly because optical surveys that are used for target selection usually suffer from incompleteness at the cool end; e.g., the M star studies cited above are based on a proper-motion survey (Lépine & Gaidos 2011) and this sample was shown by Stelzer et al. (2013) to be incomplete for SpT later than M4. Similarly, the earlier ROSAT study of Schmitt & Liefke (2004) included only about a dozen stars with M5/M6 spectral types. Given the uncertainties in the spectral types determined with different methods (see e.g., Fig. 2) a more detailed assessment of this observational gap requires a homogeneous treatment of the input samples used for the search of X-ray detections. The photometric calibration based onGaia colors (see Sect. 3.1) and the increasing number of spec-troscopic studies that have become available for M stars, e.g., through LAMOST (Guo et al. 2015), enable such studies. In the near future it should, therefore, be possible to reduce the observational biases and to obtainapicture ofM dwarfactivity that is continuous through the whole spectral class.
Acknowledgements
We thank the anonymous referee for careful reading and constructive comments. A.K. is supported by the Deutsche Forschungsgemein-schaft (DFG) project number 413113723. M.C. and E.M. acknowledge funding by the Bundesministerium für Wirtschaft und Energie through the Deutsches Zentrum für Luft- und Raumfahrt e.V. (DLR) under grant numbers FKZ 50 OR 2008 and FKZ 50 OR 1808. This work is based on data from eROSITA, the primary instrument aboard SRG, a joint Russian–German science mission supported by the Russian Space Agency (Roskosmos), in the interests of the Russian Academy of Sciences represented by its Space Research Institute (IKI), and the Deutsches Zentrum für Luft- und Raumfahrt (DLR). The SRG spacecraft was built by Lavochkin Association (NPOL) and its subcontractors, and is operated by NPOL with support from the Max-Planck Institute for Extraterrestrial Physics (MPE). The development and construction of the eROSITA X-ray instrument was led by MPE, with contributions from the Dr. Karl Remeis Observatory Bamberg, the University of Hamburg Observatory, the Leibniz Institute for Astrophysics Potsdam (AIP), and the Institute for Astronomy and Astrophysics of the University of Tübingen, with the support of DLR and the Max Planck Society. The Argelander Institute for Astronomy of the University of Bonn and the Ludwig Maximilians Universität Munich also participated in the science preparation for eROSITA. The eROSITA data shown here were processed using the eSASS/NRTA software system developed by the German eROSITA consortium. This publication makes use of data products from the Two Micron All Sky Survey, which is a joint project of the University of Massachusetts and the Infrared Processing and Analysis Center/California Institute of Technology, funded by the National Aeronautics and Space Administration and the National Science Foundation and of data products from the Wide-field Infrared Survey Explorer, which is a joint project of the University of California, Los Angeles, and the Jet Propulsion Laboratory/California Institute of Technology, funded by the National Aeronautics and Space Administration. We present results from the European Space Agency (ESA) space mission Gaia. Gaia data are being processed by the Gaia Data Processing and Analysis Consortium (DPAC). Funding for the DPAC is provided by national institutions, in particular the institutions participating in the Gaia MultiLateral Agreement (MLA). The Gaia mission website is https://www.cosmos.esa.int/gaia. We acknowledge ESASky, developed by the ESAC Science Data Centre (ESDC) team and maintained alongside other ESA science mission’s archives at ESA’s European Space Astronomy Centre (ESAC, Madrid, Spain) and the SVO Filter Profile Service (http://svo2.cab.inta-csic.es/theory/fps/) supported from the Spanish MINECO through grant AYA2017-84 089.
Appendix A X-ray emitting common proper motion pairs involving UCDs
Here, we provide information on CPM binaries involving a UCD or UCD candidate from our samples. Images of these systems in the 2MASS Ks band are shown in Fig. A.1. In all cases the CPM companions are found as possible Gaia counterparts in our ‘reverse’ match and they are within 3 × RADEC_ERR of the X-ray position. All the comoving companions are also brighter than the UCD and in all but three cases they are closer to the eRASS1 position than the UCD. Note that we include here also the UCD pair WDS J04469-1117 AB which is contrary to the other objects of this appendix not removed from the sample studied in this work.
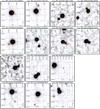 |
Fig. A.1 Ks-band images of UCDs from our input catalogs that are in a CPM binary or triple system. The images are centered on the eROSITA X-ray source position, and a 15″ radius around this position is shown as magenta dashed circle. The Gaia DR2 source from our input UCD catalogs is represented by a red square, its CPM companion by an orange triangle and further Gaia DR2 sources in the field by cyan diamonds. The arrows indicate the PM, and their length and orientation are scaled to the Gaia DR2 values. Note, that for the actual identification of our UCDs with the eRASS1 catalog the Gaia DR2 coordinates had been propagated with their proper motions to the mean eRASS1 observing data (see Sect. 3), while here they have been projected backwards to the 2MASS epoch. |
Relevant parameters for the individual systems are summarized in Table A.1. We provide for each UCD identified to be in a multiple system (Col. 1) the Gaia DR2 identifier of its comoving companion (Col. 2) and other names for that object (Col. 3). Column 4 is the separation between the UCD and its companion. Moreover, we give for the companion its magnitudes in the G, J and W1 band (Cols. 5–7), and its spectral type derived from G − J as explained in Sect. 3.1 (Col. 8). In Col. 9, the eRASS1 X-ray fluxes for the 0.2–2.3 keV band are provided. Since the companions are coronal X-ray sources we did not take the fluxes from eRASS1cat which are based on a power-law model but we computed them from the count rates tabulated in eRASS1cat and the conversion factor CFM‚12 calculated from a thermal model fit to M dwarf spectra by Magaudda et al. (2022) as described in Sect. 4. Finally, Cols. 10–13 comprise flags for indications for youth / moving group membership and earlier reports on binarity together with the respective references.
To summarize, among the 13 pairs comprised of a UCD and a GKM star that are detected in eRASS1, 8 were previously known as binary stars, and 4 are members of a young moving group but they were unknown as binaries. As expected from their brightness in the images the companions are of earlier SpT than the UCD, with the exception of the abovementioned UCD pair; see also Sect. 3.1. In most cases the companion is a mid-M dwarf. Since among late-type, magnetically active stars with earlier SpTs have higher X-ray luminosity (e.g., Schmitt & Liefke 2004) and in all cases both components of the CPM system are reasonably close to the X-ray position, we associate the X-ray source in all these cases with the stellar companion and not with the UCD. These systems have, therefore, been removed from our X-ray analysis, again with the exception of the UCD binary. Note that the basic X-ray parameters from eRASS1 are found in Table 1 for these binary systems.
Table A.2 holds the astrometric parameters from Gaia DR2: proper motion in right ascension and declination for both components in the binaries (Cols. 2+3 and Cols.5+6) and the distance for the companion inferred by Bailer-Jones et al. (2018) from Gaia DR2 data (Col. 7). Not unexpectedly, considering their high PM, all these binaries are nearby with distances ≲ 150 pc.
Optical/IR parameters of CPM companions to UCDs and UCD candidates that have a proper-motion corrected position at the mean eRASS 1 observing date within 3 × the positional error of an eRASS1 source.
Astrometric parameters of the UCD and UCD candidates and their companions for comoving systems from Table A.1.
Appendix B eROSITA source populations
To understand the properties of objects that are not bonafide counterparts to an eRASS1 source and that are not UCDs we examine the eROSITA, Gaia and WISE parameter space.
In Sect. 3.2, we have argued for evidence of distinct populations of different astrophysical populations in the G − GRP vs GBP − G diagram. To verify this claim we make use of the main eFEDS point source catalog (Brunner et al. 2022). We adopt the results from the dedicated source identification procedure described by Salvato et al. (2022) that classifies the eFEDS X-ray sources as either galactic or extragalactic. In the extragalactic category we consider the objects labeled as ‘SECURE EXTRAGALACTIC and those labeled ‘LIKELY EXTRAGALACTIC, and analogously in the galactic category where we consider the ‘SECURE GALACTIC and ‘LIKELY GALACTIC ones. We limit our study to the objects that have full Gaia photometry (G, GRB and GRP > 0), valid data in the lowest WISE band (W1 > 0) and reliable counterpart according to a quality flag (CTP_quality > =3) defined by Salvato et al. (2022).
In Fig. B.1, we display the two groups of objects in the G − GRP vs GBP − G diagram. The distribution of the ‘extragalac-tic’ objects in Fig. B.1 resembles a combination of the ‘quasar’ and ‘galaxy’ CCDs presented by Bailer-Jones et al. (2019), with a weak extension onto the stellar main-sequence (drawn as a green line). The ‘galactic’ objects clearly follow that sequence, but with a significant upwards spread, thus also showing some overlap with the ‘extragalactic’ population. These overlaps might be related to residual contamination of each group with objects from the other type.
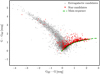 |
Fig. B.1 Gaia color-color diagram for the two subsamples of eFEDS sources identified as extragalactic (gray) and galactic (red) by Salvato et al. (2022). The stellar main-sequence (green) is obtained from the table maintained by E. Mamajek8. |
In Fig. B.2, we examine for the same two groups of objects the W1 vs log fx diagram which was introduced by Salvato et al. (2018) to tentatively distinguish extragalactic from galactic objects based on an empirical dividing line shown in blue in Fig. B.2. Overall this line distinguishes well the two populations as already suggested by Salvato et al. (2018); see Salvato et al. (2022), for a discussion of this diagram with relation to the eFEDS population.
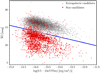 |
Fig. B.2 WISE W1 magnitude versus logarithm of the X-ray flux in 0. 6–2.0 keV for the objects from the main eFEDS catalog distinguishing ‘galactic’ from ‘extragalactic’ sources as described in the text. The line denotes the empirical separator between stars and other objects as defined by Salvato et al. (2018) with extragalactic sources being located above the line. |
We finally show the X-ray over optical flux ratio versus Gaia color for the eFEDS sample in Fig. B.3 where with few exceptions the ‘galactic’ and ‘extragalactic’ objects are clearly separated. The small group in the right panel that is above the main locus of the ‘galactic’ sources shows strong overlap with the galactic objects above the separator in the W1 vs fx diagram, with 155 of 176 galactic sources (~88%) that are upwards outliers in terms of fx/ fG ratio being located above the line in the W1 − fx diagram. These objects could be flaring stars or compact objects.
To summarize, these figures support the classification scheme of Salvato et al. (2022) in terms of galactic versus extra-galactic sources, but a small subsample of them is overlapping each other. The extragalactic sample reaches down to the upper stellar main-sequence. The upwards outliers in the sample of ‘galactic’ objects (with log(fx/fG) ≥ −2) could be AGN or flaring stars.
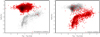 |
Fig. B.3 Logarithm of the X-ray over G band flux versus Gaia blue and red photometer color for the full eFEDS sample. Two panels with the same data are shown to visualize the overlap of the extragalactic and galactic candidates selected from Fig. B.2. The extragalactic sample is highlighted in red in the left panel and the galactic sample is red in the right panel. |
Appendix C Non-UCD eRASS1 counterparts
In Table C.1, we list the properties of the ‘plausible’ counterparts to eRASS1 X-ray sources that are not UCDs or UCD candidates. Table C.1 provides their photometry (G, J and W1 in Cols. 3-5), spectral type estimated from G − J assuming a main-sequence star and adopting the same calibration as in Sect. 3.1 (Col. 6). Clearly, the spectral type is meaningful only if the object is a star. Furthermore, Table C.1 holds the Gaia DR2 distance from Bailer-Jones et al. (2018) (Col. 7), X-ray fluxes from eRASS1cat for the 0.6–2.3keV band and the 2.3–5.0keV band (Cols. 8 and 9). The latter energy band was included because is relevant for extragalactic objects which tend to be harder X-ray sources than coronally active stars. Finally, in Cols. 10 and 11 the classification from the literature and the corresponding reference are given.
Multi-wavelength properties of non-UCDs considered to be more plausible counterparts to eRASS 1 sources than the UCD in its vicinity.
The objects in Table C.1 belong to two groups selected with different criteria (see Sect. 3.2). The final classification of these objects is not within the scope of our work. However, here we briefly discuss the two groups and the possible nature of its members.
The first group comprises eRASS1 sources that have a UCD or UCD candidate as the Gaia object with the smallest X-ray to optical separation but where another Gaia source in the match radius is brighter suggesting the association of the eRASS1 emission with this object rather than the UCD. All but one of these 7 objects have been classified as a star in the literature. In contrast to the objects from Appendix A these stars do not share the proper motion with the UCD.
The other group are Gaia sources that have the smallest value for the X-ray to optical separation among all Gaia objects in the match radius of 3 × the RADEC_ERR around the eRASS1 position. One of these objects, Gaia DR2 3902395843353397248, was identified as a bonafide eRASS1 X-ray source on the basis of an archival XMM-Newton observation. This is a known quasar, 2XMMJ123337.5+073133, from the catalog of Miller et al. (2011). The XXMM-Newton data was analyzed by Stelzer et al. (2020) in a study of serendipitous X-ray detections of UCDs from the XMM-Newton archive. In that work the source was recognized as an extragalactic object on the basis of its X-ray spectrum which is consistent with a power-law of typical index (Γ ~ 2) but not with thermal emission at temperatures typical for M-type dwarfs.
The position of the other non-UCDs that are closest Gaia counterparts to eRASS1 sources in the multiwavelength parameter space can be seen in the right panels of Fig. 3, where they are represented as gray circles surrounded by an annulus. Note that some sources without blue and red photometer, and WISE data are missing in these diagrams. From comparison with Fig. B.3 these objects are likely a mixture of extragalactic objects and stars, and this is consistent with the information compiled from the literature.
References
- Arnaud, K. A. 1996, in ASP Conf. Ser., 101, Astronomical Data Analysis Software and Systems V, eds. G. H. Jacoby, & J. Barnes, 17 [NASA ADS] [Google Scholar]
- Artigau, É., Gagné, J., Faherty, J., et al. 2015, ApJ, 806, 254 [NASA ADS] [CrossRef] [Google Scholar]
- Assef, R. J., Stern, D., Noirot, G., et al. 2018, ApJS, 234, 23 [Google Scholar]
- Audard, M., Osten, R. A., Brown, A., et al. 2007, A&A, 471, L63 [NASA ADS] [CrossRef] [EDP Sciences] [Google Scholar]
- Bailer-Jones, C. A. L., Rybizki, J., Fouesneau, M., Mantelet, G., & Andrae, R. 2018, AJ, 156, 58 [Google Scholar]
- Bailer-Jones, C. A. L., Fouesneau, M., & Andrae, R. 2019, MNRAS, 490, 5615 [CrossRef] [Google Scholar]
- Baraffe, I., Chabrier, G., Allard, F., & Hauschildt, P. H. 2002, A&A, 382, 563 [CrossRef] [EDP Sciences] [Google Scholar]
- Berger, E., Rutledge, R. E., Reid, I. N., et al. 2005, ApJ, 627, 960 [NASA ADS] [CrossRef] [Google Scholar]
- Boller, T., Freyberg, M. J., Trümper, J., et al. 2016, A&A, 588, A103 [NASA ADS] [CrossRef] [EDP Sciences] [Google Scholar]
- Bonnefoy, M., Chauvin, G., Dumas, C., et al. 2009, A&A, 506, 799 [NASA ADS] [CrossRef] [EDP Sciences] [Google Scholar]
- Brunner, H., Liu, T., Lamer, G., et al. 2022, A&A, 661, A1 (eROSITA EDR SI) [NASA ADS] [CrossRef] [EDP Sciences] [Google Scholar]
- Burgasser, A. J., & Putman, M. E. 2005, ApJ, 626, 486 [NASA ADS] [CrossRef] [Google Scholar]
- Cantat-Gaudin, T., Vallenari, A., Sordo, R., et al. 2018, A&A, 615, A49 [NASA ADS] [CrossRef] [EDP Sciences] [Google Scholar]
- Cook, B. A., Williams, P. K. G., & Berger, E. 2014, ApJ, 785, 10 [NASA ADS] [CrossRef] [Google Scholar]
- Cook, N. J., Pinfield, D. J., Marocco, F., et al. 2016, MNRAS, 457, 2192 [NASA ADS] [CrossRef] [Google Scholar]
- Cruz, K. L., Reid, I. L., Kirkpatrick, J. D., et al. 2007, AJ, 133, 439 [NASA ADS] [CrossRef] [Google Scholar]
- De Luca, A., Stelzer, B., Burgasser, A. J., et al. 2020, A&A, 634, L13 [NASA ADS] [CrossRef] [EDP Sciences] [Google Scholar]
- Evans, I. N., Primini, F. A., Glotfelty, K. J., et al. 2010, ApJS, 189, 37 [NASA ADS] [CrossRef] [Google Scholar]
- Filippazzo, J. C., Rice, E. L., Faherty, J., et al. 2015, ApJ, 810, 158 [Google Scholar]
- Foster, G., Poppenhäger, K., Ilic, N., & Schwope, A. 2022, A&A, 661, A23 (eROSITA EDR SI) [NASA ADS] [CrossRef] [EDP Sciences] [Google Scholar]
- Gizis, J. E., Monet, D. G., Reid, I. N., et al. 2000, AJ, 120, 1085 [Google Scholar]
- Gizis, J. E., Burgasser, A. J., Berger, E., et al. 2013, ApJ, 779, 172 [NASA ADS] [CrossRef] [Google Scholar]
- Güdel, M., Schmitt, J. H. M. M., Bookbinder, J. A., & Fleming, T. A. 1993, ApJ, 415, 236 [CrossRef] [Google Scholar]
- Guo, Y.-X., Yi, Z.-P., Luo, A. L., et al. 2015, Res. Astron. Astrophys., 15, 1182 [CrossRef] [Google Scholar]
- Hallinan, G., Antonova, A., Doyle, J. G., et al. 2006, ApJ, 653, 690 [NASA ADS] [CrossRef] [Google Scholar]
- Hallinan, G., Antonova, A., Doyle, J. G., et al. 2008, ApJ, 684, 644 [Google Scholar]
- Hartman, Z. D., & Lépine, S. 2020, ApJS, 247, 66 [NASA ADS] [CrossRef] [Google Scholar]
- Johnstone, C. P., & Güdel, M. 2015, A&A, 578, A129 [NASA ADS] [CrossRef] [EDP Sciences] [Google Scholar]
- Kastner, J. H., Zuckerman, B., Weintraub, D. A., & Forveille, T. 1997, Science, 277, 67 [Google Scholar]
- Kastner, J. H., Crigger, L., Rich, M., & Weintraub, D. A. 2003, ApJ, 585, 878 [NASA ADS] [CrossRef] [Google Scholar]
- Lépine, S., & Gaidos, E. 2011, AJ, 142, 138 [Google Scholar]
- Liebert, J., Kirkpatrick, J. D., Reid, I. N., & Fisher, M. D. 1999, ApJ, 519, 345 [NASA ADS] [CrossRef] [Google Scholar]
- Magaudda, E., Stelzer, B., Covey, K. R., et al. 2020, A&A, 638, A20 [NASA ADS] [CrossRef] [EDP Sciences] [Google Scholar]
- Magaudda, E., Stelzer, B., Raetz, St., et al. 2022, A&A, 661, A29 (eROSITA EDR SI) [NASA ADS] [CrossRef] [EDP Sciences] [Google Scholar]
- Malo, L., Doyon, R., Lafrenière, D., et al. 2013, ApJ, 762, 88 [Google Scholar]
- Marchesi, S., Civano, F., Elvis, M., et al. 2016, ApJ, 817, 34 [Google Scholar]
- Mason, B. D., Wycoff, G. L., Hartkopf, W. I., Douglass, G. G., & Worley, C. E. 2001, AJ, 122, 3466 [Google Scholar]
- McMahon, R. G., Banerji, M., Gonzalez, E., et al. 2013, The Messenger, 154, 35 [NASA ADS] [Google Scholar]
- Miller, B. P., Brandt, W. N., Schneider, D. P., et al. 2011, ApJ, 726, 20 [Google Scholar]
- Mohanty, S., & Basri, G. 2003, ApJ, 583, 451 [NASA ADS] [CrossRef] [Google Scholar]
- Mohanty, S., Basri, G., Shu, F., Allard, F., & Chabrier, G. 2002, ApJ, 571, 469 [NASA ADS] [CrossRef] [Google Scholar]
- Paudel, R. R., Gizis, J. E., Mullan, D. J., et al. 2020, MNRAS, 494, 5751 [NASA ADS] [CrossRef] [Google Scholar]
- Pineda, J. S., Hallinan, G., & Kao, M. M. 2017, ApJ, 846, 75 [Google Scholar]
- Predehl, P., Andritschke, R., Arefiev, V., et al. 2021, A&A, 647, A1 [EDP Sciences] [Google Scholar]
- Reylé, C. 2018, A&A, 619, L8 [NASA ADS] [CrossRef] [EDP Sciences] [Google Scholar]
- Reylé, C., Sanchez Gimenez, V., & Lagarde, N. 2021, Ultra-cool dwarf in wide binaries from Gaia [Google Scholar]
- Saito, R. K., Hempel, M., Minniti, D., et al. 2012, A&A, 537, A107 [NASA ADS] [CrossRef] [EDP Sciences] [Google Scholar]
- Salvato, M., Buchner, J., Budavári, T., et al. 2018, MNRAS, 473, 4937 [Google Scholar]
- Salvato, M., Wolf, J., Dwelly, T., et al. 2022, A&A, 661, A3 (eROSITA EDR SI) [NASA ADS] [CrossRef] [EDP Sciences] [Google Scholar]
- Schmitt, J. H. M. M., & Liefke, C. 2004, A&A, 417, 651 [NASA ADS] [CrossRef] [EDP Sciences] [Google Scholar]
- Schmidt, S. J., Cruz, K. L., Bongiorno, B. J., Liebert, J., & Reid, I. N. 2007, AJ, 133, 2258 [NASA ADS] [CrossRef] [Google Scholar]
- Schmidt, S. J., Hawley, S. L., West, A. A., et al. 2015, AJ, 149, 158 [NASA ADS] [CrossRef] [Google Scholar]
- Schneider, D. P., Hall, P. B., Richards, G. T., et al. 2007, AJ, 134, 102 [NASA ADS] [CrossRef] [Google Scholar]
- Secrest, N. J., Dudik, R. P., Dorland, B. N., et al. 2015, ApJS, 221, 12 [NASA ADS] [CrossRef] [Google Scholar]
- Shkolnik, E., Liu, M. C., & Reid, I. N. 2009, ApJ, 699, 649 [CrossRef] [Google Scholar]
- Shkolnik, E. L., Anglada-Escudé, G., Liu, M. C., et al. 2012, ApJ, 758, 56 [Google Scholar]
- Smart, R. L., Marocco, F., Caballero, J. A., et al. 2017, MNRAS, 469, 401 [NASA ADS] [CrossRef] [Google Scholar]
- Smart, R. L., Marocco, F., Sarro, L. M., et al. 2019, MNRAS, 485, 4423 [Google Scholar]
- Stelzer, B., Micela, G., Flaccomio, E., Neuhäuser, R., & Jayawardhana, R. 2006a, A&A, 448, 293 [NASA ADS] [CrossRef] [EDP Sciences] [Google Scholar]
- Stelzer, B., Schmitt, J. H. M. M., Micela, G., & Liefke, C. 2006b, A&A, 460, L35 [NASA ADS] [CrossRef] [EDP Sciences] [Google Scholar]
- Stelzer, B., Alcalá, J., Biazzo, K., et al. 2012, A&A, 537, A94 [NASA ADS] [CrossRef] [EDP Sciences] [Google Scholar]
- Stelzer, B., Marino, A., Micela, G., López-Santiago, J., & Liefke, C. 2013, MNRAS, 431, 2063 [Google Scholar]
- Stelzer, B., Klutsch, A., & Kindarkhedia, D. 2020, A&A submitted [Google Scholar]
- Stevens, D. J., Stassun, K. G., & Gaudi, B. S. 2017, AJ, 154, 259 [NASA ADS] [CrossRef] [Google Scholar]
- Teixeira, R., Ducourant, C., Chauvin, G., et al. 2009, A&A, 503, 281 [NASA ADS] [CrossRef] [EDP Sciences] [Google Scholar]
- Tian, H.-J., El-Badry, K., Rix, H.-W., & Gould, A. 2020, ApJS, 246, 4 [Google Scholar]
- Vasconcellos, E. C., de Carvalho, R. R., Gal, R. R., et al. 2011, AJ, 141, 189 [Google Scholar]
- Webb, N. A., Coriat, M., Traulsen, I., et al. 2020, A&A, 641, A136 [NASA ADS] [CrossRef] [EDP Sciences] [Google Scholar]
- West, A. A., Bochanski, J. J., Hawley, S. L., et al. 2006, AJ, 132, 2507 [NASA ADS] [CrossRef] [Google Scholar]
- Williams, P. K. G., Cook, B. A., & Berger, E. 2014, ApJ, 785, 9 [Google Scholar]
- Winters, J. G., Henry, T. J., Jao, W.-C., et al. 2019, AJ, 157, 216 [NASA ADS] [CrossRef] [Google Scholar]
- Xiang, M., Ting, Y.-S., Rix, H.-W., et al. 2019, ApJS, 245, 34 [Google Scholar]
- XMM-SSC 2018, VizieR Online Data Catalog, IX/53 [Google Scholar]
ESA-Sky is an application to visualize and download archived astronomical data that is developed at ESAC, Madrid, Spain, by the ESAC Science Data Centre (ESDC). It is available at https://sky.esa.int/
The CPM companion is not in all cases the Gaia source that is closest to the eRASS1cat position but it is by far the brightest; see Appendix A.
The G band flux was calculated from the magnitude using the zeropoints, effective wavelength and bandwidth provided by the Spanish Virtual Observatory (SVO) filter service at http://svo2.cab.inta-csic.es/theory/fps/
This table is available at http://www.pas.rochester.edu/~emamajek
eFEDS is a ~140 sq.deg large area in the southern sky that was observed with eROSITA in scanning mode during its Calibration & Performance Verification phase with a typical on-source exposure time of 1 ks (Brunner et al. 2022). This is significantly larger than the average exposure during eRASS1, and the official source catalog comprises 27 910 X-ray detections.
All Tables
Basic X-ray parameters from eRASS1cat for the UCDs from GagnéM and UCD candidates from Reylé (2018) that are within 3× the uncertainty of the X-ray position.
Multi-wavelength properties of the UCDs and UCD candidates identified as bonafide or plausible counterparts to an eRASS1 X-ray source.
Archival X-ray fluxes of UCDs and UCD candidates extracted from the 4XMM-DR9 and CSC 2.0 catalogs.
Optical/IR parameters of CPM companions to UCDs and UCD candidates that have a proper-motion corrected position at the mean eRASS 1 observing date within 3 × the positional error of an eRASS1 source.
Astrometric parameters of the UCD and UCD candidates and their companions for comoving systems from Table A.1.
Multi-wavelength properties of non-UCDs considered to be more plausible counterparts to eRASS 1 sources than the UCD in its vicinity.
All Figures
|
Fig. 1 Gaia color-magnitude diagram (MG vs G GRP) for the lists of UCDs defined in Sect. 2. In each panel, all three master tables are shown but one of them is high-lighted in red: left – known late-M dwarfs from J. Gagnés M6…M9 dwarf archive, middle – known MLTY dwarfs with Gaia-DR2 data from the GUCDS sample (Smart et al. 2019), right – new Gaia-discovered UCD candidates (Reylé 2018). |
| In the text | |
|
Fig. 2 Comparison of spectroscopic and photometric spectral types for the ‘cleaned’ GagnéM and GUCDS samples. The spectroscopic SpTs are obtained from the original catalogs, the Gagné dwarf archive and Smart et al. (2019), while the photometric SpTs have been computed using the polynomial relation with MG from Reylé (2018). Objects with a flag indicating youth or uncertain spectroscopic SpT in the two catalogs have been omitted, as the MG–SpT relation fron Reylé (2018) is valid for the main-sequence. |
| In the text | |
|
Fig. 3 Gaia color-color diagram (top), X-ray to G band flux ratio (middle) and W1 magnitude vs X-ray flux (bottom) for subsamples illustrating the process for the selection of the Gaia counterpart to the eRASS1cat source. The left panels show the eRASS1cat sources to which a ‘bonafide’ counterpart has been assigned and the right panels show the possible counterparts for the remaining sources from eRASS1cat. Small circles represent UCD candidates from Reylé (2018) and large circles spectroscopically confirmed UCDs from GagnéM. UCDs from the input master lists are shown in red, their CPM companions in yellow, and counterparts assigned based on archival X-ray detections in blue. All other Gaia sources within the search box around the eRASS1cat X-ray positions are marked in gray. In the right panel the brightest Gaia source and the one closest to the X-ray position is indicated for each eRASS1cat source. The black line in the bottom panels is an empirical separator between extragalactic candidates (above) and stellar candidate (below) introduced by Salvato et al. (2018). |
| In the text | |
|
Fig. 4 Gaia color-magnitude diagram (MG vs G GRP) for the two input lists of UCDs (GagnéM) and UCD candidates (Reylé 2018) described in Sect. 2. The subsamples that our source identification from Sect. 3 ascribes as bonafide or plausible counterpart to an eRASS1 X-ray source are highlighted with larger circles and colors, red for the known UCDs and blue for the UCD candidates. |
| In the text | |
|
Fig. 5 Distribution of spectral types, distances and X-ray luminosities for the ‘bonafide’ and ‘plausible’ X-ray emitting UCDs and UCD candidates detected in eRASS1. SpTs from the GagnéM sample of known UCDs are from optical spectroscopy, while those from the Gaia UCD candidates from Reylé (2018) are photometric estimates based on G J color. |
| In the text | |
|
Fig. 6 X-ray luminosity and its ratio with bolometric luminosity for UCDs and UCD candidates detected in eRASS1 compared to literature samples described in the text of Sect. 6.1. |
| In the text | |
|
Fig. 7 eRASS1 light curves of the two UCDs with more than 100 counts in the eRASS1cat broad band: top – the UCD binary WDS J04469-1117AB (bin size is 80 s), bottom – TWA 22 (bin size is 50 s). |
| In the text | |
|
Fig. 8 eRASS1 spectra of the two UCDs with more than 100 counts in the eRASS1cat broad band: top – the UCD binary WDS J04469-1117AB, bottom – TWA22AB. Both are shown together with their best-fitting 2-T APEC model and the residuals of the fit. |
| In the text | |
|
Fig. 9 eRASS hardness ratios versus flux for UCDs and UCD candidates. The flux refers to the 0.2 2.3 keV band (the sum of eRASS1 Band 1 and Band 2) and the hardness ratio is based on the count rates in the 0.6 2.3 keV band (eRASS1 Band 2, M) and the 0.2 0.6 keV band (eRASS1 Band 1, S); see text in Sect. 6.2 for more details. |
| In the text | |
|
Fig. 10 X-ray flux from the 4XMM-DR9 and CSC 2.0 catalogs compared to the eRASS1cat flux for the 7 eRASS1 detected UCDs and the one UCD candidate with an archival XMM-Newton and/or Chandra detection (one object has both an XMM-Newton and a Chandra detection and is marked with a cross-symbol); the values for the archival X-ray fluxes are listed in Table 4. The black line corresponds to equal flux with the two compared instruments. To enable the comparison with the archival fluxes, the eROSITA fluxes were calculated with a power-law model. |
| In the text | |
|
Fig. A.1 Ks-band images of UCDs from our input catalogs that are in a CPM binary or triple system. The images are centered on the eROSITA X-ray source position, and a 15″ radius around this position is shown as magenta dashed circle. The Gaia DR2 source from our input UCD catalogs is represented by a red square, its CPM companion by an orange triangle and further Gaia DR2 sources in the field by cyan diamonds. The arrows indicate the PM, and their length and orientation are scaled to the Gaia DR2 values. Note, that for the actual identification of our UCDs with the eRASS1 catalog the Gaia DR2 coordinates had been propagated with their proper motions to the mean eRASS1 observing data (see Sect. 3), while here they have been projected backwards to the 2MASS epoch. |
| In the text | |
|
Fig. B.1 Gaia color-color diagram for the two subsamples of eFEDS sources identified as extragalactic (gray) and galactic (red) by Salvato et al. (2022). The stellar main-sequence (green) is obtained from the table maintained by E. Mamajek8. |
| In the text | |
|
Fig. B.2 WISE W1 magnitude versus logarithm of the X-ray flux in 0. 6–2.0 keV for the objects from the main eFEDS catalog distinguishing ‘galactic’ from ‘extragalactic’ sources as described in the text. The line denotes the empirical separator between stars and other objects as defined by Salvato et al. (2018) with extragalactic sources being located above the line. |
| In the text | |
|
Fig. B.3 Logarithm of the X-ray over G band flux versus Gaia blue and red photometer color for the full eFEDS sample. Two panels with the same data are shown to visualize the overlap of the extragalactic and galactic candidates selected from Fig. B.2. The extragalactic sample is highlighted in red in the left panel and the galactic sample is red in the right panel. |
| In the text | |
Current usage metrics show cumulative count of Article Views (full-text article views including HTML views, PDF and ePub downloads, according to the available data) and Abstracts Views on Vision4Press platform.
Data correspond to usage on the plateform after 2015. The current usage metrics is available 48-96 hours after online publication and is updated daily on week days.
Initial download of the metrics may take a while.