Fig. 3
Download original image
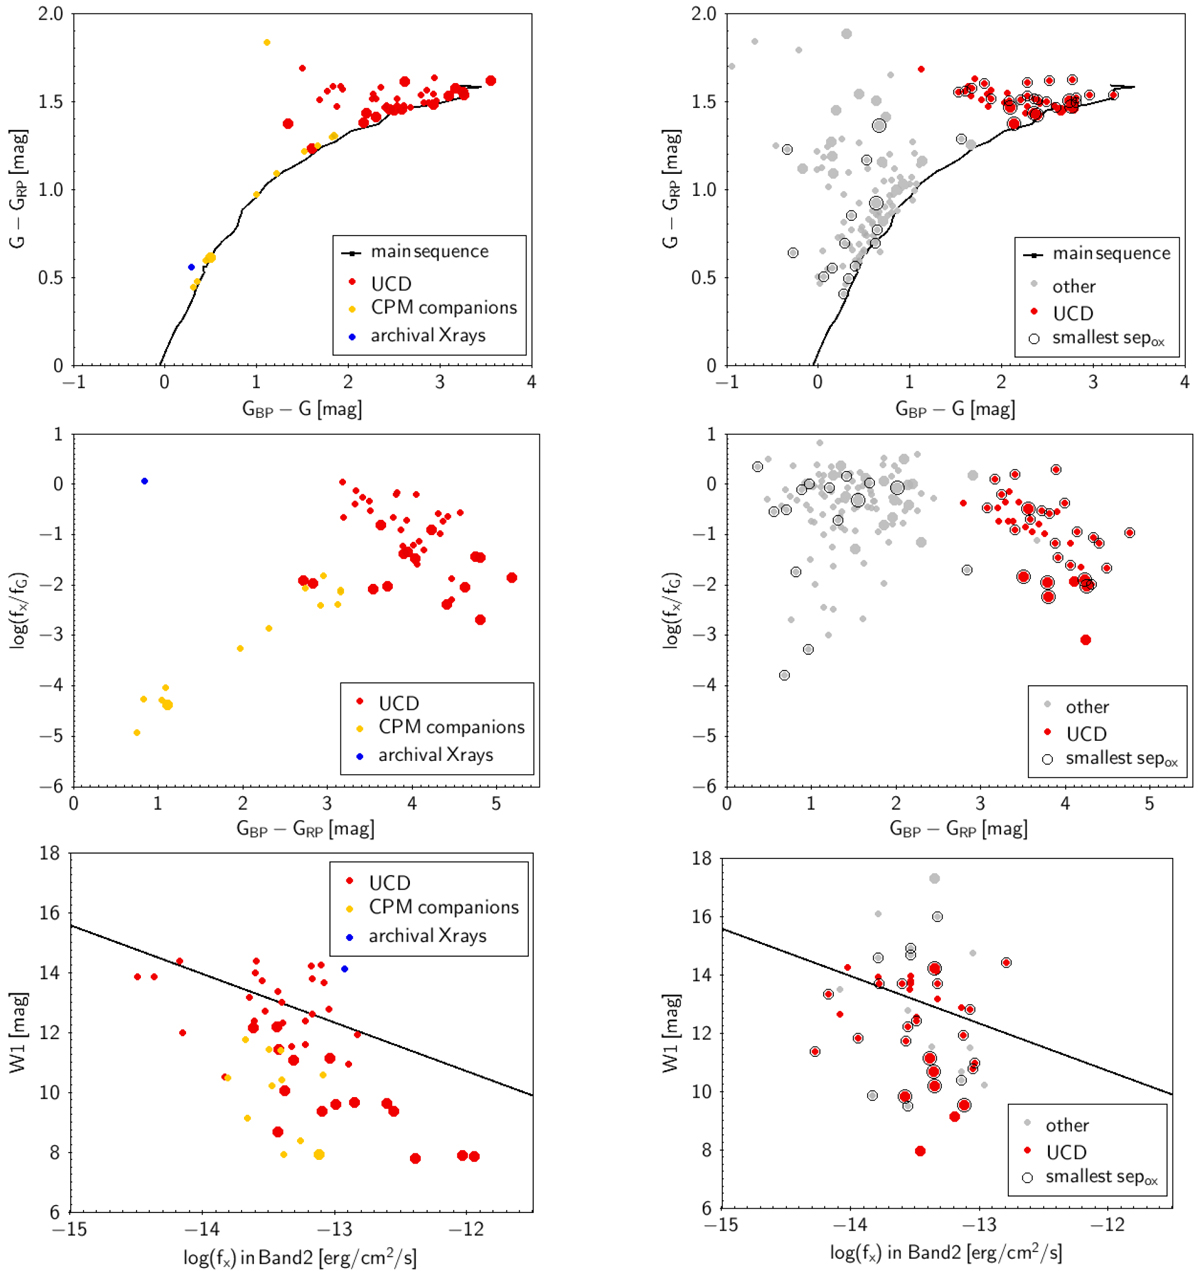
Gaia color-color diagram (top), X-ray to G band flux ratio (middle) and W1 magnitude vs X-ray flux (bottom) for subsamples illustrating the process for the selection of the Gaia counterpart to the eRASS1cat source. The left panels show the eRASS1cat sources to which a ‘bonafide’ counterpart has been assigned and the right panels show the possible counterparts for the remaining sources from eRASS1cat. Small circles represent UCD candidates from Reylé (2018) and large circles spectroscopically confirmed UCDs from GagnéM. UCDs from the input master lists are shown in red, their CPM companions in yellow, and counterparts assigned based on archival X-ray detections in blue. All other Gaia sources within the search box around the eRASS1cat X-ray positions are marked in gray. In the right panel the brightest Gaia source and the one closest to the X-ray position is indicated for each eRASS1cat source. The black line in the bottom panels is an empirical separator between extragalactic candidates (above) and stellar candidate (below) introduced by Salvato et al. (2018).
Current usage metrics show cumulative count of Article Views (full-text article views including HTML views, PDF and ePub downloads, according to the available data) and Abstracts Views on Vision4Press platform.
Data correspond to usage on the plateform after 2015. The current usage metrics is available 48-96 hours after online publication and is updated daily on week days.
Initial download of the metrics may take a while.