Fig. 6
Download original image
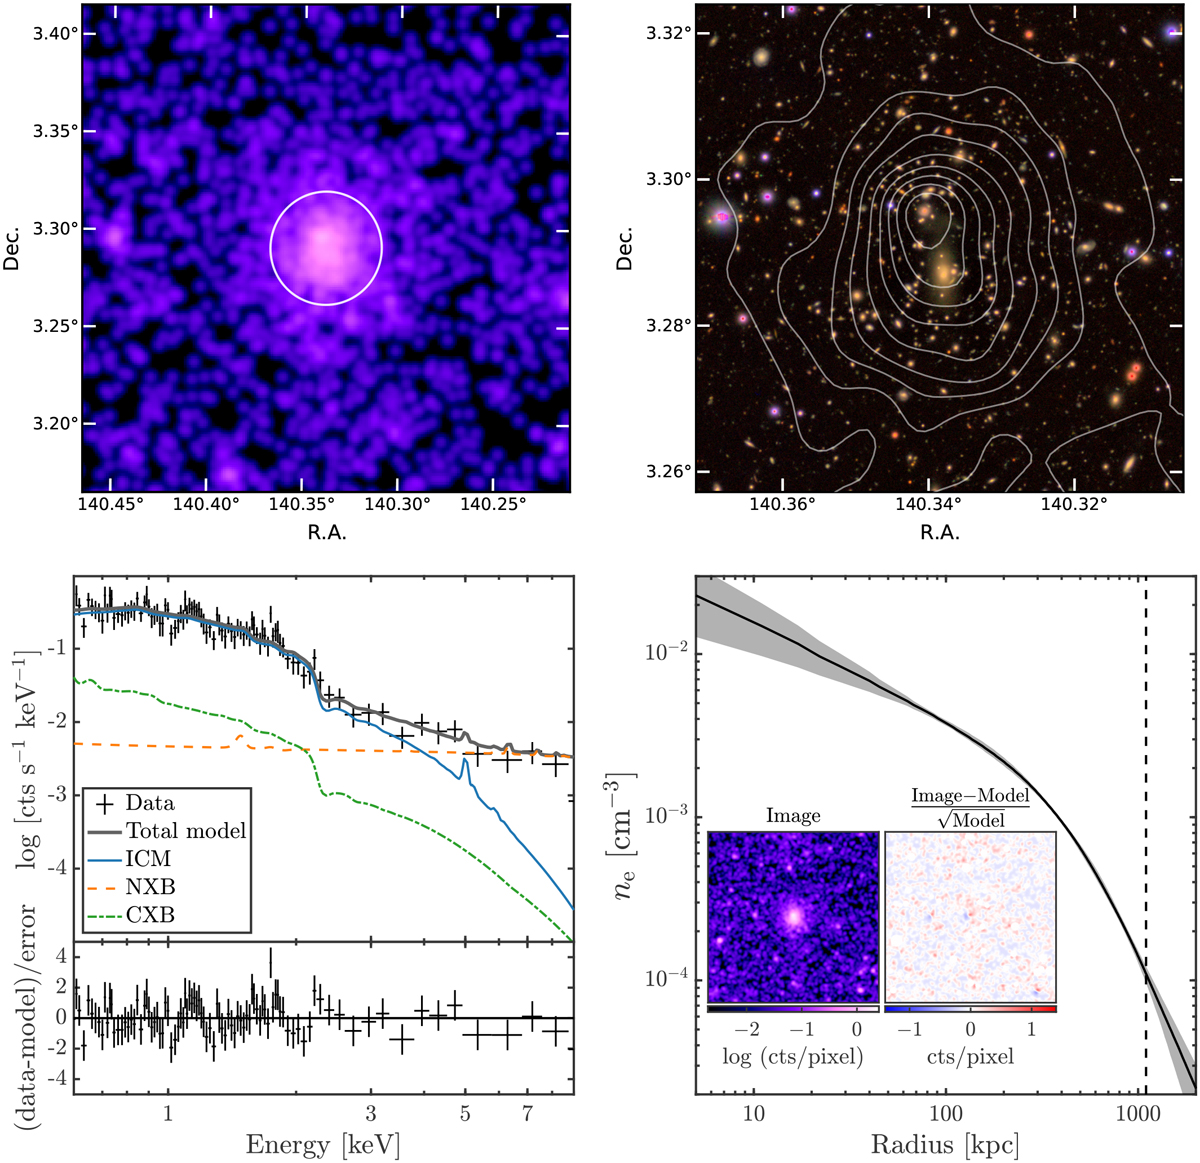
Results of imaging and spectral analysis for cluster eFEDS J092121.2+031726 at redshift 0.333 (spectroscopic) as an example. This cluster is detected with ℒext = 478.6 and ℒdet = 1729.8 and has one of the highest S/Ns in our sample. The temperature and soft-band luminosity within 500 kpc are ![]() keV and
keV and ![]() erg s-1. Upper left: soft-band (0.5–2 keV) eROSITA image. The white circle marks the region of r = 500 kpc. The image is smoothed with a Gaussian with FWHM = 12”. Upper right: Subaru HSC image of the central region in the (ɀ, i, r) bands. Superimposed in white are the X-ray contours. Lower left: spectrum within the 500 kpc region. The spectra and the corresponding responses of the seven TMs are merged for clarity. The total model, ICM model, non X-ray background, and cosmic X-ray background are plotted separately. Lower right: electron density profile obtained from the spectral and imaging analysis. The dashed vertical line shows the R500 of this cluster, 1.1 Mpc, estimated from the L - M scaling relation. The inset images show the result of 2D image fitting. The original soft-band image is on the left, and the residual image is on the right.
erg s-1. Upper left: soft-band (0.5–2 keV) eROSITA image. The white circle marks the region of r = 500 kpc. The image is smoothed with a Gaussian with FWHM = 12”. Upper right: Subaru HSC image of the central region in the (ɀ, i, r) bands. Superimposed in white are the X-ray contours. Lower left: spectrum within the 500 kpc region. The spectra and the corresponding responses of the seven TMs are merged for clarity. The total model, ICM model, non X-ray background, and cosmic X-ray background are plotted separately. Lower right: electron density profile obtained from the spectral and imaging analysis. The dashed vertical line shows the R500 of this cluster, 1.1 Mpc, estimated from the L - M scaling relation. The inset images show the result of 2D image fitting. The original soft-band image is on the left, and the residual image is on the right.
Current usage metrics show cumulative count of Article Views (full-text article views including HTML views, PDF and ePub downloads, according to the available data) and Abstracts Views on Vision4Press platform.
Data correspond to usage on the plateform after 2015. The current usage metrics is available 48-96 hours after online publication and is updated daily on week days.
Initial download of the metrics may take a while.