Fig. 4
Download original image
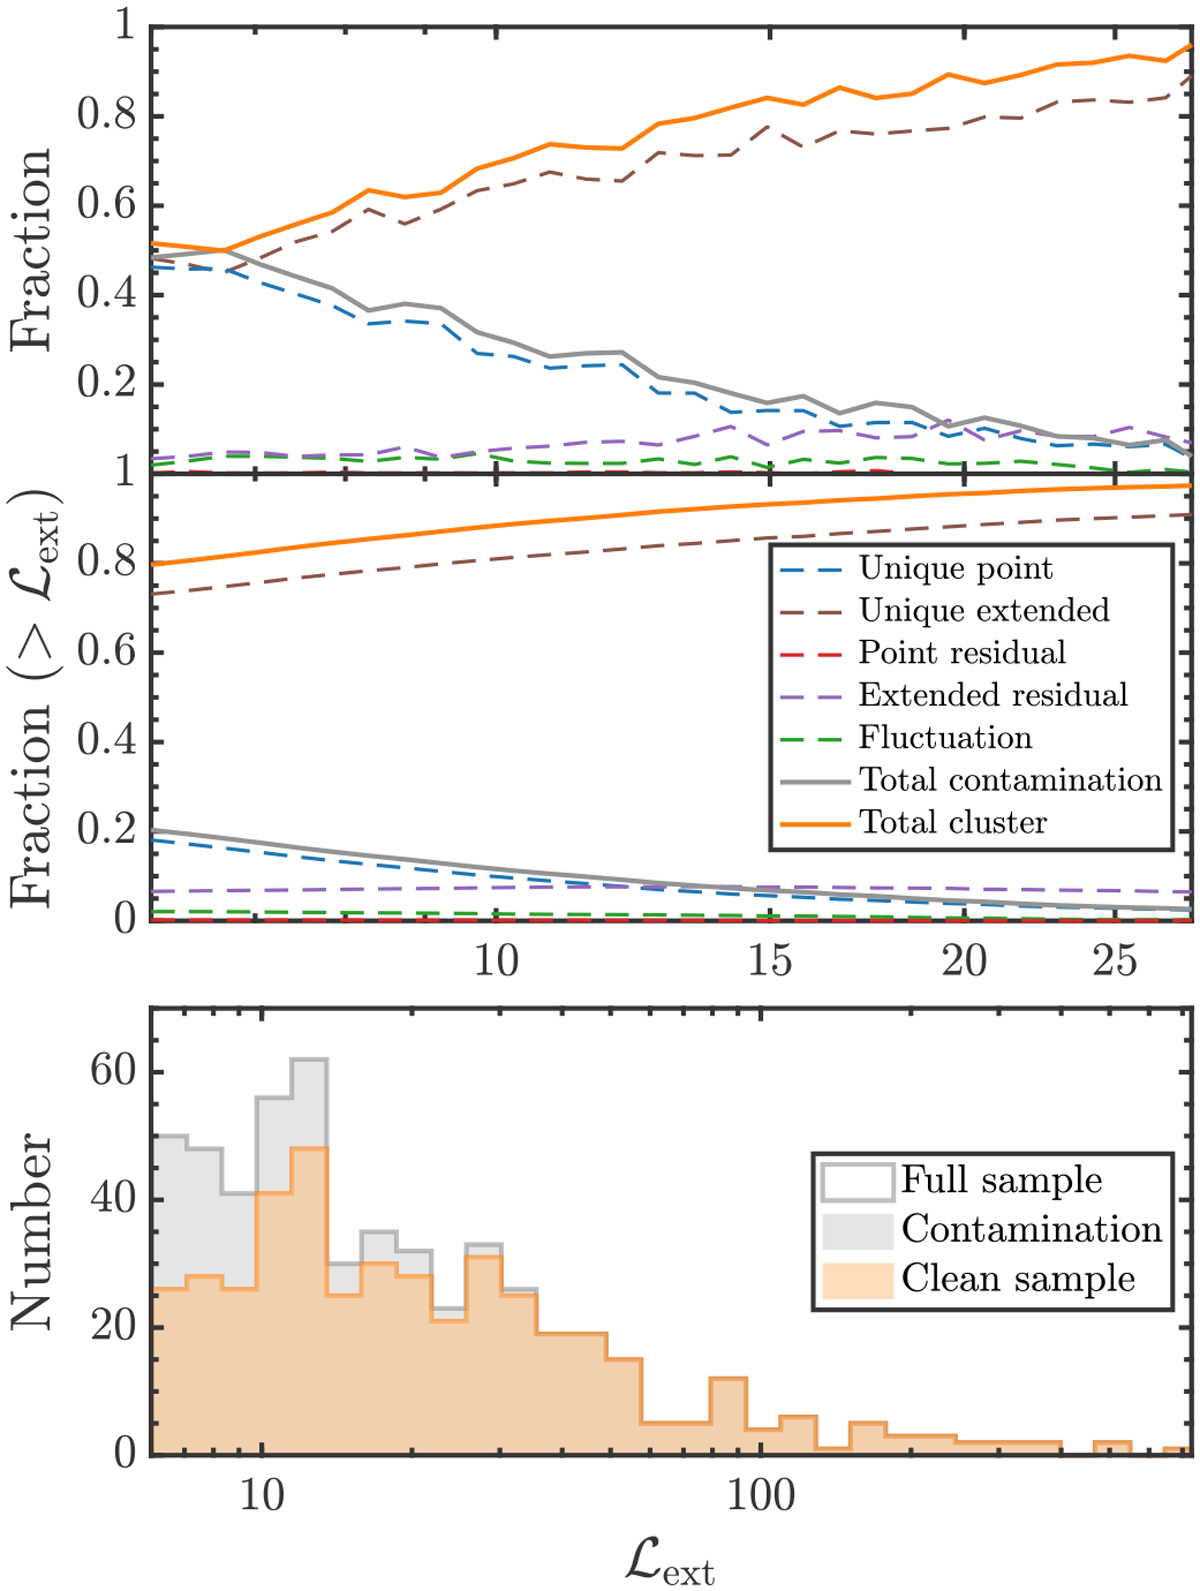
Contamination fraction assessment in our sample based on simulations. Upper panel: cumulative detection fraction of sources in the five classes as a function of extent likelihood. The orange solid line shows the total fraction of sources classified as real clusters, namely, the sum of unique extended source and extended source residual. The total contamination is plotted with the solid gray line based on summing all the other three classes. Middle panel: cumulative detecting fraction of sources in the five classes. Lower panel: distribution of extent likelihood of the clusters in our catalog. The clean sample after removing the fraction of contamination is shown in orange. The gray bar represents the contamination in each bin.
Current usage metrics show cumulative count of Article Views (full-text article views including HTML views, PDF and ePub downloads, according to the available data) and Abstracts Views on Vision4Press platform.
Data correspond to usage on the plateform after 2015. The current usage metrics is available 48-96 hours after online publication and is updated daily on week days.
Initial download of the metrics may take a while.