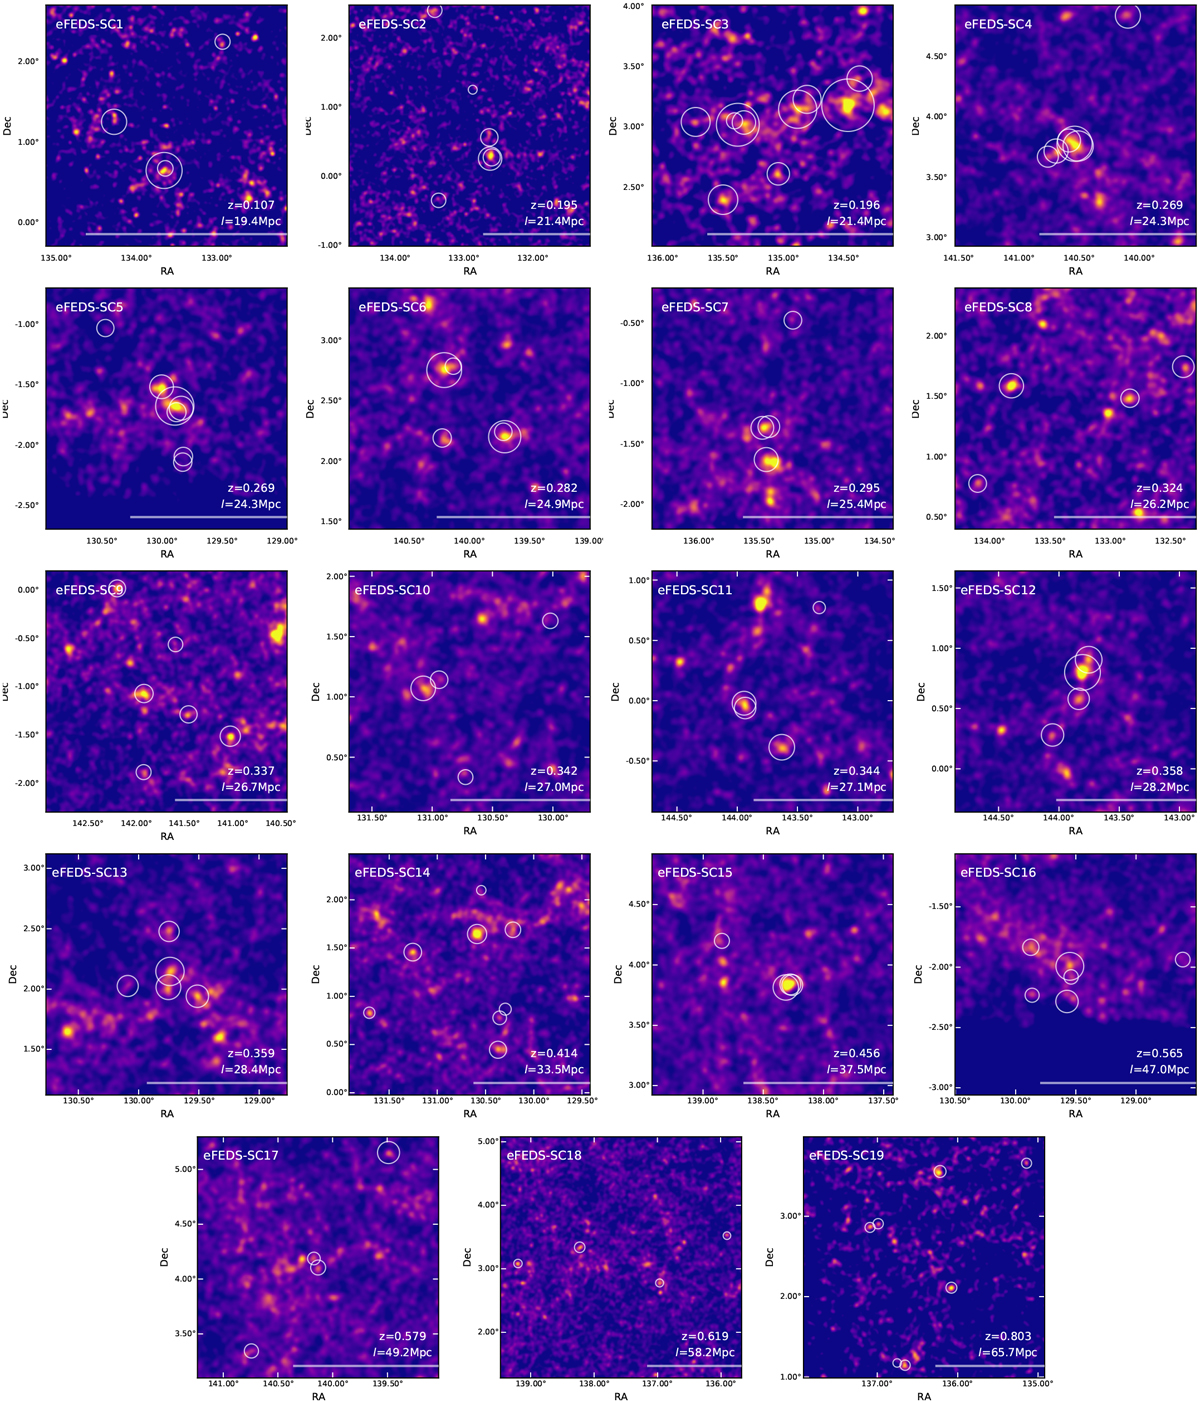
Fig. A.2
Download original image
Galaxy density map from HSC-SSP survey data at the locations and redshifts of the 19 supercluster candidates. They are obtained by integrating the full probability function of the MIZUKI (Tanaka 2015) photometric redshifts (P(z)) of each galaxy (the S19A catalog; Nishizawa et al. 2020) with a width of the redshift slice of ![]() , in a similar way as Okabe et al. (2021). The galaxies are brighter than 23 ABmag. The smoothing scale is FWHM= 3 arcmin.
, in a similar way as Okabe et al. (2021). The galaxies are brighter than 23 ABmag. The smoothing scale is FWHM= 3 arcmin.
Current usage metrics show cumulative count of Article Views (full-text article views including HTML views, PDF and ePub downloads, according to the available data) and Abstracts Views on Vision4Press platform.
Data correspond to usage on the plateform after 2015. The current usage metrics is available 48-96 hours after online publication and is updated daily on week days.
Initial download of the metrics may take a while.