Fig. 10
Download original image
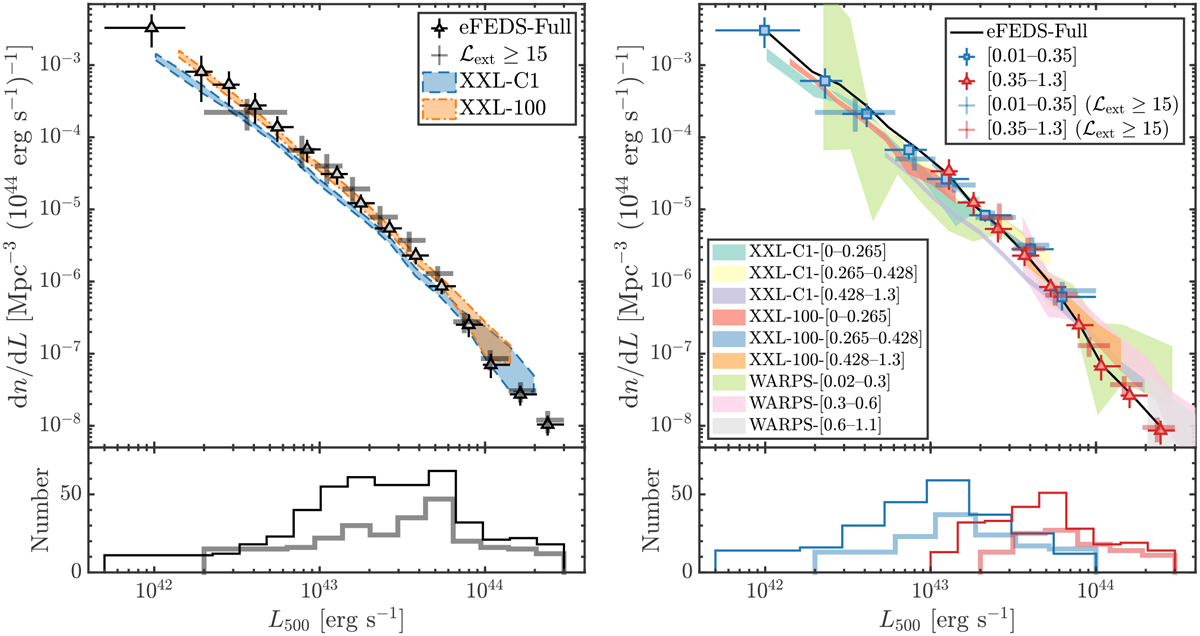
X-ray luminosity function of the eFEDS cluster sample. Left panel: results for the full sample. Right panel: results in two redshift bins. The number of clusters in each bin is indicated in the lower panel. Some literature results are plotted as the shaded area for comparison: XXL-C1 (Adami et al. 2018), XXL-100 (Pacaud et al. 2016), and WARPS (Koens et al. 2013). Thick error bars show the results of the ℒext ≥ 15 subsample.
Current usage metrics show cumulative count of Article Views (full-text article views including HTML views, PDF and ePub downloads, according to the available data) and Abstracts Views on Vision4Press platform.
Data correspond to usage on the plateform after 2015. The current usage metrics is available 48-96 hours after online publication and is updated daily on week days.
Initial download of the metrics may take a while.