| Issue |
A&A
Volume 660, April 2022
|
|
|---|---|---|
| Article Number | A7 | |
| Number of page(s) | 12 | |
| Section | Galactic structure, stellar clusters and populations | |
| DOI | https://doi.org/10.1051/0004-6361/202142492 | |
| Published online | 30 March 2022 | |
Stellar population astrophysics (SPA) with the TNG
The chemical content of the red supergiant population in the Perseus complex⋆,⋆⋆
1
Dipartimento di Fisica e Astronomia, Universitá degli Studi di Bologna, Via Piero Gobetti 93/2, 40129 Bologna, Italy
e-mail: This email address is being protected from spambots. You need JavaScript enabled to view it.
2
INAF-Osservatorio di Astrofisica e Scienza dello Spazio, Via Piero Gobetti 93/3, 40129 Bologna, Italy
3
INAF-Osservatorio Astrofisico di Arcetri, Largo Enrico Fermi 5, 50125 Firenze, Italy
Received:
20
October
2021
Accepted:
13
December
2021
Abstract
Context. The Perseus complex in the outer disk of the Galaxy hosts a number of clusters and associations of young stars. Gaia is providing a detailed characterization of their kinematic structure and evolutionary properties.
Aims. Within the SPA Large Program at the TNG, we secured HARPS-N and GIANO-B high-resolution optical and near-infrared (NIR) spectra of the young red supergiant (RSG) stars in the Perseus complex in order to obtain accurate radial velocities, stellar parameters, and detailed chemical abundances.
Methods. We used spectral synthesis to best fit hundreds of atomic and molecular lines in the spectra of the observed 27 RSGs. We obtained accurate estimates of the stellar temperature, gravity, micro- and macroturbulence velocities, and chemical abundances for 25 different elements. We also measured the 12C/13C abundance ratio.
Results. Our combined optical and NIR chemical study provides homogeneous half-solar iron with a low dispersion, about solar-scaled abundance ratios for the iron-peak, alpha-, and other light elements, and a low enhancement of Na, K, and neutron-capture elements. This is consistent with the thin-disk chemistry traced by older stellar populations at a similar galactocentric distance of about 10 kpc. We inferred an enhancement of N and a depletion of C and of the 12C/13C isotopic abundance ratio that are consistent with mixing processes in the stellar interiors during the RSG evolution.
Key words: techniques: spectroscopic / stars: abundances / stars: late-type / supergiants
Tables A.1–A3 are only available at the CDS via anonymous ftp to cdsarc.u-strasbg.fr (130.79.128.5) or via http://cdsarc.u-strasbg.fr/viz-bin/cat/J/A+A/660/A7
Based on observations made with the Italian Telescopio Nazionale Galileo (TNG) operated on the island of La Palma by the Fundación Galileo Galilei of the INAF (Istituto Nazionale di Astrofisica) at the Spanish Observatorio del Roque de los Muchachos of the Instituto de Astrofisica de Canarias. This study is part of the Large Program titled SPA - Stellar Population Astrophysics: the detailed, age-resolved chemistry of the Milky Way disk (PI: L. Origlia), granted observing time with HARPS-N and GIANO-B echelle spectrographs at the TNG.
© ESO 2022
1. Introduction
The full characterization of the young stellar populations in recently formed star clusters and associations within the Galaxy is of paramount importance for answering a number of open questions concerning the formation and early evolution of star clusters and associations and the recent star formation and chemical enrichment history of the Milky Way disk.
The Gaia mission of the European Space Agency (Gaia Collaboration 2016) is opening a new perspective in identifying and kinematically characterizing substructures in the inner and outer disk of the Galaxy. Follow-up spectroscopic observations at medium- to high-resolution provide complementary information about the detailed chemistry and line-of-sight radial velocities (RVs) of these regions.
The Perseus complex at a galactocentric distance of about 10 kpc hosts a number of young star clusters and associations. The densest structures are h,χ Per, NGC 457, NGC 654, and NGC 633. They are distributed within a projected area of approximately 10 degrees on sky. This region offers a unique opportunity to study the recent star formation and cluster-assembling processes in the outer disk.
Recently, de Burgos et al. (2020) provided a comprehensive kinematic study of the young Perseus OB-1 association by combining Gaia DR2 and high-resolution optical spectroscopy. They reported that most of the sampled blue and red supergiants located at d ≈ 2.5 ± 0.4 kpc share a common kinematics and are physically linked.
However, the detailed chemistry of this region is poorly constrained, and only a few measurements exist so far. High-resolution optical spectra for five B-type star members of NGC 457 (Dufton et al. 1994) provided carbon, oxygen, magnesium, and silicon abundances, indicating subsolar values of about −0.3 dex. The only exception is oxygen, which is enhanced by about 0.2 dex.
A photometric estimate of about solar metallicity for the h,χ double cluster has been suggested by Currie et al. (2010). However, photometric estimates of metallicity in general, and especially in the case of very young stellar populations, should be regarded only as indicative because isochrone fitting is not sufficiently sensitive to metallicity variations of a few tenths of a dex, and it also depends on the adopted age and model. For 11 red supergiant stars (RSGs) in the Perseus OB-1 associations, Gazak et al. (2014) used global spectral synthesis of a portion of the J-band spectrum and obtained rather warm temperatures in the 3700–4100 K range and about solar metallicites.
The TNG Large Program called SPA – Stellar Population Astrophysics: the detailed, age-resolved chemistry of the Milky Way disk (Program ID A37TAC_13, PI: L. Origlia) aims at measuring detailed chemical abundances and radial velocities of the luminous stellar populations of the Milky Way thin disk and its associated star clusters (Origlia et al. 2019). We performed a combined optical and near-infrared (NIR) spectroscopic screening at high resolution of the young stellar populations within the Perseus complex within this program.
We observed 84 luminous blue and red young stars that are candidate members of the Perseus complex according to their Gaia distances and proper motions. A first comprehensive study of the stellar kinematics and spectrophotometric properties from Gaia early data release 3 (eDR3) (Gaia Collaboration 2021) and SPA observations in the area surrounding h and χ Per double stellar cluster has been presented in Dalessandro et al. (2021). We found that the region is populated by seven comoving clusters, that is, h and χ Per, NGC 957, Basel 10, N1, N2, and N3, the latter three were previously unknown, and by an extended and quite massive halo, defining a complex structure that we named LISCA I. The kinematic and structural properties of LISCA I suggest that it might be forming a massive cluster (some 105 M⊙) through hierarchical assembly. Two other kinematics studies of the other young clusters and associations in the Perseus complex are ongoing.
This paper reports the detailed stellar parameters and chemical analysis of a sample of 27 red supergiant (RSG) stars distributed over the entire area of the Perseus complex. The RSG evolutionary phase for stars with progenitor masses in the 9–25 M⊙ range is quite short and mostly characterized by He-core burning at temperatures close to the Hayashi limit. Optical and NIR spectra of RSGs are very rich in absorption lines from many light and heavy metals of interest, enabling a detailed chemical screening of their pristine chemical composition as well as of possible modifications due to mixing processes in their interiors. Interestingly, RSGs hosted in the Perseus complex not only allow tracing the recent star formation history and chemical enrichment of this region, but also investigating their physical, chemical, and evolutionary properties in a metallicity regime in between that of the solar neighborhood and the Magellanic Clouds.
Observations and data reduction are described in Sect. 2, and the spectral analysis and the derived chemical abundances are presented in Sects. 3 and 4, respectively. We discuss the results and conclude in Sects. 5 and 6.
2. Observations and data reduction
High-resolution spectra for 84 young stars in the Persues complex have been simultaneously acquired with the TNG HARPS-N (Cosentino et al. 2014) and GIANO-B (Oliva et al. 2012a,b; Origlia et al. 2014) optical and NIR spectrographs, respectively, on November 3–5, 2018, and on November 6–12, 2019. HARPS-N covers the optical spectral range (3780−6910 Å) at a resolution R ∼ 115 000, and GIANO-B covers the NIR spectral range (9500−24500 Å) at a resolution R ∼ 50 000. The simultaneous observation with HARPS-N and GIANO-B (named the GIARPS configuration) uses a dychroic that splits the optical and NIR light, thus allowing the simultaneous feeding of the two spectrographs (Tozzi et al. 2016; Claudi et al. 2017). On-source integration times between 700 s and 3600 s, depending on the target brightness, were set to ensure a signal-to-noise ratio > 50 over the entire spectral range. GIANO-B spectra are the sum of pairs of subexposures of 300 s obtained by nodding-on-slit for an optimal subtraction of the background and other instrumental effects.
HARPS-N spectra were reduced by the instrument Data Reduction Software pipeline, and they were normalized using the code RASSINE1 (Cretignier et al. 2020). The GIANO-B spectra were reduced using the data reduction pipeline software GOFIO (Rainer et al. 2018), which processes calibration (darks, flats, and U-Ne lamps taken in daytime) and scientific frames. The main feature of GOFIO is the optimal spectral extraction and wavelength calibration based on a physical model of the spectrometer that accurately matches instrumental effects such as variable slit tilt and order curvature over the echellogram (Oliva et al. 2018). The data reduction package also includes bad-pixel and cosmic-ray removal, sky and dark subtraction, flat-field, and blaze correction. The GIANO-B spectra were also corrected for telluric absorption using the spectra of an O-type standard star taken at different air masses during the same night. The normalized spectra of the telluric standard taken at low and high air mass values were combined with different weights to match the depth of the telluric lines in the target spectra. The spectral regions with telluric transmission lower than 90% were excluded from the analysis, and the few intrinsic features of the O-stars that were used as telluric standards are broad lines of H and He that are easily recognisable and corrected using a Voigt fit. Figure 1 shows portions of the observed HARPS-N and the GIANO-B spectra for three representative RSGs we analyzed.
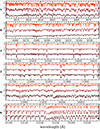 |
Fig. 1. Portion of the HARPS-N and GIANO-B spectra in the V, R, Y, J, H, and K bands for three representative RSGs observed in the Perseus complex. Spectra are corrected for telluric contamination and RV, and they are plotted in order of increasing stellar temperature from the bottom to the top. In each panel, the normalized spectra of the three stars are shifted by a constant. |
The RA-Dec map and the Gaia eDR3 color-magnitude diagram for the stars in the young stellar systems of the Perseus complex within a projected area of about 10 degrees on sky are shown in Fig. 2. Stars that were spectroscopically observed within the SPA Large Program are also highlighted. Stars were selected with distances and proper motions consistent with those of the young clusters and associations in the area. Among the 84 observed stars, we classified the 27 reddest stars in the sample as genunie RSGs, with MG < −3 or equivalently, Lbol > 3.9 L⊙. Three and seven RSGs in our sample are in common with Gazak et al. (2014) and de Burgos et al. (2020) samples, respectively. The other red stars in their samples were not first-priority targets in our list because they are significantly closer and/or extremely bright in the NIR and are at risk of saturation with GIANO-B (depending on the seeing and cloud conditions) or are extremely red.
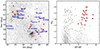 |
Fig. 2. RA-Dec map of the stars that are likely members of the Perseus complex young clusters and associations (gray dots), based on their distances and proper motions, within a projected area of about 10 degrees on sky (left). Black dots mark the 84 stars that were spectroscopically observed within the TNG-SPA Large Program, and red circles mark the 27 RSGs we studied. For reference, we also plot the main clusters in the region in blue. Gaia eDR3 CMD for the same stars as in the left panel (right). |
For the 27 RSGs we studied, Table 1 lists coordinates, Gaia-eDR3 and 2MASS photometry (Skrutskie et al. 2006), reddening, and bolometric luminosity. For each star, the reddening was estimated by interpolating the Schlegel et al. (1998) extinction maps and applying the corrections by Schlafly & Finkbeiner (2011). Bolometric luminosities were estimated by using the dereddened 2MASS K-band magnitudes and bolometric corrections as prescribed in Levesque et al. (2005).
Photometric information for the studied RSGs and derived stellar parameters and RVs.
3. Spectral analysis
We used spectral synthesis techniques to derive stellar parameters and chemical abundances for the observed 27 RSGs. Synthetic spectra were computed by using the radiative transfer code TURBOSPECTRUM (Alvarez & Plez 1998; Plez 2012) with MARCS models atmospheres (Gustafsson et al. 2008). For the chemical analysis of the cool RSGs, we compiled an optimized list of unblended and unsaturated atomic and molecular lines, initially selected by using the TurboSLine tool described in Fanelli et al. (2021) and subsequently confirmed by visual inspection. Optical lines in particular were selected in spectral regions that were free from significant CN and TiO contamination by visually inspecting observed and synthetic spectra. Normally, unsaturated, faint lines do not suffer from major nonlocal thermodynamic equilibrium (NLTE) effects because they tend to form quite deep in the atmosphere of cool stars.
The importance of using high-resolution spectra over a range as wide as possible from the optical to the NIR has been demonstrated in Fanelli et al. (2021), where a combined optical+NIR analysis of Arcturus has been performed. A wide spectral coverage has multiple advantages: (i) it allows maximizing the number of species that can be reliably measured; (ii) it provides multiple diagnostics of stellar parameters; (iii) it enables a number of sanity checks for a self-consistent derivation of stellar parameters and chemical abundances; and (iv) it enables a better physical comprehension of the systematic and degeneracy effects.
For the selected lines, we used the atomic data from VALD3 (Ryabchikova & Pakhomov 2015) and the most updated molecular data from the website of B. Plez2. Tables A.1–A.3 provide the complete list of optical and NIR atomic and molecular lines we used for the chemical abundance analysis.
The synthetic spectra were convolved with a Gaussian function in order to reproduce the observed line broadening. To derive the chemical abundances, we used SALVADOR, a tool developed by A. Mucciarelli (priv. comm.) that performs a χ2 minimization between observed and synthetic spectra. For each line, the normalization of the observed spectra was optimized interactively. Accurate (at better than 1 km s−1) heliocentric radial velocities for the observed stars were obtained by means of a standard cross-correlation technique (Tonry & Davis 1979) between observed and synthetic spectra with stellar parameters appropriate to fit the studied RSGs.
Stellar parameters for the observed stars are listed in Table 1. Effective temperatures were obtained by minimizing the difference between carbon abundances derived from atomic C I and molecular CO lines, the so-called C-thermometer (Fanelli et al. 2021), with an average uncertainty of about 80 − 100 K and a temperature range between 3400 and 4200 K. These spectroscopic temperatures also allow the minimization of any trend between iron abundances and excitation potentials of the optical and NIR lines, as shown in Fig. 3, although this diagnostic is only moderately sensitive at the low RSG temperatures.
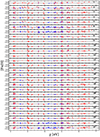 |
Fig. 3. Iron abundances from different optical (blue) and NIR (red) lines as a function of the excitation potential for the RSGs in the Perseus complex. Circles indicate neutral lines, and dots show single-ionized lines. |
Surface gravities were obtained by assuming an average stellar mass of 11 M⊙, according to their young ages in the 15 − 30 Myr range (see Currie et al. 2010; Dalessandro et al. 2021), and using the standard formula
 (1)
(1)
where G is the gravitational constant, σSF is the Stefan–Boltzmann constant, M is the mass of the star, and LBol is the bolometric luminosity. We found log(g) values ranging from −0.40 to +1.00 dex, with an overall uncertainty of ≈0.15 dex. A variation of ±2 M⊙ for the adopted mass has little impact (less than 0.1 dex) on the derived gravity.
Microturbulence was derived by using the standard approach of minimizing the slope between the iron abundance and the reduced equivalent width (EW) of the measured lines, defined as log10(EW/λ). Values in the 2–4 km s−1 range were obtained, with a typical uncertainty of ∼0.2 km s−1.
The line profiles of the observed stars are broader than the instrumental line profile (as determined from telluric lines). This additional broadening is likely due to macroturbulence and is normally modeled with a Gaussian profile, as for the instrumental broadening. Macroturbulence velocities in the 8 − 13 km s−1 range were inferred. As expected for these evolved stars, we did not find any appreciable line broadening due to stellar rotation.
The modeling of the post-MS evolution of massive stars is very complex and depends on the assumed molecular opacities, on the geometry of the atmospheres, and on the recipes for the treatment of convection, mass loss, rotation and so on as a function of the stellar mass and metallicity (see, e.g., the discussion in Bertelli et al. 2009, and references therein). Although a detailed tuning of model predictions with measured values is beyond the scope of this paper, we took advantage of our homogeneous sample of 27 RSGs in the Perseus complex to attempt a qualitative comparison. By using the inferred temperatures and bolometric magnitudes quoted in Table 1, we constructed the Hertzsprung–Russel (HR) diagram of Fig. 4. The location of the 27 RSGs is qualitatively matched by theoretical evolutionary tracks of massive (≳9 M⊙) stars, such as those from the PARSEC models (Bressan et al. 2012), although it seems that the latter can reach sufficiently high luminosities and low temperatures to match the location of the coolest RSGs only after the He-core burning, that is, during the faster phases of shell He-burning or core C-burning.
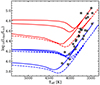 |
Fig. 4. HR diagram for the 27 RSGs. The evolutionary tracks of 9 M⊙ (blue lines) and 14 M⊙ (red lines) for half-solar metallicity (solid lines) and solar metallicity (dashed lines) from the PARSEC models (Bressan et al. 2012) are overplotted for comparison. |
4. Chemical abundances
Chemical abundances for 23 species were derived from more than 200 atomic and molecular lines in the NIR. Their values and corresponding measurement errors are listed in Tables 2 and 3.
CNO, F, Na, Al, K and alpha element abundances for the studied RSGs in the Perseus complex.
Iron, iron-peak and neutron-capture element abundances for the studied RSGs in the Perseus complex.
Iron abundances were derived from 40–60 NIR lines of Fe I. The scatter from different lines is typically 0.15 dex. From the 27 RSGs, we measured an average [Fe/H] = −0.30 ± 0.01 dex with a dispersion σ = 0.03 ± 0.01 dex. For the other iron-peak elements, up to 20 NIR lines of Cr I were used to derive the chromium abundance, while a few lines were used to derived abundances of V I, Mn I, Co I, Ni I, and Cu I. The V I, Mn I, and Co I lines have hyperfine structure (HFS).
Zinc abundances were obtained only for the warmest K-type RSGs from the measurement of two NIR Zn I lines. The iron-peak elements homogeneously scale as iron within ±0.1 dex. Dozens of unblended lines of Si I, Ca I, Ti I, and Mg I and a few lines of Na I, Al I, S I, K I, and Sc I (the latter with HFS) were measured for each species, also providing about solar-scaled abundances with the possible exception of Na and K, which is mildly enhanced with respect to the solar-scaled value. In particular, average [Na/Fe] = +0.18 ± 0.10 with σ = 0.10 ± 0.01 and [K/Fe] = +0.10 ± 0.10 with σ = 0.10 ± 0.01 dex were obtained. The measurement of two lines of Y I and Ce II and one line of Dy II (r-process element) provided solar-scaled [Y/Fe] and slightly enhanced [Dy/Fe] and [Ce/Fe] abundance ratios. In particular, we found an average [Dy/Fe] = +0.08 ± 0.10 with σ= 0.09 ± 0.01 and [Ce/Fe] = +0.17 ± 0.10 with σ= 0.12 ± 0.01 dex.
CNO abundances were derived from a few dozen molecular 12CO, CN and OH lines, respectively. Following Ryde et al. (2009) and Smith et al. (2013), we adopted an iterative method to derive CNO abundances in order to consider the interplay of these three elements in setting the molecular equilibrium. We found a depletion of carbon and an enhancement of nitrogen with respect to the solar-scaled values, especially in the case of the coolest RSGs, while the oxygen abundance is about solar-scaled. In particular, we obtained an average [C/Fe] = −0.20 ± 0.01 dex with a small dispersion of 0.06 ± 0.01 dex and [N/Fe] = +0.36 ± 0.03 and a dispersion of 0.16 ± 0.02 dex. It is interesting to note that the carbon abundance derived from the Δv = 312CO band-heads in the H band is fully consistent with the one derived from individual 12CO rotovibrational transitions. We used the Δv = 3 and Δv = 2 band-heads of 13CO in the H and K bands, respectively, to also estimate the 13C abundance and the 12C/13C isotopic abundance ratio, which lies between 20 and 30 in the K-type RSGs and below 12 in the M-type RSGs. An average value of 12C/13C = 13.3 ± 1.2 with a dispersion σ = 6.1 ± 0.8 was obtained. Slightly subsolar values for the fluorine abundance, with an average [F/Fe] = −0.20 ± 0.10 and σ = 0.17 ± 0.02 dex, were obtained by measuring the HF molecular line at 23358.33 Å in the K band and using the transition parameters of Jönsson et al. (2014).
Notably, despite the low temperatures and gravities of the analyzed RSGs, chemical abundances for 19 species were also derived from more than 100 optical atomic lines. Their values and corresponding measurement errors are listed in Tables 2 and 3. All the chemical elements measured in the optical are in common with those measured in the NIR, with the exception of Zr and Nd, and the derived chemical abundances from the two datasets are fully consistent with each other within the errors, as also shown in Fig. 5. Interestingly, in the optical, the iron abundance was derived from a few dozen neutral and a few single-ionized lines, while oxygen was measured only in the warmest K giants, where TiO contamination is minimum. For Na I, we used only the doublet at 6154.226 and 6160.747 Å because it is only marginally affected by NLTE effects, with ≤0.1 dex negative corrections (Mashonkina et al. 2000; Lind et al. 2011; Alexeeva et al. 2014). This doublet provides sodium abundances consistent with those derived from the three selected lines in the NIR at 10746.449 Å, 16388.850 Å (partially blended with a Ni I line at 16388.729 Å), and at 21452.373 Å. For the coolest stars, the TiO and CN contamination is so severe that only a few Mg, Fe I, Fe II, Cr I, Ce II, and Nd II lines were measured.
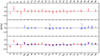 |
Fig. 5. Derived [X/Fe] abundance ratios for the RSGs in the Perseus complex from the NIR (top panel, red symbols) and optical (central panel, blue symbols). Bottom panel: the average [X/Fe] for each element for NIR (red symbols) and optical (blue symbols) with the average error bars. Values are solar-scaled according to the Grevesse & Sauval (1998) solar reference, except for oxygen, for which we used Asplund et al. (2009). |
We also consistently inferred about solar-scaled values from the optical lines for the majority of the measured elements, including Zr, which was not measured in the NIR, and the slight enhancement of Na, Y, Dy, Ce, and Nd (not measured in the NIR). The measurement errors quoted in Tables 2 and 3 include the uncertainty in the continuum positioning and photon noise and correspond to the 1σ dispersion divided by the square root of the number of used lines. For elements with more than two measurable lines, we computed the dispersion around the mean abundance, while for those with one or two measurable lines, we assumed an error of 0.1 dex.
Abundance errors from uncertainties in the stellar parameters (see Sect. 3) were estimated by computing elemental abundances with varying Teff by ±100 K, log(g) by ±0.15 dex, and ξ by ±0.2 km s−1. Typically, the impact of these uncertainties on the estimated abundances is within 0.10–0.15 dex for all the species. The exception is nitrogen from CN lines, for which it can increase to 0.2 dex. We did not include the interdependence between the C, N, and O abundances when we computed the errors. They contribute to the formation of the measured molecular lines. We estimate that this effect yields abundance errors below 0. dex for C and O, while for N, the errors can be as high as 0.2–0.3 dex (see also Ryde et al. 2009). We also neglect the effect of the abundances of the main electron donors on those derived from ionized species. However, we estimate that this effect yields abundance errors below 0.1 dex for all the species.
5. Discussion
The 27 RSGs in the Perseus complex provide a half-solar iron abundance on average. This value fits within the metallicity distribution of older dwarf and giant stars (see, e.g., Reddy et al. 2003; Hayden et al. 2014; Mikolaitis et al. 2014, 2019) at a similar galactocentric distance of about 10 kpc, which may imply inflows of metal-poor gas as the origin of the subsolar metallicity in this young stellar population. However, the dispersion in metallicity of the measured RSGs in the Perseus complex is significantly lower than the typical values of 0.15 − 0.20 dex measured in the thin disk. This chemical homogeneity reinforces the suggestion by Dalessandro et al. (2021), based on the comoving kinematics of the LISCA I stellar substructures, that we may have caught an ongoing process of hierarchical cluster assembly.
For the three stars in common with the study of Gazak et al. (2014), we inferred spectroscopic temperatures that are systematically about 300–400 K cooler than in Gazak et al. (2014) and agree within about 100 K with those of Levesque et al. (2005), and 0.1–0.3 dex lower metallicities. We also measured some depletion of [C/Fe] and enhancement of [N/Fe] compared to the solar-scaled values adopted by Gazak et al. (2014). The warm temperatures, about solar metallicity and solar-scaled CNO abundances quoted by Gazak et al. (2014) cannot provide a reasonable, simultaneous fit of the CO, OH, CN, and TiO molecular absorptions observed in our HARPS-N and GIANO-B spectra of the three RSGs in common. Global spectral synthesis in the J band alone, as used by Gazak et al. (2014), may be not sufficiently adequate to simultaneously measure stellar parameters and global metallicity of complex atmospheres like those of RSGs because the resulting estimates are likely affected by degeneracy and systematics. In order to mitigate them, a wide NIR spectral coverage and self-consistent determination of CNO abundances are especially critical requirements.
About solar-scaled [X/Fe] abundance ratios for most of the elements were measured. This is consistent with the hypothesis that RSGs are a thin-disk population. However, we also found deviations (between 0.1 and 0.2 dex on average) from solar-scaled abundance ratios for some elements, suggesting possible peculiarities in the recent enrichment of the thin disk by AGB and/or Wolf-Rayet stars within the Perseus complex. In particular, we measured an average mild depletion of [F/Fe] and enhancement of [K/Fe] and [Na/Fe] light elements, which is at variance with the solar-scaled value of [Al/Fe] and [α/Fe] elements. We also measured a mild enhancement of [Ce/Fe] and [Nd/Fe] heavy-s process elements, which is at variance with the solar-scaled value of the [Y/Fe] light s-process element.
Depletion of carbon and of the 12C/13C isotopic abundance ratio and a corresponding enhancement of N with respect to the solar scaled values were also measured in the 27 RSGs. This is consistent with mixing processes in the stellar interiors, which modify the surface abundances of these elements during the post-MS evolution. Stars with a progenitor mass in the 9–14 M⊙ range, such as the RSGs in the Perseus complex, are indeed expected to have already undergone substantial mixing from the first dredge-up when they evolve into the RSG phase.
Figure 6 shows the trend of [C/Fe], [N/Fe], and [C/N] abundance ratios with varying bolometric luminosity and effective temperature. The rather homogeneous carbon depletion with mild (if any) dependence on stellar luminosity and temperature is at variance with the amount of nitrogen enhancement, which shows a clear trend with stellar parameters. In particular, [N/Fe] increases with increasing luminosity and decreasing temperature. A corresponding higher degree of [C/N] depletion with increasing luminosity and decreasing temperature was derived, with an average value of [C/N] = −0.56 ± 0.04 dex and a dispersion of σ = 0.20 ± 0.03 dex.
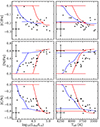 |
Fig. 6. [C/Fe], [N/Fe], and [C/N] abundance ratios as a function of the stellar luminosity (left panels) and temperature (right panels) for the 27 RSGs in the Perseus complex. Values are solar-scaled according to the Grevesse & Sauval (1998) solar reference. Typical error bars are reported in the left upper or lower corner of each panel. For comparison, the PARSEC model predictions for a 9 M⊙ (blue lines) and a 14 M⊙ (red lines) star are also plotted. |
Different stellar evolution models (see, e.g., Bertelli et al. 2009; Bressan et al. 2012; Georgy et al. 2013; Chieffi & Limongi 2013; Choi et al. 2016; Davies & Dessart 2019) predict C depletion by about 0.2 dex after the first dredge-up, which agrees well with the measured values. Models also predict N enhancement by about 0.5–0.6 dex after the first dredge-up. Only the most luminous and coolest RSGs in our sample show such a nitrogen enhancement, while most of them show [N/Fe] values that increase from 0.1 to 0.4 dex with increasing luminosity and decreasing temperature. Models also predict a corresponding [C/N] depletion of 0.70–0.80 dex after the first dredge-up, as measured only in the most luminous, coolest RSGs of our sample. This may suggest that N enhancement is more dependent on the stellar mass than the C depletion (see also Davies & Dessart 2019).
As shown in Fig. 7, we also measured the 12C/13C isotopic ratio in all the 27 RSGs we analyzed, finding values that progressively decreases from a few dozen to below ten with increasing luminosity and decreasing temperature. Only the warmest RSGs show isotopic ratios above 15, as predicted by the majority of models after the first dredge-up, while most of the RSGs with Teff < 3800 K show values below 10. This may require some additional mixing to explain the results. Only the Choi et al. (2016) models can possibly reach values as low as 5–10. We also find a nice correlation between the depletion of 12C/13C and of [C/N].
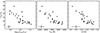 |
Fig. 7. 12C/13C ratio as a function of bolometric luminosity (left panel), effective temperature (central panel), and [C/N] abundance ratio. Typical error bars are reported in the left lower corner of each panel. |
6. Conclusions
For the first time, a combined high-resolution optical and NIR chemical analysis of RSGs has been provided. It provided an excellent agreement between optical and NIR abundances for all the elements in common. Our study has shown the effectiveness of RSGs of K and M spectral types in tracing the detailed chemistry and recent enrichment of their host, by providing a comprehensive characterization of the chemistry of the young stellar populations in the Perseus complex in the outer Galaxy disk.
The availability of high-resolution spectra with a high signal-to-noise ratio in the Y, J, H, and K NIR bands has been crucial for this purpose to derive accurate stellar parameters and chemical abundances for the full set of iron, iron-peak, CNO, alpha- and other light and neutron-capture elements. In particular, we used the abundances for Na, Mg, Al, Si, S, K, Ca, Sc, Ti, V, Cr, Mn, Fe, Co, Ni, Cu, Zn, Y, Ce, Dy from atomic lines and C, N, O and F from molecular lines.
Despite the low temperatures and gravities of RSGs, optical spectra in a few selected windows that are less affected by molecular blending and blanketing can also provide some lines for the chemical analysis of a subset of elements, namely O, Na, Mg, Al, Si, Ca, Sc, Ti, V, Cr, Mn, Fe, Co, Ni, Y, Ce, and Dy, and for two neutron-capture elements, namely Zr and Nd, which are not easily derivable from the few available IR lines, which are either blended in these cool stars or have uncertain atomic parameters.
When coupled with kinematic information (line-of-sight radial velocities and proper motions), this detailed chemical screening can enable a consistent chemodynamical modeling and a comprehensive description of modes and timescales of star formation, dynamical interactions, and chemical enrichment of the region. This study can also represent an interesting observational test bench for probing models of stellar evolution, nucleosynthesis, and internal mixing in the critical RSG evolutionary phase for stars at half-solar metallicity.
Acknowledgments
We thank the anonymous referee for his/her detailed report and useful comments and suggestions. We acknowledge the support by INAF/Frontiera through the “Progetti Premiali” funding scheme of the Italian Ministry of Education, University, and Research. We acknowledge support from the project Light-on-Dark granted by MIUR through PRIN2017-000000 contract and support from the mainstream project SC3K – Star clusters in the inner 3 kpc funded by INAF.
References
- Alexeeva, S. A., Pakhomov, Y. V., & Mashonkina, L. I. 2014, Astron. Lett., 40, 406 [NASA ADS] [CrossRef] [Google Scholar]
- Alvarez, R., & Plez, B. 1998, A&A, 330, 1109 [NASA ADS] [Google Scholar]
- Asplund, M., Grevesse, N., Sauval, A. J., & Scott, P. 2009, ARA&A, 47, 481 [NASA ADS] [CrossRef] [Google Scholar]
- Bertelli, G., Nasi, E., Girardi, L., & Marigo, P. 2009, A&A, 508, 355 [NASA ADS] [CrossRef] [EDP Sciences] [Google Scholar]
- Bressan, A., Marigo, P., Girardi, L., et al. 2012, MNRAS, 427, 127 [NASA ADS] [CrossRef] [Google Scholar]
- Chieffi, A., & Limongi, M. 2013, ApJ, 764, 21 [Google Scholar]
- Choi, J., Dotter, A., Conroy, C., et al. 2016, ApJ, 823, 102 [Google Scholar]
- Claudi, R., Benatti, S., Carleo, I., et al. 2017, Eur. Phys. J. Plus, 132, 364 [NASA ADS] [CrossRef] [Google Scholar]
- Cosentino, R., Lovis, C., Pepe, F., et al. 2014, in Ground-based and Airborne Instrumentation for Astronomy V, eds. S. K. Ramsay, I. S. McLean, & H. Takami, SPIE Conf. Ser., 9147, 91478C [Google Scholar]
- Cretignier, M., Francfort, J., Dumusque, X., Allart, R., & Pepe, F. 2020, A&A, 640, A42 [NASA ADS] [CrossRef] [EDP Sciences] [Google Scholar]
- Currie, T., Hernandez, J., Irwin, J., et al. 2010, ApJS, 186, 191 [NASA ADS] [CrossRef] [Google Scholar]
- Dalessandro, E., Varri, A. L., Tiongco, M., et al. 2021, ApJ, 909, 90 [NASA ADS] [CrossRef] [Google Scholar]
- Davies, B., & Dessart, L. 2019, MNRAS, 483, 887 [NASA ADS] [CrossRef] [Google Scholar]
- de Burgos, A., Simon-Díaz, S., Lennon, D. J., et al. 2020, A&A, 643, A116 [NASA ADS] [CrossRef] [EDP Sciences] [Google Scholar]
- Dufton, P. L., Fitzsimmons, A., & Rolleston, W. R. J. 1994, A&A, 286, 449 [NASA ADS] [Google Scholar]
- Fanelli, C., Origlia, L., Oliva, E., et al. 2021, A&A, 645, A19 [NASA ADS] [CrossRef] [EDP Sciences] [Google Scholar]
- Gaia Collaboration (Prusti, T., et al.) 2016, A&A, 595, A1 [NASA ADS] [CrossRef] [EDP Sciences] [Google Scholar]
- Gaia Collaboration (Brown, A. G. A., et al.) 2021, A&A, 649, A1 [NASA ADS] [CrossRef] [EDP Sciences] [Google Scholar]
- Gazak, J. Z., Davies, B., Kudritzki, R., Bergemann, M., & Plez, B. 2014, ApJ, 788, 58 [NASA ADS] [CrossRef] [Google Scholar]
- Georgy, C., Ekström, S., Granada, A., et al. 2013, A&A, 553, A24 [NASA ADS] [CrossRef] [EDP Sciences] [Google Scholar]
- Grevesse, N., & Sauval, A. J. 1998, Space Sci. Rev., 85, 161 [Google Scholar]
- Gustafsson, B., Edvardsson, B., Eriksson, K., et al. 2008, A&A, 486, 951 [NASA ADS] [CrossRef] [EDP Sciences] [Google Scholar]
- Hayden, M. R., Holtzman, J. A., Bovy, J., et al. 2014, AJ, 147, 116 [NASA ADS] [CrossRef] [Google Scholar]
- Jönsson, H., Ryde, N., Harper, G. M., et al. 2014, A&A, 564, A122 [NASA ADS] [CrossRef] [EDP Sciences] [Google Scholar]
- Levesque, E. M., Massey, P., Olsen, K. A. G., et al. 2005, ApJ, 628, 973 [Google Scholar]
- Lind, K., Asplund, M., Barklem, P. S., & Belyaev, A. K. 2011, A&A, 528, A103 [NASA ADS] [CrossRef] [EDP Sciences] [Google Scholar]
- Mashonkina, L. I., Shimanskiĭ, V. V., & Sakhibullin, N. A. 2000, Astron. Rep., 44, 790 [NASA ADS] [CrossRef] [Google Scholar]
- Mikolaitis, Š., Hill, V., Recio-Blanco, A., et al. 2014, A&A, 572, A33 [NASA ADS] [CrossRef] [EDP Sciences] [Google Scholar]
- Mikolaitis, Š., Drazdauskas, A., Minkevičiūtė, R., et al. 2019, A&A, 628, A49 [EDP Sciences] [Google Scholar]
- Oliva, E., Biliotti, V., Baffa, C., et al. 2012a, Proc. SPIE, 8453, 84532T [NASA ADS] [CrossRef] [Google Scholar]
- Oliva, E., Origlia, L., Maiolino, R., et al. 2012b, Proc. SPIE, 8446, 84463T [NASA ADS] [CrossRef] [Google Scholar]
- Oliva, E., Sanna, N., Rainer, M., et al. 2018, Proc. SPIE, 10702, 1070274 [Google Scholar]
- Origlia, L., Oliva, E., Baffa, C., et al. 2014, Proc. SPIE, 9147, 91471E [Google Scholar]
- Origlia, L., Dalessandro, E., Sanna, N., et al. 2019, A&A, 629, A117 [NASA ADS] [CrossRef] [EDP Sciences] [Google Scholar]
- Plez, B. 2012, Turbospectrum: Code for Spectral Synthesis [Google Scholar]
- Rainer, M., Harutyunyan, A., Carleo, I., et al. 2018, Proc. SPIE, 10702, 1070266 [NASA ADS] [Google Scholar]
- Reddy, B. E., Tomkin, J., Lambert, D. L., & Allende Prieto, C. 2003, MNRAS, 340, 304 [Google Scholar]
- Ryabchikova, T., & Pakhomov, Y. 2015, Baltic Astron., 24, 453 [NASA ADS] [Google Scholar]
- Ryde, N., Edvardsson, B., Gustafsson, B., et al. 2009, A&A, 496, 701 [NASA ADS] [CrossRef] [EDP Sciences] [Google Scholar]
- Schlafly, E. F., & Finkbeiner, D. P. 2011, ApJ, 737, 103 [Google Scholar]
- Schlegel, D. J., Finkbeiner, D. P., & Davis, M. 1998, ApJ, 500, 525 [Google Scholar]
- Skrutskie, M. F., Cutri, R. M., Stiening, R., et al. 2006, AJ, 131, 1163 [NASA ADS] [CrossRef] [Google Scholar]
- Smith, V. V., Cunha, K., Shetrone, M. D., et al. 2013, ApJ, 765, 16 [Google Scholar]
- Tonry, J., & Davis, M. 1979, AJ, 84, 1511 [Google Scholar]
- Tozzi, A., Oliva, E., Iuzzolino, M., et al. 2016, Proc. SPIE, 9908, 99086C [Google Scholar]
All Tables
Photometric information for the studied RSGs and derived stellar parameters and RVs.
CNO, F, Na, Al, K and alpha element abundances for the studied RSGs in the Perseus complex.
Iron, iron-peak and neutron-capture element abundances for the studied RSGs in the Perseus complex.
All Figures
|
Fig. 1. Portion of the HARPS-N and GIANO-B spectra in the V, R, Y, J, H, and K bands for three representative RSGs observed in the Perseus complex. Spectra are corrected for telluric contamination and RV, and they are plotted in order of increasing stellar temperature from the bottom to the top. In each panel, the normalized spectra of the three stars are shifted by a constant. |
| In the text | |
|
Fig. 2. RA-Dec map of the stars that are likely members of the Perseus complex young clusters and associations (gray dots), based on their distances and proper motions, within a projected area of about 10 degrees on sky (left). Black dots mark the 84 stars that were spectroscopically observed within the TNG-SPA Large Program, and red circles mark the 27 RSGs we studied. For reference, we also plot the main clusters in the region in blue. Gaia eDR3 CMD for the same stars as in the left panel (right). |
| In the text | |
|
Fig. 3. Iron abundances from different optical (blue) and NIR (red) lines as a function of the excitation potential for the RSGs in the Perseus complex. Circles indicate neutral lines, and dots show single-ionized lines. |
| In the text | |
|
Fig. 4. HR diagram for the 27 RSGs. The evolutionary tracks of 9 M⊙ (blue lines) and 14 M⊙ (red lines) for half-solar metallicity (solid lines) and solar metallicity (dashed lines) from the PARSEC models (Bressan et al. 2012) are overplotted for comparison. |
| In the text | |
|
Fig. 5. Derived [X/Fe] abundance ratios for the RSGs in the Perseus complex from the NIR (top panel, red symbols) and optical (central panel, blue symbols). Bottom panel: the average [X/Fe] for each element for NIR (red symbols) and optical (blue symbols) with the average error bars. Values are solar-scaled according to the Grevesse & Sauval (1998) solar reference, except for oxygen, for which we used Asplund et al. (2009). |
| In the text | |
|
Fig. 6. [C/Fe], [N/Fe], and [C/N] abundance ratios as a function of the stellar luminosity (left panels) and temperature (right panels) for the 27 RSGs in the Perseus complex. Values are solar-scaled according to the Grevesse & Sauval (1998) solar reference. Typical error bars are reported in the left upper or lower corner of each panel. For comparison, the PARSEC model predictions for a 9 M⊙ (blue lines) and a 14 M⊙ (red lines) star are also plotted. |
| In the text | |
|
Fig. 7. 12C/13C ratio as a function of bolometric luminosity (left panel), effective temperature (central panel), and [C/N] abundance ratio. Typical error bars are reported in the left lower corner of each panel. |
| In the text | |
Current usage metrics show cumulative count of Article Views (full-text article views including HTML views, PDF and ePub downloads, according to the available data) and Abstracts Views on Vision4Press platform.
Data correspond to usage on the plateform after 2015. The current usage metrics is available 48-96 hours after online publication and is updated daily on week days.
Initial download of the metrics may take a while.