Free Access
Fig. 4.
Download original image
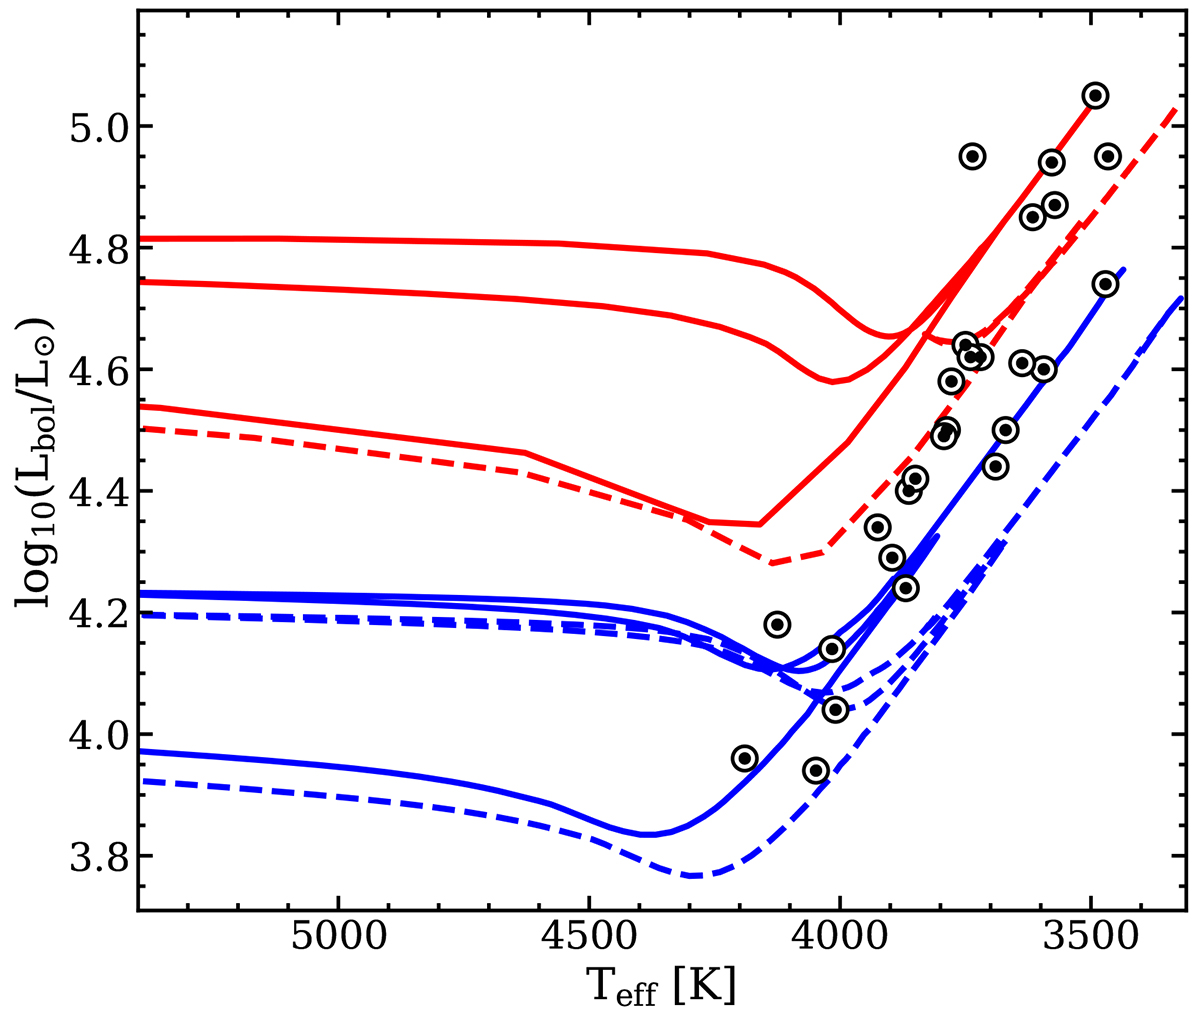
HR diagram for the 27 RSGs. The evolutionary tracks of 9 M⊙ (blue lines) and 14 M⊙ (red lines) for half-solar metallicity (solid lines) and solar metallicity (dashed lines) from the PARSEC models (Bressan et al. 2012) are overplotted for comparison.
Current usage metrics show cumulative count of Article Views (full-text article views including HTML views, PDF and ePub downloads, according to the available data) and Abstracts Views on Vision4Press platform.
Data correspond to usage on the plateform after 2015. The current usage metrics is available 48-96 hours after online publication and is updated daily on week days.
Initial download of the metrics may take a while.