Fig. 6.
Download original image
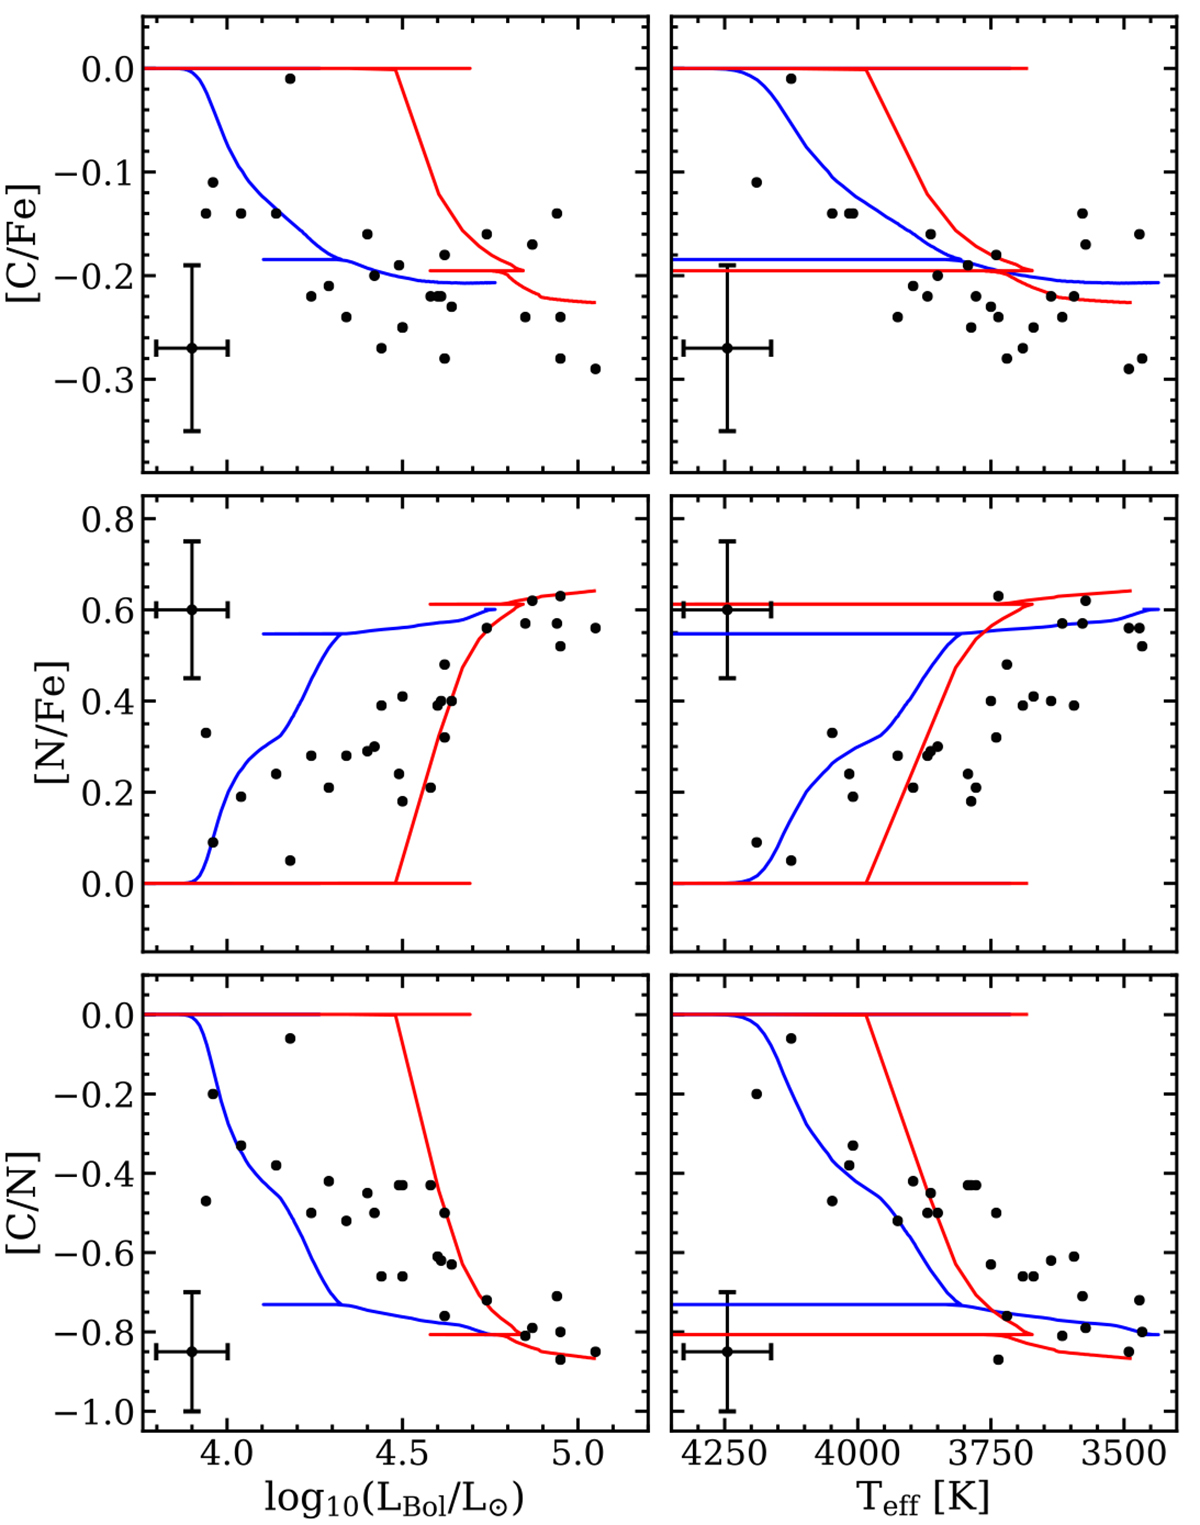
[C/Fe], [N/Fe], and [C/N] abundance ratios as a function of the stellar luminosity (left panels) and temperature (right panels) for the 27 RSGs in the Perseus complex. Values are solar-scaled according to the Grevesse & Sauval (1998) solar reference. Typical error bars are reported in the left upper or lower corner of each panel. For comparison, the PARSEC model predictions for a 9 M⊙ (blue lines) and a 14 M⊙ (red lines) star are also plotted.
Current usage metrics show cumulative count of Article Views (full-text article views including HTML views, PDF and ePub downloads, according to the available data) and Abstracts Views on Vision4Press platform.
Data correspond to usage on the plateform after 2015. The current usage metrics is available 48-96 hours after online publication and is updated daily on week days.
Initial download of the metrics may take a while.