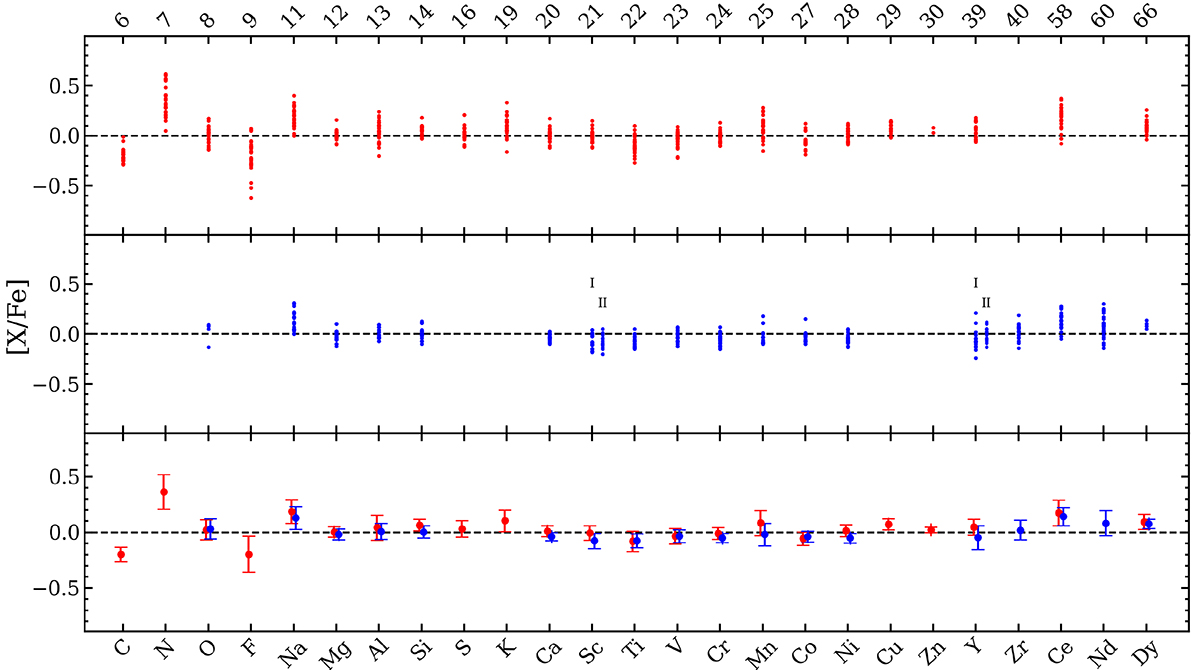
Fig. 5.
Download original image
Derived [X/Fe] abundance ratios for the RSGs in the Perseus complex from the NIR (top panel, red symbols) and optical (central panel, blue symbols). Bottom panel: the average [X/Fe] for each element for NIR (red symbols) and optical (blue symbols) with the average error bars. Values are solar-scaled according to the Grevesse & Sauval (1998) solar reference, except for oxygen, for which we used Asplund et al. (2009).
Current usage metrics show cumulative count of Article Views (full-text article views including HTML views, PDF and ePub downloads, according to the available data) and Abstracts Views on Vision4Press platform.
Data correspond to usage on the plateform after 2015. The current usage metrics is available 48-96 hours after online publication and is updated daily on week days.
Initial download of the metrics may take a while.