Free Access
Fig. 3.
Download original image
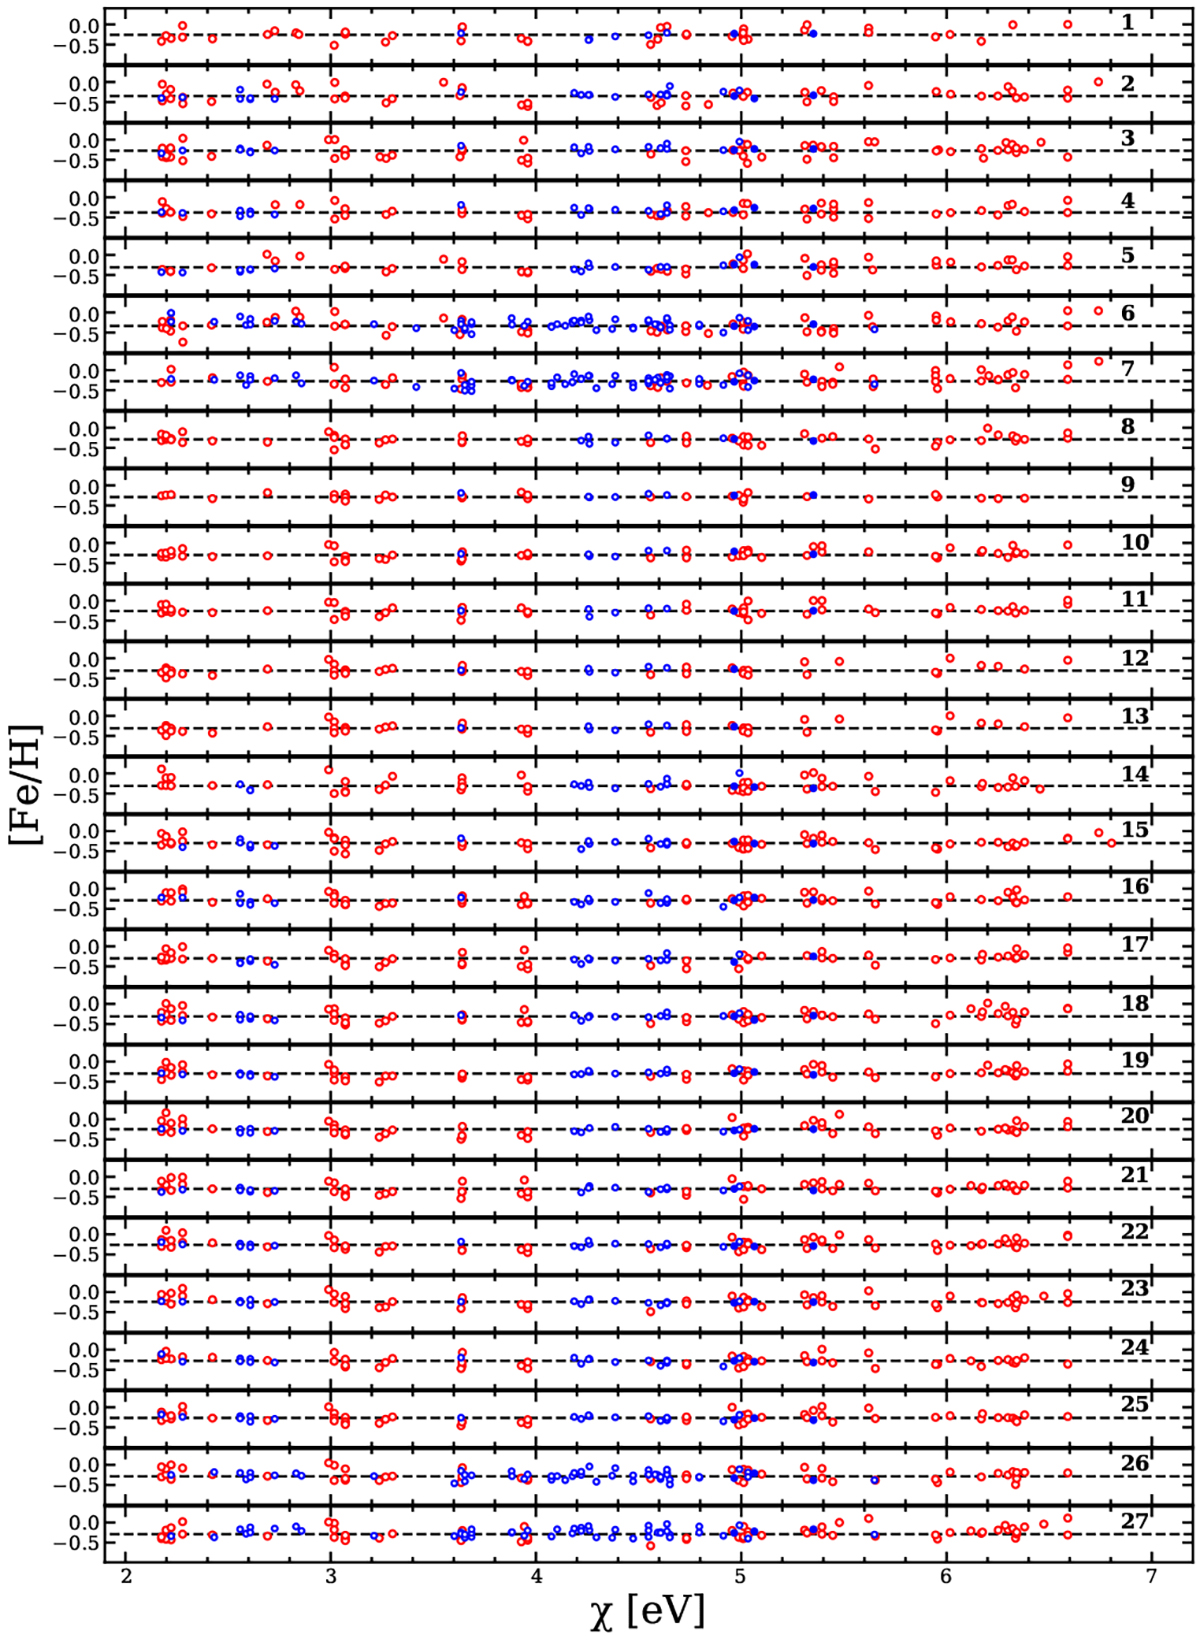
Iron abundances from different optical (blue) and NIR (red) lines as a function of the excitation potential for the RSGs in the Perseus complex. Circles indicate neutral lines, and dots show single-ionized lines.
Current usage metrics show cumulative count of Article Views (full-text article views including HTML views, PDF and ePub downloads, according to the available data) and Abstracts Views on Vision4Press platform.
Data correspond to usage on the plateform after 2015. The current usage metrics is available 48-96 hours after online publication and is updated daily on week days.
Initial download of the metrics may take a while.