| Issue |
A&A
Volume 659, March 2022
|
|
|---|---|---|
| Article Number | A97 | |
| Number of page(s) | 16 | |
| Section | Stellar structure and evolution | |
| DOI | https://doi.org/10.1051/0004-6361/202142433 | |
| Published online | 11 March 2022 | |
Relativistic Coulomb screening in pulsational pair instability supernovae
1
Department of Physics, Western Michigan University, Kalamazoo, MI 49008, USA
e-mail: This email address is being protected from spambots. You need JavaScript enabled to view it.
2
National Astronomical Observatory of Japan, 2-21-1 Osawa, Mitaka, Tokyo 181-8588, Japan
3
Joint Institute for Nuclear Astrophysics – Center for the Evolution of the Elements, Notre Dame, IN 46556, USA
4
Research Institute of Stellar Explosive Phenomena, Fukuoka University, 8-19-1 Nanakuma, Jonan-ku, Fukuoka-shi, Fukuoka 814-0180, Japan
5
Department of Physics, University of Wisconsin-Madison, Madison, WI 53706, USA
6
Graduate School of Science, The University of Tokyo, 7-3-1 Hongo, Bunkyo-ku, Tokyo 113-0033, Japan
7
School of Physics, Beihang University, 37 Xueyuan Road, Haidian-qu, Beijing 100083, PR China
8
Center for Astrophysics, Department of Physics, University of Notre Dame, 225 Nieuwland Science Hall, Notre Dame, IN 46556, USA
Received:
14
October 2021
Accepted:
6
December 2021
Abstract
Context. Pulsational pair-instability supernovae (PPISNe) and pair instability supernovae (PISNe) are the result of a thermonuclear runaway in the presence of a background electron-positron pair plasma. As such, their evolution and resultant black hole masses could possibly be affected by screening corrections due to the electron pair plasma.
Aims. The sensitivity of PISNe and PPISNe to relativistic weak screening has been explored.
Methods. In this paper a weak screening model that includes effects from relativistic pair production has been developed and applied at temperatures approaching and exceeding the threshold for pair production. This screening model replaces “classical” screening commonly used in astrophysics. Modifications to the weak screening electron Debye length were incorporated in a computationally tractable analytic form.
Results. In PPISNe the BH masses were found to increase somewhat at high temperatures, though this increase is small. The BH collapse is also found to occur at earlier times, and the pulsational morphology also changes. In addition to the resultant BH mass, the sensitivity to the screening model of the pulsational period, the pulse structure, the PPISN-to-PISN transition, and the shift in the BH mass gap has been analyzed. The dependence of the composition of the ejected mass was also examined.
Key words: instabilities / nuclear reactions, nucleosynthesis, abundances / plasmas / relativistic processes / stars: massive
© ESO 2022
1. Introduction
Currently, there is considerable interest in the black hole mass gap (BHMG). That is, black hole (BH) masses in the range of ∼50 − 120 M⊙ are not expected to exist (Woosley et al. 2007; Belczynski et al. 2016; Woosley 2017, 2019) because progenitor stars in this mass range are disrupted by pair-instability supernovae (PISNe) or pulsational pair-instability supernovae (PPISNe). The existence of this mass gap, however, has been brought into question by the observed LIGO and VIRGO gravitational wave event GW190521 (Abbott et al. 2020a) from which two BHs of masses  and
and  were deduced. Since both of these merging BHs are well within the putative BHMG, a re-examination of the constraints on BH masses from the pair instability and PPISNe is warranted (see, for example, Farmer et al. 2019; Marchant et al. 2019; Abbott et al. 2020b; Croon et al. 2020; van Son et al. 2020; Woosley & Heger 2021). Indeed, the existence of the BHMG and the associated progenitor evolution is sensitive to a host of astrophysical parameters as noted in Farmer et al. (2019), Sakstein et al. (2020), and Woosley & Heger (2021). In this paper we consider one additional sensitivity, that is the effects of relativistic screening of the thermonuclear reaction rates in the background associated pair plasma. Although, we find that the effects on the BHMG are small, we point out a number of interesting features regarding the evolution of the progenitors that depend upon the nature of the electron screening. In what follows we briefly summarize the physics of PISNe and PPISNe in Sect. 1.1. We describe a model for electron screening in a relativistic pair plasma in Sect. 1.2. The computations are described in Sect. 2, and the results are given in Sect. 3. Section 4 contains the conclusions of this work.
Pair-instability supernovae are caused by the production of electron-positron pairs in the cores of massive (MZAMS ≳ 80 M⊙) stars at the end of their lifetimes (Leung et al. 2019). At temperatures ≳109 K, electron pairs are produced by the thermal plasma, for example via γ + γ ⇔ e− + e+. As the photons are absorbed into pair production, the radiation pressure support of the core diminishes. Subsequently, the core contracts and the temperature rises. This leads to explosive thermonuclear oxygen burning. The release of this thermonuclear energy can be comparable to the binding energy of the star and lead to substantial mass ejection.
The details of the explosion and associated nucleosynthesis, however, depend upon the mass and metallicity of the progenitor star. At low metallicity, Z ∼ 10−3, stars in the mass range of ∼50 − 90 M⊙ can experience a sequence of contractions and explosions. This is referred to as a PPISN. Eventually, these stars can return to hydrostatic equilibrium and then collapse. However, the resultant BHs are significantly less massive than they would have been without the onset of the pair instability.
On the other hand, more massive progenitors with M ≥ 90 M⊙ experience such violent explosions that no BH remnant remains. These have been dubbed as PISNe. The most massive BH that can be formed before mass loss from the PPISN becomes significant defines the lower limit of the BHMG. In the heaviest progenitors for which M ≳ 240 M⊙, the pair instability is quenched because the interior temperatures are high enough to photodisintegrate heavy elements. This precludes the onset of runaway thermonuclear burning. The lightest BH formed in this way (∼120 M⊙ after mass loss; Heger & Woosley 2002) defines the upper edge of the BHMG.
Astrophysical reaction rates in stellar plasmas can be very sensitive to the tails of the Coulomb potentials between two reacting charged nuclei. This is because charged nuclei in astrophysical environments have center-of-mass energies ∼kT well below the height of the Coulomb barriers. For an environment at a certain temperature, the average thermonuclear reaction rates between charged particles are determined by integrating the energy-dependent cross section times the Mawell-Boltzmann energy distribution for the reactants involved to obtain the average thermonuclear reaction rate (TRR), ⟨σv⟩ (Boyd 2008; Iliadis 2007). Resonances at specific energies are similarly determined with a term in the cross section which defines the resonance.
However, one must also account for screening between the two reacting nuclei due to the background charges and (fully or partially) ionized nuclei. Coulomb screening results in a reduction in the effective Coulomb barrier between the two reacting nuclei and an increase in the penetrability of the barrier, leading to an increase in the overall rate. This effect has been well studied and is incorporated into multiple existing astrophysics calculations and codes (Wu & Pálffy 2017; Liu 2016; Spitaleri et al. 2016; Kravchuk & Yakovlev 2014; Potekhin & Chabrier 2013; Quarati & Scarfone 2007; Shaviv & Shaviv 2000; Adelberger et al. 1998; Shalybkov & Yakovlev 1987; Wang et al. 2011; Wallace et al. 1982; Itoh et al. 1977; Jancovici 1977; Graboske et al. 1973; Dewitt et al. 1973; Salpeter & van Horn 1969; Salpeter 1954).
When evaluating the effects of electron screening on the Coulomb potential, even a small shift in the potential can result in significant changes in the nuclear reaction rates. For positively charged nuclei the overall reaction rates increase because charges are re-distributed nonuniformly in the presence of the central nuclear potential. That is, the electron number density is higher in the vicinity of the central nucleus and lower farther away, while the opposite is true for the surrounding positively-charged nuclei. Despite the extensive development of nuclear screening effects on thermonuclear reaction rates, relativistic plasma effects have not yet been fully addressed. If the temperature is high enough, electron-positron pairs are created, and these add additional charged particles to the plasma. Recalling that any charge added to the plasma results in a net reduction in the Coulomb potential, pair production can have an additional effect on screening. In addition, if the plasma is magnetized, the electron-positron momentum distributions are quantized into Landau levels, further changing the overall energy distribution, resultant numbers of electrons and positrons, and the overall screening characteristics of the plasma (Famiano et al. 2020). Applying these effects to massive stars (Kozyreva et al. 2017; Woosley 2017; Spera & Mapelli 2017; Takahashi et al. 2018) or to neutrino cooling mechanisms (Itoh et al. 1996) is potentially very interesting.
For a hot, ionized plasma, the Coulomb potential between two reacting nuclei is reduced by the presence of background charges. Assuming charge neutrality, the electrostatic potential, ϕ of a particle with charge Ze immersed in a set of background charge distributions is determined via the Poisson-Boltzmann equation:
![Mathematical equation: $$ \begin{aligned} \nabla ^2\phi (r) = -4\pi Ze^2\delta (\mathbf r ^3) -4\pi \sum _{z\ge -1} ze n_z\exp \left[-\frac{Zze^2\phi (r)}{kT}\right]\ \. \end{aligned} $$](/articles/aa/full_html/2022/03/aa42433-21/aa42433-21-eq3.gif) (1)
(1)
Here, the summation in the last term is over all charges ze in the plasma having number density nz. We note that this sum includes electrons, with z = −1. The results of this calculation are widely used in astrophysical calculations, despite the assumption of a classical (Boltzmann) energy distribution for all of the particles, given by the second term in the above equations. With this, evaluations of the electron degeneracy must be explicitly determined to obtain the electron number density and resulting energy distribution.
In the case of a hot, unmagnetized plasma, the energy distribution must be replaced with the corresponding distribution assuming Fermi-Dirac statistics. The Poisson-Boltzmann equation must be replaced with the equivalent equation assuming Fermi statistics and chemical potential, μ (Famiano et al. 2016, 2020):
![Mathematical equation: $$ \begin{aligned} \nabla ^2\phi _r&= -4\pi Ze\delta (\mathbf r ^3) -4\pi \sum _{z>0} ze n_z\exp {\left[-\frac{Zze^2\phi _r}{kT}\right]} \\\nonumber&-\frac{4e}{\pi }\int \limits _0^\infty {p^2\mathrm{d}p \left[\frac{1}{\exp (E-\mu - e\phi _r)/T+1}-\frac{1}{\exp (E+\mu +e\phi _r)/T+1}\right]}. \end{aligned} $$](/articles/aa/full_html/2022/03/aa42433-21/aa42433-21-eq4.gif) (2)
(2)
Relativistic effects come from the high thermal energy. (Natural units are used: k = ℏ = c = 1.) This relationship can also be deduced from a solution to the Schwinger-Dyson equation for the photon propagator (Kapusta & Gale 2006). Here, the much heavier nuclei can be safely treated with Boltzmann statistics.
The difference between Eqs. (1) and (2) is the replacement of the Maxwell-Boltzmann energy distribution for electrons with that corresponding Fermi-Dirac distribution. This replacement becomes important in cases where the temperature is comparable to or greater than the electron mass as positrons can be created in the system. However, even at relatively low temperatures, T ∼ 100 keV, the high-energy tail of the Fermi-Dirac distribution can result in positron production. For temperatures below this and for densities that are low enough, the electron chemical potentials are low, and the Maxwell-Boltzmann distribution closely matches the Fermi-Dirac distribution (Famiano et al. 2016, 2020).
Ultimately, however, in the case of weak screening, the number density is linearized with respect to electrostatic potential (which is equivalent to taking a derivative with respect to the chemical potential in the Fermi-Dirac distribution) (Famiano et al. 2016), and the slope of the distribution becomes important. The differences in slope can be significant at high temperatures, resulting in different Debye screening lengths. The importance of this difference will be discussed below.
If the temperature is high enough, such that the average Coulomb energy between two interacting particles is much less than the thermal energy of the plasma, EC/kT ≪ 1, “weak screening” can apply. In such a plasma, the electrons are mostly nondegenerate. Equations (1) and (2) can be expanded to first order in the potential. This expansion to 𝒪(ϕ) is known as the Debye-Hückel approximation, and the usual 1/r Coulomb potential takes on a Yukawa form, ϕ(r)∝e−r/λD/r where the characteristic length λD is known as the Debye length. A similar Thomas-Fermi screening length can be derived using the density of states at the electron Fermi surface (Ichimaru 1993) with a screening length, λTF ∝ ∂n/∂μ.
At the other extreme in the temperature-density relationship is “strong screening.” At high densities, the average distance between nuclei is small enough such that the average Coulomb energy energy is much larger than the thermal energy, EC/kT ≫ 1. Here, the linear approximation for Debye-Hückel or Thomas-Fermi screening is inadequate. Likewise, the electron chemical potential becomes larger and must be accounted for in Eq. (2). In this regime, generally the “ion sphere” screening model is used, in which the potential is modified by the difference in Coulomb energy between the reactants and products of a reaction (Clayton 1983; Salpeter & van Horn 1969; Salpeter 1954).
Between weak and strong screening, where EC ∼ kT, there is still much work to be done, and computational methods can be tricky. While the electron degeneracy and Coulomb potentials can be numerically calculated (Graboske et al. 1973), in order to maintain computational efficiency, approximate methods are often adopted to treat screening in this region. Numerical fits and tables have also been used to determine reaction-rate enhancements due to screening. Other commonly-used tools rely on interpolation or averaging schemes to determine the screening enhancement in this region (Meyer & Adams 2007; Wallace et al. 1982; Salpeter & van Horn 1969; Paxton et al. 2011a).
Ultimately, the increase in nuclear reaction rates is expressed by the “screening enhancement factor” (SEF), f which relates the unscreened and screened rates, ⟨σv⟩uns and ⟨σv⟩scr respectively. In the Salpeter approximation (Salpeter 1954), the screened rate is then ⟨σv⟩scr = f⟨σv⟩uns. This results from assuming that the shift in the screening potential is much less than the height of the Coulomb potential and can be treated to first order in the WKB approximation. The value of f is then expressed as f = eH (Graboske et al. 1973; Jancovici 1977; Salpeter 1954; Salpeter & van Horn 1969; Wallace et al. 1982). The value of H is unitless and is determined based upon the screening model used (Sahoo & Das 2016; Kravchuk & Yakovlev 2014; Itoh et al. 1977; Alastuey & Jancovici 1978; Dewitt et al. 1973; Quarati & Scarfone 2007). In the case of intermediate screening discussed briefly above, HI commonly results from an interpolation between strong and weak screening or a type of geometric mean (Paxton et al. 2011a, 2015, 2018; Meyer & Adams 2007). For example, Wallace et al. (1982) sets  while the MESA code (Paxton et al. 2011a, 2015, 2018) relies on a type of linear interpolation based upon the effective screening parameter discussed in Sect. 2.2.
In this paper, effects of the inclusion of Fermi-Dirac statistics in the electron screening on PPISN and PISN models are studied. Various characteristics and results from several PPISN and PISN simulations are studied using a screening model in which the weak screening factor has been replaced with one developed using the Poisson equation shown in Eq. (2).
2. Methods
2.1. Computational model
We have used the MESA code (Paxton et al. 2011b) v.11123 to model the collapse and SN explosions of PPISN and PISN respectively. Here, we follow the computations of Marchant et al. (2019). While we summarize the calculation briefly here, we refer to the original paper for details (Marchant et al. 2019). While we note that differences exist in various models and computations, we have adopted this model for a consistent comparison between the two screening formulations. In this model, we treated stellar evolution beginning with He cores, assuming the H envelope has since been ejected by the wind (Leung et al. 2019). We concentrated primarily on nonrotating models with a metallicity, Z = Z⊙/10, where Z⊙ = 0.0142. This is consistent with metallicities inferred from massive BH mergers observed by Abbott et al. (2016) as well as the results of Belczynski et al. (2016) who predicted progenitor metallicities of Z ≤ 0.5 Z⊙ and Z ≤ 0.3 Z⊙, respectively. For metallicities much higher than this, the BH mass is limited because the stellar mass loss is too great. Other studies (Spera & Mapelli 2017) of the metallicities of progenitors of PPISNe predict a range of metallicities generally much less than Z = Z⊙ and typically greater than Z ≈ 0.5 Z⊙. This choice of metallicity also allowed us to compare our calculations with the model of Marchant et al. (2019), who used Z = 0.1 Z⊙. Aside from changing the screening, nearly all of the parameters used here were kept the same as in Marchant et al. (2019). This includes the assumption of hydrostatic equilibrium in early phases of the evolution, with the HLLC solver (Toro et al. 1994) used when the weighted adiabatic exponent ⟨Γ1⟩< (4/3 + 0.01) and the central temperature exceeds 109 K. Additionally, a somewhat higher Fe core infall limit of 8×108 cm s−1 was used to avoid interrupting collapse from the pair-instability.
The approx21 network was used at the onset of the pulsational phase. This network is described in detail in Marchant et al. (2019). This 21-isotope network includes (α, γ)↔(γ, α) linking reactions for 4He, 12C, 16O, 20Ne, 24Mg, 28Si, 32S, 36Ar, 40Ca, 44Ti, 48Cr, 52Fe, and 56Ni. In addition, (α, p)→(p, γ) reactions and their inverses are included in this network by assuming steady-state proton flow through 27Al, 31P, 35Cl, 39K, 43Sc, 47V, 51Mn, and 55Co. 54, 56Fe are also included through neutron captures on 52Fe, as well as (γ, p) and (γ, α) reactions on 56Niand 56Cr. These additional Fe and Cr isotopes are implemented through steady-state flows on the α-cluster Fe and Ni nuclei (Marchant et al. 2019). Carbon and oxygen burning, the PP chain, and the CNO cycles are also included. Some uncertainties have been associated with the use of this network (Marchant et al. 2019), particularly for more massive stars (for example, M ∼ 200 M⊙). However, at lower masses within the PPISN region, the uncertainties in this choice of network have been found to be relatively small.
There are three possible results of this model for the He core progenitors studied. One possibility is a direct collapse in which the Fe core velocity exceeds the infall limit without undergoing a pulse, forming a BH. Here, we adopt the enclosed baryonic mass prior to direct core collapse as a measure of the resultant BH gravitational mass (Fryer 1999), although we note that the BH gravitational mass can be significantly less than the baryonic mass. We also note that recent studies have indicated that a slightly larger mass may result even for massive cores due to fallback in subsequent explosions (Chan et al. 2018; Kuroda et al. 2018). This is expected to occur for lower-mass models with M ≲ 45 M⊙ and very high mass models with M ≳ 240 M⊙ (Farmer et al. 2019).
For intermediate masses with 45 ≲ M/M⊙ ≲ 90, the star is expected to undergo a PPISN, in which it ejects a possibly significant amount of mass in the wind and pulses before finally collapsing into a BH. The number of pulses that the progenitor undergoes varies with each model, and we study here the dependence on the screening model. For progenitors with 90 ≲ M/M⊙ ≲ 240, the star explodes in a PISN, determined by the velocity of each mass element in the model exceeding the stellar escape velocity. For all of these outcomes, we examine the resultant BH mass, the time to final outcome, the pulse morphology, and the resultant nucleosynthesis – particularly the composition of the ejected mass.
2.2. Screening model
The screening model described in Famiano et al. (2016) was used to determine and effective Debye screening length at high temperatures, and the SEF was calculated in the Salpeter approximation. A specialized screening subroutine was written and adapted into MESA and implemented with an appropriate inlist. For weak screening, two screening modes were explored. The “extended” screening mode implemented in existing versions of MESA and based upon the formulation of Graboske et al. (1973) was used as a default model for comparison. The new “relativistic” mode incorporated the intermediate and strong extended screening modes while replacing the weak SEF with the relativistic factor. Here, the screened reaction rate, Γscr, between two nuclei of charge Z1 and Z2 is enhanced over the unscreened rate, Γ0, according to:
 (3)
(3)
where the weak screening exponent varies between the two models. For extended screening, the weak screening exponent is defined in the literature. Also, in this formulation, at higher densities or lower temperatures, weak screening cannot be used. This is because the Debye approximation assumes that the Coulomb energy is much less than the thermal energy of the plasma. The strong screening regime has been discussed in the literature (Dewitt et al. 1973; Alastuey & Jancovici 1978; Itoh et al. 1979), and models have been developed in which the exponent in Eq. (3) is replaced by a corresponding exponent for strong or intermediate screening (Wallace et al. 1982) as described below. For both relativistic and classical screening, the exponent is defined using the Salpeter approximation:
 (4)
(4)
where λ is the Debye screening length derived in each model. The screening length must also include that of the background ions, λI so the total screening length is:
![Mathematical equation: $$ \begin{aligned} \frac{1}{\lambda } = \left[\frac{1}{\lambda _I^2} + \frac{1}{\lambda _e^2}\right]^{1/2}. \end{aligned} $$](/articles/aa/full_html/2022/03/aa42433-21/aa42433-21-eq8.gif) (5)
(5)
In the weak screening limit, Eq. (5) is a direct result of assuming a linear approximation of the potential for electrons and ions. This can be shown simply in the derivation of the Debye length. For the classical electron screening length, the total Debye length can be shown to match that of Dewitt et al. (1973), which is currently used in the MESA extended screening model.
The electron Debye length was computed for two different regimes characterized by the environmental temperature. At high temperatures, kT ∼ me, relativistic effects become more significant. At lower temperatures, kT ≲ me, a classical approximation is sufficient. Thus, two different approximations for the screening length were used. For kT < 150 keV, the nonrelativistic regime was assumed, and MESA’s default classical screening length, which corresponds to the Salpeter screening length (Salpeter 1954) was adopted. For kT > 150 keV, a relativistic approximation of the Thomas-Fermi screening length, described below, was used. In the following we discuss the accuracy of this approximation compared to the numerically computed Thomas-Fermi length. We also highlight the agreement between the different means to describe screening enhancement factors at the boundary between the relativistic and classical regimes.
We developed a new application of the electron screening length in which relativistic effects from a hot plasma were accounted for. This is distinguished from the commonly used screening length extracted from the linear approximation of the Poisson-Boltzmann equation. For temperatures that are high-enough, pair production can change the total free charges in the plasma, resulting in enhanced screening. At lower temperatures, the classical screening length suffices. We thus define the screening length used in this paper as:
 (6)
(6)
where the usual classical screening length is defined as:
![Mathematical equation: $$ \begin{aligned} \lambda _c \equiv \left[ \frac{T}{4\pi e^2Y_{\rm e}\rho N_{\rm A}} \right]^{1/2}, \end{aligned} $$](/articles/aa/full_html/2022/03/aa42433-21/aa42433-21-eq10.gif) (7)
(7)
where Ye is the electron fraction and NA is Avogadro’s number. The relativistic electron screening length is described in a compact form below.
The relativistic electron screening length, λr, can be derived following Famiano et al. (2016). For computational speed, we utilize the following approximation:
![Mathematical equation: $$ \begin{aligned} \frac{1}{\lambda _r^2}\approx \frac{4e^2}{\pi }T^2A\left[1-f\right], \end{aligned} $$](/articles/aa/full_html/2022/03/aa42433-21/aa42433-21-eq11.gif) (8)
(8)
where
 (9)
(9)
where terms expressed with a tilde are divided by the temperature,  . Here
  where me is the electron mass.
In the weak screening regime, the screening coefficient was given by Eq. (4). For strong screening, the same evaluation was used in both models. In this case, the evaluation of Alastuey & Jancovici (1978) was used with plasma parameters from Itoh et al. (1979). This is the default strong screening treatment for the MESA extended screening model. For intermediate screening, the screening coefficient in Eq. (3) was replaced by an interpolation between the weak and strong screening coefficients as prescribed by the MESA default screening scheme in which the intermediate screening is a weighted sum of the strong and weak screening coefficients, Hs and Hw. The weighting factor H is an average given by the relative difference between the effective screening parameter Γeff and the boundaries between the strong and intermediate plus intermediate and weak screening regimes:
 (10)
(10)
where the effective screening parameter, Γeff, is adapted from Alastuey & Jancovici (1978) in Wallace et al. (1982). Here, we emphasize that relativistic effects are accounted for in the evaluation of the electron Debye length. Ultimately, this will change Hw (Eq. (4)). For strong screening, we adopted the formulation described in Alastuey & Jancovici (1978) and Wallace et al. (1982), in which case the relativistic effects considered here were not accounted for. However, with the interpolation considered in Eq. (10), relativistic effects were included in intermediate screening because intermediate screening is dependent upon Hw. It is important to note that nearly all of the stellar evolution computed here is in the weak or intermediate regime. Thus, inclusion of relativistic effects influences nearly all of the stellar evolution for massive stars.
Thus, the modification to the MESA extended screening scheme is to replace the weak screening coefficient, Hw, in Eqs. (3) and (10) with that of Eq. (4) utilizing the relativistic screening length of Eq. (8). Further, we restricted this scheme to temperatures above kT = 150 keV (T9 ≡ 1.74). For temperatures below kT = 150 keV, the classical screening length was used. This was found to be a reasonable demarcation because the difference between the relativistic and the classical SEFs is small at lower temperatures (Famiano et al. 2020). This is shown in Fig. 1, in which the SEFs for classical screening, relativistic screening, and the relativistic approximation are shown for various major reactions as a function of density at kT = 150 keV. A density range of 4.8 < log(ρ) < 6.4 is shown. This was chosen because for all models, the density when kT = 150 keV falls within this range. In this figure, one may expect that relativistic screening effects are averaged out in the stellar evolution as the SEFs are higher at low density and lower at high density. This would be a good first-order estimate. One must also keep in mind that the stellar mass at higher densities may be different than the total mass at lower densities and that the time spent in various temperature-density regions may not be equal. More importantly, however, is that at higher densities, the weak screening studied here may give way to strong (ion-sphere) screening. This will be discussed below. It can be seen that the SEFs at this temperature are relatively low, compared to SEFs at higher T or ρ, and that the numerical relativistic, the relativistic approximation, and the classical screening lengths only vary by ∼1%. This also provides a limitation at very high density so that (f − 1) > 0 in the approximation of Eq. (8).
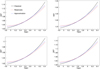 |
Fig. 1. Screening enhancement factors for four major reactant pairs as a function of density at kT = 150 keV and Ye = 0.5. The density at which all SEFs are equal is temperature dependent. (Top left:12C+α, top right:16O+α, bottom left:12C+12C, bottom right:16O+16O.) Solid lines indicate classical screening; red, dashed lines indicate relativistic screening; and blue, dotted lines indicate the relativistic approximation. |
While computationally efficient, there is some uncertainty in this approximation at low temperatures and high densities. The T = 150 keV boundary between the use of the classical screening length and the relativistic screening length is somewhat arbitrary. Also, we explored the magnitude of the error induced by using the approximation and the agreement between the classical and the relativistic screening lengths at the boundary. In particular, any uncertainty must be evaluated for the astrophysical site to which it is applicable. Because we are evaluating screening effects in PPISN and PISN, we have explored the errors induced for all the trajectories calculated in a MESA simulation of representative PPISNs and PISNs.
As a representative case, we present calculations of the screening length for temperatures and densities within a 70 M⊙ He core progenitor in Fig. 2. Here T − ρYe coordinates are presented for the evolution of this progenitor. Every point in this figure corresponds to a unique mass-time coordinate in the evolution of the star for zones in which the screening length is applicable (Γeff < 0.8 Wallace et al. 1982). Figure 2 (top left) shows the screening length at all points in the evolution. it can be seen that the screening lengths match seamlessly at kT = 150 keV, where the boundary between relativistic and classical screening is set.
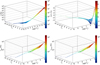 |
Fig. 2. Evaluation of the error and applicability of various screening lengths for a 70 M⊙ He core progenitor. Each point in the figures corresponds to an individual mass-time coordinate in the overall evolution of this model from the start of the simulation to the final collapse. Top left: calculated screening length for the entire evolution of the star. The transition from relativistic screening to classical screening occurs at a temperature of 150 keV. The points mesh seamlessly here. Top right: the relative uncertainty between the approximation of Eq. (8) and the exact numerically calculated screening length. Bottom left: the screening length computed using the approximation of Eq. (8) for kT > 150 keV. Bottom right: the exact numerically calculated screening length for kT > 150 keV. |
The relative error induced in the use of the approximation is shown for all points in the evolution where relativistic screening is used in Fig. 2 (top right). While the error at low temperatures and densities is ∼5% or less, the errors at higher temperatures is quite small. This is important to note as the effects of relativistic screening are expected to be more pronounced at higher temperature.
For completeness, the relativistic screening length evaluations are shown in the bottom row of Fig. 2. These compare the adopted approximation (bottom left) and the exact numerical computation (bottom right). These evaluations are shown for all points in the evolution for which T > 150 keV. These figures appear nearly identical. The same evaluation was done for all models explored in this work, and the errors induced in using the approximation were found to be nearly the same and quite tolerable in every case.
The uncertainty in this evaluation is further explored in Fig. 3, where the relative difference in the numerically evaluated screening length, λr and the approximation of Eq. (8), λexp, is shown as a function of temperature and density times electron fraction, ρYe. In the left panel of this figure the relative error of the approximation is shown where Δλr ≡ λexp − λr. There is some deviation at the lowest temperatures and densities, where the screening length is small. Also, at low temperatures and very high densities, the uncertainty is larger. However, this temperature-density combination does not occur in any of the simulations presented here as seen in Fig. 2 and can thus be ignored in this model. Further, this region is more likely to be in the strong-screening regime, where weak screening is invalid in any evaluation, including the commonly used weak Salpeter approximation. That is, Γeff ≥ 0.8 in Eq. (6) as a result of a high density as well as a lower temperature (Wallace et al. 1982; Alastuey & Jancovici 1978). Because the Salpeter result of Eq. (4) only applies to environments in which the Coulomb energy is much less than the thermal energy (as a result of high temperature or low density), for lower temperatures and higher densities – such as those found in the inner crusts of neutron stars or in white dwarfs – strong screening formulations including variations on the ion-sphere model (Alastuey & Jancovici 1978; Itoh et al. 1996, 1979) must be used. For regions “intermediate” between weak and strong screening, relativistic effects are still important in that the exponent of Eq. (4) depends on the Debye length. In any case, the low-temperature, high-density region (T9 ≲ 3 and log ρYe ≳ 7 of Fig. 3 (left) is irrelevant in our model.
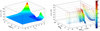 |
Fig. 3. Left: relative error in relativistic Debye length using the approximation of Eq. (8). Right: relative error in relativistic Debye length for individual zones in the MESA evolution for a 70 M⊙ He progenitor as a function of time prior to collapse. Each dot in the figure is a mass element at a specific time step. Only times at which T > 150 keV and mass elements for which weak or intermediate relativistic screening is appropriate are shown. |
The uncertainty is explored further in the right panel of Fig. 3, which shows the error in the relativistic screening length as a function of stellar mass and time coordinate for a 70 M⊙ He core progenitor. (For Figs. 3 and 4, only the electron screening lengths λe are compared for clarity.) In this figure, the time coordinate is the logarithm of the time before final collapse, and the mass coordinate is measured from the center of the star. Each dot in the figure represents a mass-time point in the evolution. The clustering around pulses near log(tcoll − t)≈2 and at log(tcoll − t)≈ − 2 correspond to small time steps as the temperature gradients are steep for the pulses. Here, only coordinates for which relativistic weak or intermediate screening is relevant (that is Γeff < 0.8 and kT > 150 keV) are displayed as these are the only coordinates for which the relativistic weak screening length is employed. Thus, while it appears that the mass-time points extend above the range of the plot, they actually do not. This is because only the relativistic approximation is being evaluated in this figure. The apparent cutoff in points at the top of the plot is the region where the temperature of the mass zones drops below 150 keV (farther from the stellar core). Beyond these points, kT < 150 keV, so that the default Salpeter screening length is used. These correspond to the central portions of the star as it heats up; one sees that the maximum mass coordinate is 20 M⊙ even though there are cooler mass coordinates in the outer layers of the star. The outer layers of the star are not sufficiently hot for a relativistic treatment. As the central and and outer layers of the star get hotter, the mass coordinates for which relativistic screening becomes relevant increases toward the outer edge of the remnant. It is seen that the error in the screening length is within 10% of the true value for all time and mass elements in this treatment.
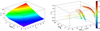 |
Fig. 4. Left: ratio of classical to relativistic electron screening lengths for the weak and intermediate screening as a function of temperature and electron density. Right: ratio of classical to electron screening lengths for a 70 M⊙ model evolution. The time is shown as time before final collapse. Each dot is a mass element and a time step. In the figure, values less than unity are blue, while those greater than unity are green. |
The relative difference between the classical and relativistic Debye lengths (λc − λr)/λc for the same site is shown in Fig. 4. In the left panel, the ratio of the classical to the relativistic Debye length is shown as a function of ρYe and temperature, T9. It is seen that the classical Debye length is larger than the relativistic Debye length for most of the area of this plot, except at low temperatures and higher densities, where the classical Debye length is smaller than the relativistic Debye length. We note that, at constant density, the classical Debye length increases monotonically with temperature, while the relativistic Debye length decreases. In typical astrophysical conditions, the points where λc < λr are in the strong screening regime, and weak screening is not relevant anyway. This is shown in the right panel for the same mass-time elements as in Fig. 3. This shows that the early pulses (that are closer to the surface where the density is lower) have a shorter λr. Except for a very few high-density points near the core, the relativistic screening length is shorter than the classical screening length. Naively, it is expected that the relativistic Debye screening always results in increased rates, and we can see that this is true overall except for a few very short periods of time in a very small region near the high-density core. Thus, the SEFs are always larger in regions where relativistic weak and intermediate screening is employed.
3. Results
Multiple PPISN and PISN simulations were run varying by the initial mass and metallicity. For the bulk of the simulations, the initial metallicity was set to Z = Z⊙/10. We examined ejected mass, final BH mass, pulse morphology, ejection time, and nucleosynthesis in each model. Representative results are presented here.
3.1. Pulsational time
Time characteristics of the central temperature, which was used to define a pulse (Marchant et al. 2019), are shown for multiple representative progenitors in Figs. 5–7. Progenitor masses in this figure were chosen to cover the full range of BH masses resulting from PPISN as well as progenitors in the region which produces the most massive BHs in the PPISN region.
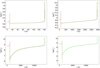 |
Fig. 5. Logarithm of central temperature, log Tc versus time for various progenitor models. The solid green lines correspond to the default screening model, and the dashed red lines correspond to the relativistic screening model. Top left: 70 M⊙, (top right) 76 M⊙, (bottom left) 89 M⊙, and (bottom right) 89.02 M⊙ |
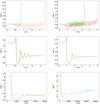 |
Fig. 6. Logarithm of central temperature showing detail of the first pulse for several progenitors. The lines are the same as in Fig. 5. Top left: 44.5 M⊙, top right: 45 M⊙, middle left: 70 M⊙, middle right: 76 M⊙, bottom left: 89 M⊙, and bottom right: 89.02 M⊙. |
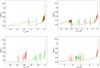 |
Fig. 7. Detail of central temperature for three progenitor models for both default (solid green lines) and relativistic (dashed red lines) screening rates. Top left: 52 M⊙, top right: 58 M⊙, bottom left: 64 M⊙, and bottom right: 70 M⊙. The relativistic screening case has been offset by 6.82 yr for the 52 M⊙ model and by −2.79 × 10⁴ s for the 70 M⊙ model so that both evolution plots can fall within the same range. |
At the low end of the PPISN mass range, for 44.5 M⊙ progenitors, stars undergo a direct collapse after losing roughly 10 M⊙ to the wind. At low progenitor mass, near the transition between direct collapse to PPISN, the central temperature may exhibit an extended amount of time undergoing “weak pulses” (Woosley 2017) indicated by the oscillations in the central temperature prior to the final collapse. For the direct collapse BH at 44.5 M⊙, the unstable pulsation for relativistic screening is more prominent. However, these weak pulses do not occur in the default screening model. In this borderline region, the very slightly increased reaction rates at high temperature in the early pulsational stages results in a transition from direct collapse to PPISN at a slightly (negligibly) lower mass. While the instabilities occur at roughly the same time for both the default and relativistic screening models, the instabilities last for a longer period of time and they extend the collapse to later times at low mass. For the default screening model, the onset of these weak pulses and unstable pulsation occurs at a slightly higher mass in which the core temperature and density undergoes a transition from conditions that result in direct collapse to that of a PPISN.
For masses around 70 M⊙, which will be shown to produce the more massive BHs, the first pulses are found to occur at roughly the same time. This is reasonable given that the core temperatures prior to the pulse do not exceed the threshold for relativistic screening until near the peak of the short time pulse. However, because of the slight differences in burning and composition in both models, subsequent pulses and collapse occur at different times.
For the 89 M⊙ model, in which only one full pulse occurs prior to collapse, the final collapse time occurs slightly earlier for relativistic screening. In this model, reaction rates during the first pulse are increased by relativistic screening as the relativistic Debye length is shorter. While the final nucleosynthetic abundances are not changed significantly, the processing is slightly faster.
In the case of the 80.92 M⊙ progenitor, the default screening model proceeds to collapse, while the relativistic model proceeds to a PISN. This mass is right at the boundary between PPISN and PISN formation, and the rates for the relativistic model produce a very slight increase in the overall nuclear heating during the first pulse. This region is a high-mass equivalent to the low-mass region at which the star is close to being unstable against collapse or explosion.
Details of the first pulses in several models are shown in Fig. 6. For the low-mass models near the boundary between direct collapse and PPISN collapse, the weak pulses can be seen in detail. The mass at which the weak pulses appear is lower in the relativistic model, and the pulsation extends for a longer period of time prior to collapse in the 45 M⊙ model. For the intermediate masses near 70 M⊙, there is little difference in the pulse morphology of the first pulses.
For the high-mass progenitors near the boundary between PPISN and PISN formation, it can be seen that the time to restore the star to the quiescent phase takes longer with increasing progenitor mass. In the case of the 89.02 M⊙ model, the star can be seen to undergo several oscillations in the central temperature before it stabilizes for the default screening model. However, in the case of relativistic screening, the explosion ends the stellar evolution at the first pulse. The ultimate effect here is to reduce the mass at which the boundary at which stars transition from PISN to PPISN occurs. We note, however, that this reduction is very small and within the uncertainties of the current model (Farmer et al. 2019).
In all cases, the evolution up to the first pulse is similar in both screening models. However, the subsequent evolution may be different in terms of the total time to collapse or explosion and in terms of pulse morphology. Figure 7 shows the central temperature evolution for the final pulses in various stellar progenitor models. While the pulse morphology looks similar in all cases, some changes in the number of pulses, pulse distribution and the pulse shape can be observed. For example, in the 52 M⊙ relativistic model, the increased rates in the final pulsation results in an additional period of weak pulsation near 303 years. The number of pulses later on are roughly the same, though they occur at different times. Overall, for this mass, the core spends more time at temperatures for which relativistic screening becomes important.
In the case of the 58 M⊙ model, the earlier pulse structure in the figure is dramatically different, and the core undergoes fewer pulses at the latest times. Overall, this results in the 58 M⊙ relativistic model spending a much smaller amount of time at relativistic temperatures.
In the case of the 70 M⊙ model, the pulse morphology is similar in both cases, with the number of pulses and pulse duration similar in the default and relativistic screening cases. The total time to collapse from the initial pulse is only slightly longer in the relativistic model.
The total time from the onset of the initial pulse (defined as the time at which the central temperature first exceeds 150 keV) to final collapse or explosion is shown in Fig. 8 (left). This figure provides a comparison of the total time spent in the instability region for a PPISN. In this figure, the sharp drop at ∼89 M⊙ occurs at the boundary between the PPISN and PISN. At this mass boundary, the PISN may undergo a single sharp rise in core temperature followed by an explosion as the entire star expands faster than the local escape velocity. At the low-mass end of the PPISN region, the total time to collapse is also small as the star undergoes only a single pulse. For intermediate masses (45 M⊙ < M < 89 M⊙), additional pulses increase the time to collapse, though the time between the first and second pulses tends to dominate the evolution in this model (Marchant et al. 2019).
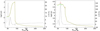 |
Fig. 8. Left: time elapsed between initial pulse and final progenitor collapse or explosion as a function of initial mass. Right: cumulative time for which the core temperature kT > 150 keV as a function of initial mass. The solid green lines correspond to extended screening calculations. The red dashed lines correspond to relativistic screening calculations. The dotted black lines are the relative time difference between relativistic screening and default screening. |
In the intermediate mass region, the evolution is not only dominated by the number of pulses, but also the pulse morphology and stellar heating. For example, for a 52 M⊙ star, the additional pulsation shown in Fig. 7 creates an extended period during which relativistic screening is prominent. This can affect the nucleosynthesis and mass ejection during the pulse, which will be discussed later.
Perhaps a better metric for evaluating the impact of relativistic effects is the total time at which the star’s core temperature exceeds 150 keV. This is important as it provides a metric for mass models for which the largest differences may be expected. This is shown in Fig. 8 (right). Because of the instability of the PPISN progenitors, there can be dramatic deviations over the entire mass range. For example, for a 58 M⊙ progenitor, the number of pulses and pulse time vary little between the first and last pulse, resulting in little difference in times spent at high temperature in each model. For the 52 M⊙ progenitor, the additional instability and pulsation just prior to collapse results in significantly more time spent at high temperature. The same is true for the 64 M⊙ model, in which the extended instability and the additional time to collapse result in a significantly longer time spent at high temperature, where relativistic effects could be more prominent. The much longer time for the 64 M⊙ model is shown as the large spike in the relative time difference in Fig. 8 (right).
3.2. Black Hole Masses for PPISN
For PPISN, with progenitor core masses 44.5 ≲ M/M⊙ ≲ 89, the final BH mass was determined in both the default and relativistic screening models. As stated previously, the final baryonic mass is adopted as a reasonable measure of the BH gravitational mass (Fryer 1999).
The final BH mass as a function of progenitor mass is shown in Fig. 9 (left). The difference in masses between both models as a function of progenitor mass is shown in Fig. 9 (right) where ΔM/M ≡ (MBH, rel − MBH, def)/M × 100%. In either case it is seen that the influence of relativistic screening is negligibly small as the change in mass is likely smaller than the numerical uncertainties of the model (Farmer et al. 2019). The BH masses shown in Fig. 9 (left) are in the mass range 11.22 < MBH/M⊙ < 43.94. These values are comparable to those extracted from recent LIGO and VIRGO data for binary-black-hole merger events (Abbott et al. 2019). Lighter BH merger events, such as GW170608 contained lower-mass BHs which likely originated from core-collapse supernova events and not PPISNe. One merger event, GW170729, was found to contain a 50.2 M⊙ BH, which lies in the mass gap in which massive stars are thought to undergo PISN. It has been found, however, that these more massive BHs may be formed if the 12C(α,γ)16O cross-section is larger, while still being within the 68% confidence interval for this rate (Farmer et al. 2019).
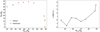 |
Fig. 9. Left: resultant BH mass versus He core progenitor mass for models including the extended screening and relativistic screening. The PPISN-PISN cutoff lies between 89.02 M⊙ and 89.05 M⊙ for the default screening model and between 89 M⊙ and 89.02 M⊙ for the relativistic screening model. Green circles correspond to default screening, and red squares correspond to relativistic screening. Right: relative shift in the resultant BH mass when relativistic screening is used compared to the default screening model. |
A significant portion of the mass loss in each case comes from the individual pulses themselves, with most of the pulsational mass loss from the first pulse. Much of the He loss is from the wind prior to the first pulse. This can be seen in Fig. 10, which shows the mass loss for various progenitors at the first pulse and up to the time of collapse. Shown in this figure is the total stellar mass below the stellar escape velocity as a function of time for various progenitor masses. In each case, a significant amount of mass loss occurs during the first pulse. While subsequent pulses occur, the mass loss may not be as pronounced. However, the 76 M⊙ progenitor shows significant mass loss during subsequent pulses. Also observable is the difference in the stellar mass for each model. A larger resultant BH for the most massive PPISN, while the final BH for a 70 M⊙ model is smaller. It is also noted that relativistic effects shift the boundary between PPISNe and PISNe to lower progenitor mass. However, this shift is insignificant.
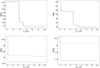 |
Fig. 10. Stellar mass as a function of time. Evolution is tracked as the logarithm of the time before final collapse and is shown after the first pulse. Shown is the mass below the escape velocity. The solid green line is for the default screening model, while the dashed red line is for the relativistic screening model. Top left: 70 M⊙, top right: 76 M⊙, bottom left: 88 M⊙, and bottom right: 89 M⊙. |
3.3. Nucleosynthesis of PISN
Figures 11 and 12 show the total ejected mass of isotopes as a function of the progenitor mass. The ejected mass includes mass ejected in the wind and in the individual pulses. Also shown in this figure is the relative difference of mass ejected between each model:
 (11)
(11)
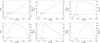 |
Fig. 11. Cumulative ejected mass of various isotopes as a function of the initial mass for nuclei up to and including 28Si. The solid greed line corresponds to models using extended screening, while the dashed lines correspond to models using relativistic screening. The dots are the relative difference in ejected mass between relativistic and extended screening computations. Top left: 4He, top middle: 12C, top right: 16O, bottom left: 20Ne, bottom middle: 24Mg, and bottom right: 28Si. |
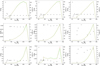 |
Fig. 12. Same as Fig. 11, except for nuclei heavier than 28Si. Top left: 32S, top middle: 36Ar, top right: 40Ca, middle left: 44Ti, center: 48Cr, middle right: 52Fe, bottom left: 54Fe, bottom middle: 56Fe, and bottom right: 56Ni. |
In the case of 4He, the difference in both models is not found to be significant. Nearly all of the 4He is ejected in the wind for all progenitors. For nuclei heavier than 4He, the ejected mass is significantly affected by the subsequent pulsations of the star.
For many of the models, it would appear that the amount of mass ejected in the relativistic model is largest relative to the amount of mass ejected in the extended model for a progenitor mass of ∼52 M⊙. This is probably because this progenitor undergoes the largest number of pulses, and more importantly, spends more time at a central temperature where relativistic effects are important. Here, it might not be surprising that burning will progress more rapidly to produce more species heavier than 12C at the stellar surface for progenitors which undergo more pulses. For progenitors with masses between 70 and 76 M⊙, there are several pulses, and the mass ejected per pulse is larger. This results in a larger amount of mass ejected as shown in Figs. 11 and 12 but increased burning beyond 24Mg results in a depletion of the lighter nuclei for higher-mass progenitors.
For nuclei heavier than 24Mg, very little mass is ejected unless the evolution results in a PISN, ejecting all of the mass in the star. Because much of the mass of these nuclei is confined to the core, and because the individual pulses proceeding a PPISN primarily eject surface layers, the heavy nuclei are maintained in the core of the star as it collapses into a BH. This is seen in the figure as a sharp increase in the ejected mass of 28Si and heavier for ∼90 M⊙. At a mass roughly equal to the cutoff between PPISNe and PISN, there is a sharp increase in the relative difference in ejected mass. This difference is particularly visible for the heavier nuclei and to a lesser extent for the lighter nuclei. This sharp increase corresponds to the very narrow range of progenitor mass which results in a PISN for a the relativistic model, but a PPISN in the extended model. For progenitors heavier than this cutoff in both models, the ratios are very close to zero as all of the stellar mass is ejected into the ISM after a very short increase in core temperature. Much of the production of heavier nuclei in stars undergoing PISNe is from hydrostatic burning at lower temperature.
For the Fe in the PISN region (Minitial ∼ 150 M⊙), the relativistic model ejects slightly less Fe than the extended model. However, only a very small amount of Fe is ejected in either model, and the difference is small. For direct collapse, progenitors with M ≥ 242 M⊙ eject no Fe as the star undergoes a direct collapse into a BH, and only lighter-mass nuclei are ejected in the wind prior to collapse.
In fact, it is seen that for the massive stars that undergo PISNe or direct collapse, there is little or no difference in the ejecta for all nuclei. This is because the stellar interior either does not reach a core temperature hot enough for relativistic screening to be significant, or the core temperature is hot for a very short period of time.
The progenitors in the mass region between 50 and 64 M⊙ are particularly interesting with regard to the production of nuclei less massive than 24Mg. Here the dynamics and interplay between the number of pulses, core temperature, surface ejecta, and the wind can be quite complicated. Relativistic screening for the 52 M⊙ model results in an increase in the ejection of lighter nuclei, with the largest enhancement for 20Ne (although it is important to note that only a very small amount of 20Ne is ejected by the 52 M⊙ model). However, for the 58 M⊙ model, there is a smaller amount of He, C, and O ejected for relativistic screening. This may be due to the enhanced burning of these nuclei as the star progresses to the production of more massive nuclei.
Figure 13 shows Kippenhahn diagrams for four representative models. Shown are the mass lines as a function of log(tcoll − t) where tcoll is the final collapse time. Each line in these diagrams corresponds to the location at which the mass fraction of the labeled isotope falls below 10−2. Also shown is the total stellar mass below the escape velocity. (Convective and burning zones are not shown for simplicity.) In the case of the 52 M⊙ and 58 M⊙ models, there is a significant convection zone after the first pulse starting at the boundary of the C/O layer. This is likely responsible for the rapidly changing behavior between these two models. In the relativistic model, the C layer extends to deeper in the star prior to collapse for the 52 M⊙ model, while it does not extend as deeply as that for the default screening formulation in the 58 M⊙ model. It can be seen in Fig. 11 that more C is ejected in the 52 M⊙ model if relativistic effects are considered, but less is ejected for the 58 M⊙ model. Similar results are seen for O.
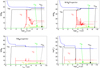 |
Fig. 13. Kippenhahn diagram comparison for four progenitors. Lines indicate the mass element at which the mass fraction of the indicated isotope falls below 10−2. The mass of each layer is indicated, along with the total mass of the star below the escape velocity. Dashed lines are for the relativistic model and solid lines are for the default screening model. Convective and burning regions have been removed for clarity. Top left: 52 M⊙, top right: 58 M⊙, bottom left: 70 M⊙, and bottom right: 76 M⊙. |
This emphasizes the complexity of nucleosynthesis within the PPISN model and the changes in rates between these two formulations of electron screening. Because the screening correction is density-dependent, rates in the relativistic screening model do not always exceed those of the default screening model. Furthermore, the pulse number, duration, shape, and quiescent period all vary between these formulations. While fewer pulses are expected to result in a lower ejected mass, a longer pulsational period (including weak pulses) can have the opposite effect.
4. Conclusions
A screening model was developed for MESA in which electron-positron charge density and distribution were treated in an environment in which pair-production is possible. Existing routines have been adapted to incorporate a new screening type for all MESA simulations.
As a first test of this model, relativistic screening for PPISNe and PISNe has been explored. Comparisons were made to prior models over a range of masses including low-mass He core progenitor stars, which undergo direct BH collapse; stars which undergo direct collapse after one or more thermal pulses; stars which explode in PISNe as every mass element exceeds the local escape velocity; and massive stars which undergo direct collapse.
The inclusion of relativistic screening was found to change the overall pulsational morphology and timing characteristics of the pulsational phase of the star. This is not surprising as relativistic screening is most prominent at higher temperatures. The pulsational phase of the star was found to achieve temperatures in the core and elsewhere of well over 150 keV, the cutoff temperature for relativistic screening. For masses near 44.5 M⊙, the unstable temperature oscillations were found to extend for a longer period of time prior to the final collapse of the star. It was also found that the boundary between PPISNe and PISNe occurs at lower mass. However, the shift in this boundary with mass insignificant in light of the other uncertainties in this model.
Because of the unstable nature of the pulsational phase of PPISNe, slight changes in the reaction rates and heating due to small changes in screening can result in changes in the timing characteristics of the pulses. A notable case is the 64 M⊙ model, for which the heating is more pronounced in the month prior to collapse. For other models, shifts in pulses, the appearance of weak pulses, and changes in the overall timing of the final pulses can result from the inclusion of relativistic screening.
The changes induced in the temperature characteristics of the pulsational phase can also affect the resulting nucleosynthesis slightly. Here, we examined the composition of material ejected in the winds and pulses. For stars that undergo total destruction in a PISN, little change was found in the composition of ejected mass between the default and the relativistic model. However, for resulting PPISNe, there could be changes in the total masses of ejected isotopic species as the total surface composition could vary with each model. For nuclei less massive than 28Si, differences in the ejected mass of specific species could exceed 200%. However, the total mass of light nuclei ejected by PPISNe is generally small. This reflects the effects of the steep mass profile within the star and how small differences in mass profiles at the surface can result in large relative changes in the total ejecta of one specie. For progenitors with masses 70 < M/M⊙ < 90, where mass loss from pulsation becomes significant, the ejected mass of light nuclei increases. In this region, the relative differences in the ejected mass of a particular specie is generally less than 10%.
For lighter progenitors, with M < 70 M⊙, the ejected mass can be quite small, ∼5 M⊙ or less for C and O. However the differences in the mass ejected can be more significant. It is as much as 40%(14%) for O(C) ejected by a 52 M⊙ star. Differences in the convection induced by heating differences in each model are also noted, as shown in Fig. 13.
The maximum BH mass formed in this study, which is produced by a ∼70 M⊙ He core, was found to vary little by the addition of relativistic screening. At higher progenitor masses, the resultant BH mass was found to increase by roughly 0.5 M⊙. However, this increase is probably negligible given the uncertainties of the model used. Though the changes in rates induced by a relativistic treatment of screening change the BH mass only slightly, the resultant composition of the ejecta, being sensitive to the surface composition, was found to vary somewhat for lighter progenitors and lighter stars. While this may not significantly change models for late time galactic chemical evolution, it may be worth exploring the effects of changes in the galactic chemical evolution of the early galaxy from the possible nucleosynthesis in Pop III stars which undergo PPISNe.
Finally, we emphasize that the model presented here applies to weak Debye screening only, in which the temperature is relatively high, the density is relatively low, or both. The effects of our model, however, apply to nearly the entire star in this case, as the weak screening parameters are used in computing intermediate screening, with a higher density or lower temperature. Thus, our screening model would influence nuclear reaction rates throughout nearly the entire star at all stages in the evolution of the star. Though the overall effects on PPISNe and PISNe were found to be small, the overall effects on the pulse morphology and nucleosynthesis were compelling. The additions made to the MESA code could be useful for this environment and other astrophysical plasmas in which the temperature T9 ≳ 1.
Acknowledgments
T.K. is supported in part by Grants-in-Aid for Scientific Research of JSPS (17K05459, 20K03958). A.B.B. is supported in part by the U.S. National Science Foundation Grants No. PHY-2020275 and PHY-2108339. M.A.F. is supported by National Science Foundation Grant No. PHY-1712832 and by NASA Grant No. 80NSSC20K0498. K.M. is supported by Research Institute of Stellar Explosive Phenomena at Fukuoka University. M.A.F., G.J.M. and A.B.B. acknowledge support from the NAOJ Visiting Professor program. Work at the University of Notre Dame (G.J.M.) supported by DOE nuclear theory grant DE-FG02-95-ER40934.
References
- Abbott, B. P., Abbott, R., Abbott, T. D., et al. 2016, ApJ, 818, L22 [Google Scholar]
- Abbott, B. P., Abbott, R., Abbott, T. D., et al. 2019, Phys. Rev. X, 9, 031040 [Google Scholar]
- Abbott, R., Abbott, T. D., Abraham, S., et al. 2020a, Phys. Rev. Lett., 125, 101102 [Google Scholar]
- Abbott, R., Abbott, T. D., Abraham, S., et al. 2020b, ApJ, 900, L13 [NASA ADS] [CrossRef] [Google Scholar]
- Adelberger, E. G., Austin, S. M., Bahcall, J. N., et al. 1998, Rev. Mod. Phys., 70, 1265 [NASA ADS] [CrossRef] [Google Scholar]
- Alastuey, A., & Jancovici, B. 1978, ApJ, 226, 1034 [NASA ADS] [CrossRef] [Google Scholar]
- Belczynski, K., Heger, A., Gladysz, W., et al. 2016, A&A, 594, A97 [NASA ADS] [CrossRef] [EDP Sciences] [Google Scholar]
- Boyd, R. N. 2008, An Introduction to Nuclear Astrophysics (The University of Chicago Press: London) [CrossRef] [Google Scholar]
- Chan, C., Müller, B., Heger, A., Pakmor, R., & Springel, V. 2018, ApJ, 852, L19 [NASA ADS] [CrossRef] [Google Scholar]
- Clayton, D. D. 1983, Principles of Stellar Evolution and Nucleosynthesis (Chicago: The University of Chicago Press), 357 [Google Scholar]
- Croon, D., McDermott, S. D., & Sakstein, J. 2020, Phys. Rev. D, 102, 115024 [NASA ADS] [CrossRef] [Google Scholar]
- Dewitt, H. E., Graboske, H. C., & Cooper, M. S. 1973, ApJ, 181, 439 [Google Scholar]
- Famiano, M. A., Balantekin, A. B., & Kajino, T. 2016, Phys. Rev. C, 93, 045804 [NASA ADS] [CrossRef] [Google Scholar]
- Famiano, M., Balantekin, A. B., Kajino, T., et al. 2020, ApJ, 898, 163 [NASA ADS] [CrossRef] [Google Scholar]
- Farmer, R., Renzo, M., de Mink, S. E., Marchant, P., & Justham, S. 2019, ApJ, 887, 53 [Google Scholar]
- Fryer, C. L. 1999, ApJ, 522, 413 [NASA ADS] [CrossRef] [Google Scholar]
- Graboske, H. C., Dewitt, H. E., Grossman, A. S., & Cooper, M. S. 1973, ApJ, 181, 457 [Google Scholar]
- Heger, A., & Woosley, S. E. 2002, ApJ, 567, 532 [Google Scholar]
- Ichimaru, S. 1993, Rev. Mod. Phys., 65, 255 [NASA ADS] [CrossRef] [Google Scholar]
- Iliadis, C. 2007, Nuclear Physics of Stars (Weinheim: Wiley-VCH Verlag GmbH & Co.) [CrossRef] [Google Scholar]
- Itoh, N., Totsuji, H., & Ichimaru, S. 1977, ApJ, 218, 477 [NASA ADS] [CrossRef] [Google Scholar]
- Itoh, N., Totsuji, H., Ichimaru, S., & Dewitt, H. E. 1979, ApJ, 234, 1079 [NASA ADS] [CrossRef] [Google Scholar]
- Itoh, N., Hayashi, H., Nishikawa, A., & Kohyama, Y. 1996, ApJS, 102, 411 [NASA ADS] [CrossRef] [Google Scholar]
- Jancovici, B. 1977, J. Stat. Phys., 17, 357 [NASA ADS] [CrossRef] [Google Scholar]
- Kapusta, J. I., & Gale, C. 2006, Finite-Temperature Field Theory: Principles and Applications (Cambridge University Press: Cambridge) [CrossRef] [Google Scholar]
- Kozyreva, A., Gilmer, M., Hirschi, R., et al. 2017, MNRAS, 464, 2854 [NASA ADS] [CrossRef] [Google Scholar]
- Kravchuk, P. A., & Yakovlev, D. G. 2014, Phys. Rev. C, 89, 015802 [NASA ADS] [CrossRef] [Google Scholar]
- Kuroda, T., Kotake, K., Takiwaki, T., & Thielemann, F.-K. 2018, MNRAS, 477, L80 [NASA ADS] [CrossRef] [Google Scholar]
- Leung, S.-C., Nomoto, K., & Blinnikov, S. 2019, ApJ, 887, 72 [Google Scholar]
- Liu, J.-J. 2016, Res. Astron. Astrophys., 16, 83 [Google Scholar]
- Marchant, P., Renzo, M., Farmer, R., et al. 2019, ApJ, 882, 36 [Google Scholar]
- Meyer, B. S., & Adams, D. C. 2007, Meteorit. Planet. Sci. Suppl., 42, 5215 [NASA ADS] [Google Scholar]
- Paxton, B., Bildsten, L., Dotter, A., et al. 2011a, ApJS, 192, 3 [Google Scholar]
- Paxton, B., Bildsten, L., Dotter, A., et al. 2011b, ApJS, 192, 3 [Google Scholar]
- Paxton, B., Marchant, P., Schwab, J., et al. 2015, ApJS, 220, 15 [Google Scholar]
- Paxton, B., Schwab, J., Bauer, E. B., et al. 2018, ApJS, 234, 34 [NASA ADS] [CrossRef] [Google Scholar]
- Potekhin, A. Y., & Chabrier, G. 2013, Contrib. Plasma Phys., 53, 397 [NASA ADS] [CrossRef] [Google Scholar]
- Quarati, P., & Scarfone, A. M. 2007, ApJ, 666, 1303 [NASA ADS] [CrossRef] [Google Scholar]
- Sahoo, B. K., & Das, M. 2016, Eur. Phys. J. D, 70, 270 [NASA ADS] [CrossRef] [Google Scholar]
- Sakstein, J., Croon, D., McDermott, S. D., Straight, M. C., & Baxter, E. J. 2020, Phys. Rev. Lett., 125, 261105 [NASA ADS] [CrossRef] [Google Scholar]
- Salpeter, E. E. 1954, Aust. J. Phys., 7, 373 [Google Scholar]
- Salpeter, E. E., & van Horn, H. M. 1969, ApJ, 155, 183 [NASA ADS] [CrossRef] [Google Scholar]
- Shalybkov, D. A., & Yakovlev, D. G. 1987, Astrophysics, 27, 562 [Google Scholar]
- Shaviv, G., & Shaviv, N. J. 2000, ApJ, 529, 1054 [NASA ADS] [CrossRef] [Google Scholar]
- Spera, M., & Mapelli, M. 2017, MNRAS, 470, 4739 [Google Scholar]
- Spitaleri, C., Bertulani, C., Fortunato, L., & Vitturi, A. 2016, Phys. Lett. B, 755, 275 [NASA ADS] [CrossRef] [Google Scholar]
- Takahashi, K., Yoshida, T., & Umeda, H. 2018, ApJ, 857, 111 [NASA ADS] [CrossRef] [Google Scholar]
- Toro, E. F., Spruce, M., & Speares, W. 1994, Shock Waves, 4, 25 [Google Scholar]
- van Son, L. A. C., De Mink, S. E., Broekgaarden, F. S., et al. 2020, ApJ, 897, 100 [Google Scholar]
- Wallace, R. K., Woosley, S. E., & Weaver, T. A. 1982, ApJ, 258, 696 [NASA ADS] [CrossRef] [Google Scholar]
- Wang, B., Bertulani, C. A., & Balantekin, A. B. 2011, Phys. Rev. C, 83, 018801 [NASA ADS] [CrossRef] [Google Scholar]
- Woosley, S. E. 2017, ApJ, 836, 244 [Google Scholar]
- Woosley, S. E. 2019, ApJ, 878, 49 [Google Scholar]
- Woosley, S. E., & Heger, A. 2021, ApJ, 912, L31 [NASA ADS] [CrossRef] [Google Scholar]
- Woosley, S. E., Blinnikov, S., & Heger, A. 2007, Nature, 450, 390 [NASA ADS] [CrossRef] [PubMed] [Google Scholar]
- Wu, Y., & Pálffy, A. 2017, ApJ, 838, 55 [NASA ADS] [CrossRef] [Google Scholar]
All Figures
|
Fig. 1. Screening enhancement factors for four major reactant pairs as a function of density at kT = 150 keV and Ye = 0.5. The density at which all SEFs are equal is temperature dependent. (Top left:12C+α, top right:16O+α, bottom left:12C+12C, bottom right:16O+16O.) Solid lines indicate classical screening; red, dashed lines indicate relativistic screening; and blue, dotted lines indicate the relativistic approximation. |
| In the text | |
|
Fig. 2. Evaluation of the error and applicability of various screening lengths for a 70 M⊙ He core progenitor. Each point in the figures corresponds to an individual mass-time coordinate in the overall evolution of this model from the start of the simulation to the final collapse. Top left: calculated screening length for the entire evolution of the star. The transition from relativistic screening to classical screening occurs at a temperature of 150 keV. The points mesh seamlessly here. Top right: the relative uncertainty between the approximation of Eq. (8) and the exact numerically calculated screening length. Bottom left: the screening length computed using the approximation of Eq. (8) for kT > 150 keV. Bottom right: the exact numerically calculated screening length for kT > 150 keV. |
| In the text | |
|
Fig. 3. Left: relative error in relativistic Debye length using the approximation of Eq. (8). Right: relative error in relativistic Debye length for individual zones in the MESA evolution for a 70 M⊙ He progenitor as a function of time prior to collapse. Each dot in the figure is a mass element at a specific time step. Only times at which T > 150 keV and mass elements for which weak or intermediate relativistic screening is appropriate are shown. |
| In the text | |
|
Fig. 4. Left: ratio of classical to relativistic electron screening lengths for the weak and intermediate screening as a function of temperature and electron density. Right: ratio of classical to electron screening lengths for a 70 M⊙ model evolution. The time is shown as time before final collapse. Each dot is a mass element and a time step. In the figure, values less than unity are blue, while those greater than unity are green. |
| In the text | |
|
Fig. 5. Logarithm of central temperature, log Tc versus time for various progenitor models. The solid green lines correspond to the default screening model, and the dashed red lines correspond to the relativistic screening model. Top left: 70 M⊙, (top right) 76 M⊙, (bottom left) 89 M⊙, and (bottom right) 89.02 M⊙ |
| In the text | |
|
Fig. 6. Logarithm of central temperature showing detail of the first pulse for several progenitors. The lines are the same as in Fig. 5. Top left: 44.5 M⊙, top right: 45 M⊙, middle left: 70 M⊙, middle right: 76 M⊙, bottom left: 89 M⊙, and bottom right: 89.02 M⊙. |
| In the text | |
|
Fig. 7. Detail of central temperature for three progenitor models for both default (solid green lines) and relativistic (dashed red lines) screening rates. Top left: 52 M⊙, top right: 58 M⊙, bottom left: 64 M⊙, and bottom right: 70 M⊙. The relativistic screening case has been offset by 6.82 yr for the 52 M⊙ model and by −2.79 × 10⁴ s for the 70 M⊙ model so that both evolution plots can fall within the same range. |
| In the text | |
|
Fig. 8. Left: time elapsed between initial pulse and final progenitor collapse or explosion as a function of initial mass. Right: cumulative time for which the core temperature kT > 150 keV as a function of initial mass. The solid green lines correspond to extended screening calculations. The red dashed lines correspond to relativistic screening calculations. The dotted black lines are the relative time difference between relativistic screening and default screening. |
| In the text | |
|
Fig. 9. Left: resultant BH mass versus He core progenitor mass for models including the extended screening and relativistic screening. The PPISN-PISN cutoff lies between 89.02 M⊙ and 89.05 M⊙ for the default screening model and between 89 M⊙ and 89.02 M⊙ for the relativistic screening model. Green circles correspond to default screening, and red squares correspond to relativistic screening. Right: relative shift in the resultant BH mass when relativistic screening is used compared to the default screening model. |
| In the text | |
|
Fig. 10. Stellar mass as a function of time. Evolution is tracked as the logarithm of the time before final collapse and is shown after the first pulse. Shown is the mass below the escape velocity. The solid green line is for the default screening model, while the dashed red line is for the relativistic screening model. Top left: 70 M⊙, top right: 76 M⊙, bottom left: 88 M⊙, and bottom right: 89 M⊙. |
| In the text | |
|
Fig. 11. Cumulative ejected mass of various isotopes as a function of the initial mass for nuclei up to and including 28Si. The solid greed line corresponds to models using extended screening, while the dashed lines correspond to models using relativistic screening. The dots are the relative difference in ejected mass between relativistic and extended screening computations. Top left: 4He, top middle: 12C, top right: 16O, bottom left: 20Ne, bottom middle: 24Mg, and bottom right: 28Si. |
| In the text | |
|
Fig. 12. Same as Fig. 11, except for nuclei heavier than 28Si. Top left: 32S, top middle: 36Ar, top right: 40Ca, middle left: 44Ti, center: 48Cr, middle right: 52Fe, bottom left: 54Fe, bottom middle: 56Fe, and bottom right: 56Ni. |
| In the text | |
|
Fig. 13. Kippenhahn diagram comparison for four progenitors. Lines indicate the mass element at which the mass fraction of the indicated isotope falls below 10−2. The mass of each layer is indicated, along with the total mass of the star below the escape velocity. Dashed lines are for the relativistic model and solid lines are for the default screening model. Convective and burning regions have been removed for clarity. Top left: 52 M⊙, top right: 58 M⊙, bottom left: 70 M⊙, and bottom right: 76 M⊙. |
| In the text | |
Current usage metrics show cumulative count of Article Views (full-text article views including HTML views, PDF and ePub downloads, according to the available data) and Abstracts Views on Vision4Press platform.
Data correspond to usage on the plateform after 2015. The current usage metrics is available 48-96 hours after online publication and is updated daily on week days.
Initial download of the metrics may take a while.