Fig. 8.
Download original image
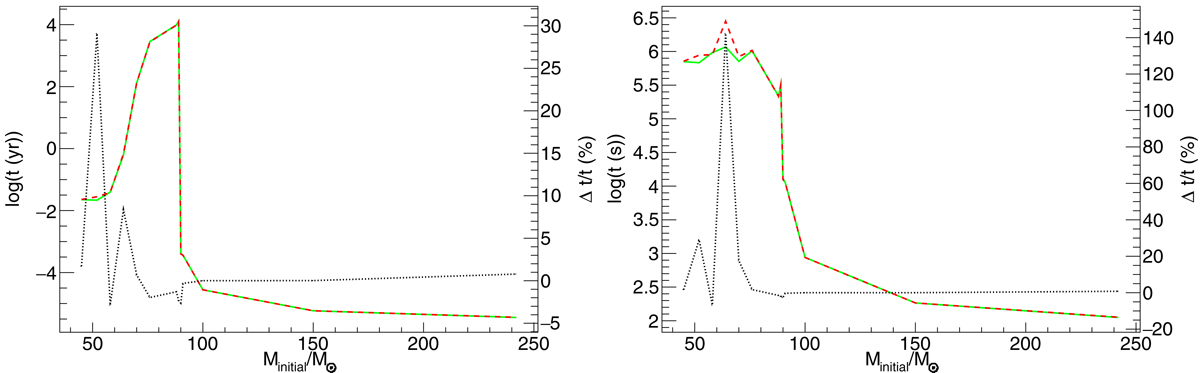
Left: time elapsed between initial pulse and final progenitor collapse or explosion as a function of initial mass. Right: cumulative time for which the core temperature kT > 150 keV as a function of initial mass. The solid green lines correspond to extended screening calculations. The red dashed lines correspond to relativistic screening calculations. The dotted black lines are the relative time difference between relativistic screening and default screening.
Current usage metrics show cumulative count of Article Views (full-text article views including HTML views, PDF and ePub downloads, according to the available data) and Abstracts Views on Vision4Press platform.
Data correspond to usage on the plateform after 2015. The current usage metrics is available 48-96 hours after online publication and is updated daily on week days.
Initial download of the metrics may take a while.