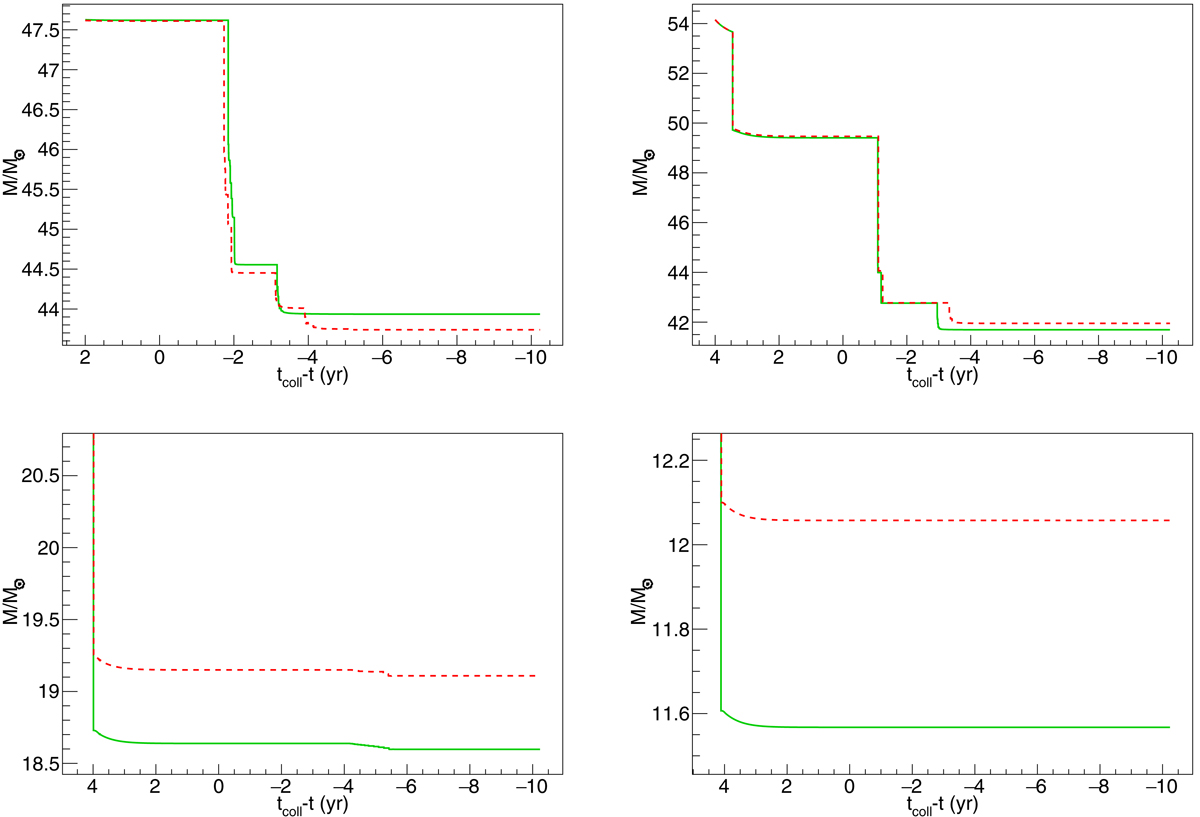
Fig. 10.
Download original image
Stellar mass as a function of time. Evolution is tracked as the logarithm of the time before final collapse and is shown after the first pulse. Shown is the mass below the escape velocity. The solid green line is for the default screening model, while the dashed red line is for the relativistic screening model. Top left: 70 M⊙, top right: 76 M⊙, bottom left: 88 M⊙, and bottom right: 89 M⊙.
Current usage metrics show cumulative count of Article Views (full-text article views including HTML views, PDF and ePub downloads, according to the available data) and Abstracts Views on Vision4Press platform.
Data correspond to usage on the plateform after 2015. The current usage metrics is available 48-96 hours after online publication and is updated daily on week days.
Initial download of the metrics may take a while.