| Issue |
A&A
Volume 659, March 2022
|
|
|---|---|---|
| Article Number | A169 | |
| Number of page(s) | 18 | |
| Section | Galactic structure, stellar clusters and populations | |
| DOI | https://doi.org/10.1051/0004-6361/202142134 | |
| Published online | 22 March 2022 | |
On the dynamical evolution of Cepheids in star clusters⋆
1
Astronomical Institute, Faculty of Mathematics and Physics, Charles University, V Holešovičkách 2, 180 00 Praha 8, Czech Republic
e-mail: This email address is being protected from spambots. You need JavaScript enabled to view it.
, This email address is being protected from spambots. You need JavaScript enabled to view it.
2
Institute of Physics, Laboratory of Astrophysics, École Polytechnique Fédérale de Lausanne (EPFL), Observatoire de Sauverny, 1290 Versoix, Switzerland
e-mail: This email address is being protected from spambots. You need JavaScript enabled to view it.
3
Helmholtz-Institut für Strahlen- und Kernphysik, University of Bonn, Nussallee 14-16, 53115 Bonn, Germany
Received:
2
September
2021
Accepted:
6
December
2021
Abstract
We investigated the occurrence of classical (type-I) Cepheid variable stars (henceforth Cepheids) in dynamically evolving star clusters from birth to an age of approximately 300 Myr. The clusters are modelled by the Aarseth code NBODY6, and they feature a realistic stellar initial mass function and initial binary star population, single star and binary star evolution, expulsion of the primordial gas, and tidal field of the galaxy. Our simulations provide the first detailed dynamical picture of how frequently Cepheids remain gravitationally bound to their birth clusters versus how frequently they occur in the field. They allow us to quantify the relevance of various cluster ejection mechanisms and how they depend on stellar mass. Overall, the simulations agree with the empirical picture that a small fraction (≈10%) of Cepheids reside in clusters, that cluster halo membership is relatively common, and that the majority of Cepheid hosting clusters only have a single Cepheid member. Additionally, the simulations predict that (a) Cepheid progenitors are much more likely to escape from low-mass than higher mass clusters; (b) higher-mass (long-period) Cepheids are ≈30% more likely to be found in clusters than low-mass (short-period) Cepheids; (c) the clustered Cepheid fraction increases with galactocentric radius since cluster dispersal is less efficient at greater radii; (d) a lower metallicity reduces the overall clustered Cepheid fraction because the lower minimum mass of Cepheids leaves more time for cluster dispersal (this primarily affects short-period Cepheids); and (e) high-mass clusters are much more likely to have more than one Cepheid member at any given time, in particular at a lower metallicity. We interpret the results as outcomes of various aspects of star cluster dynamics. The comparison of predicted and observed clustered Cepheid fractions, fCC, highlights the need for additional cluster disruption mechanisms, most likely encounters with giant molecular clouds, to explain the observed fractions.
Key words: galaxies: stellar content / open clusters and associations: general / stars: variables: Cepheids / stars: kinematics and dynamics
Movies are available at https://www.aanda.org
© ESO 2022
1. Introduction
Classical Cepheids occurring in star clusters (henceforth clustered Cepheids) are doubly important objects for stellar physics and cosmology (via the distance scale) because both their pulsations and their host cluster’s member stars provide stringent tests of stellar models and allow us to calibrate the Leavitt law (Leavitt & Pickering 1912, LL, period-luminosity relation). The identification of Cepheids in clusters was initially a one-by-one procedure (Irwin 1955; Kholopov 1956; Sandage 1958) and required painstaking reddening corrections (e.g. Turner 1976; Turner & Burke 2002, and references therein) before large amounts of high-quality astrometric data became available. Anderson et al. (2013) adopted a new strategy for systematically and quantitatively establishing the membership of Cepheids in Milky Way (MW) open star clusters using eight-dimensional phase-space information with an eye on the Gaia mission launched in December 2013 (Gaia Collaboration 2016). Gaia’s unprecedented astrometric census greatly facilitates the identification of MW star clusters based chiefly on proper motion clustering (e.g. Cantat-Gaudin et al. 2018; Castro-Ginard et al. 2020), while ground- and space-based time-domain surveys (e.g. Pawlak et al. 2019; Soszyński et al. 2020; Holl et al. 2018; Ripepi et al. 2019) considerably increased the number of MW Cepheid candidates. This combination has led to reassessments of cluster membership as well as several new interesting cluster Cepheid candidates (Medina et al. 2021; Zhou & Chen 2021). However, a main limitation of such modern astro-statistical approaches is the formulation of prior probabilities based on (2D) on-sky locations. Understanding how and how frequently Cepheids occur in star clusters or their halos would significantly help to improve the reliability of such priors.
The overall empirical result of such studies has been that (a) the vast majority of Cepheids do not reside in clusters and the clustered Cepheid fraction fCC, true ≲ 10% (Anderson & Riess 2018; b) MW clusters that do host Cepheids generally contain a single, occasionally two (e.g. Dékány et al. 2015), and at the very most three Cepheids (Majaess et al. 2013; Anderson et al. 2013; Medina et al. 2021, NGC 7790); (c) a sizeable fraction of reported MW cluster Cepheids are located in the distant outskirts (halos) of the putative host clusters (Anderson et al. 2013; Zhou & Chen 2021; Medina et al. 2021); and (d) fCC, true is generally higher for the younger long-period Cepheids (Anderson & Riess 2018). The most significant exceptions to this rule are very massive (≈5 × 10⁴ M⊙) clusters in the Large Magellanic Cloud (LMC), such as NGC 1866 or NGC 2031, that each contain up to 24 Cepheids, most of them with a fairly short period (Testa et al. 2007; Musella et al. 2016).
The identification of clustered Cepheids becomes increasingly difficult at distances beyond 100 kpc both because the detection of the main sequence in the clusters becomes more difficult and because the angular resolution element of a detector corresponds to increasingly larger physical scales. Blending Cepheids with cluster member stars depresses observed photometric amplitudes and alters light curve shapes, thus precluding the detection of Cepheids occurring in massive clusters (Ferrarese et al. 2000; Riess et al. 2020). This results in a lower observed effective clustered extragalactic Cepheid fraction, fCC, eff, compared to the true number of clustered extragalactic Cepheids, and any uncertainties in fCC, eff affect stellar association bias corrections for the distance ladder linearly (Anderson & Riess 2018). Understanding the difference between fCC, eff and fCC, true and possible variations in fCC among different galaxies will be valuable for improving distance measurements based on Cepheids (Anderson & Riess 2018). Providing a better astrophysical understanding of how Cepheids relate to their (former) host clusters further aids the calibration of the LL, which can be significantly improved by adopting precise average cluster parallaxes for LL calibration (Breuval et al. 2020).
The occurrence of clustered Cepheids is intimately related to star cluster dynamics because most stars are thought to be born in young embedded clusters (Lada et al. 1991; Kroupa 1995a; Lada & Lada 2003; Porras et al. 2003; Megeath et al. 2016) that evolve dynamically over time, maintaining some imprints of the initial dynamical interactions within their dense birth environments. Following star cluster formation, these objects relax and mass segregate (e.g. Spitzer 1969; Bonnell & Davies 1998; Mouri & Taniguchi 2002; McMillan et al. 2007; Spera et al. 2016), eject stars either in close interactions of three or more stars (e.g. Aarseth 1971; Heggie 1975; Perets & Šubr 2012; Tanikawa et al. 2012; Oh et al. 2015) or as a result of a decay of primordial triples and quadruples (e.g. Sterzik & Durisen 1998; Goodwin & Kroupa 2005; Pflamm-Altenburg & Kroupa 2006; Wang et al. 2019), and evaporate stars as the result of weak encounters between stars (e.g. Küpper et al. 2008, 2010). The loss of stars from clusters is enhanced by the tidal field of the cluster hosting galaxy (Baumgardt et al. 2002; Baumgardt & Makino 2003; Sollima 2020) and by removal of the residual gas which was not consumed in the star forming process (e.g. Lada et al. 1984; Kroupa et al. 2001; Baumgardt & Kroupa 2007). The remaining fraction of stars that resides within their birth clusters then decreases as a function of age (assuming a constant star formation rate), as is observed for clustered Cepheids in the MW, LMC, Small Magellanic Cloud (SMC), and M 31 (Anderson & Riess 2018, their Fig. 13). Such a dynamical picture also explains the occurrence and aids the discovery of extended tidal tails of clusters dissolving into the MW field population (e.g. Röser et al. 2019; Meingast & Alves 2019; Jerabkova et al. 2021). It may also help to confront predicted period-age relations (Bono et al. 2005; Anderson et al. 2016) to observations (Senchyna et al. 2015; Medina et al. 2021) because the dynamical timescale is independent of the assumptions or input physics of stellar models. This is particularly interesting, since Cepheid period-age relations are important to trace Galactic evolution even though the ages of Cepheids depend by nearly a factor of two on the effects of main-sequence rotation (Anderson et al. 2016).
To address the above issues, we computed an extensive library of N-body cluster simulations to investigate cluster dispersal over a timescale of up to 300 Myr. In this first paper of a series exploiting these simulations, we present the computed library and its predictions concerning the occurrence of Cepheids in star clusters for different cluster masses, chemical composition, and galactocentric radius. Of course, cluster dynamics also impacts the orbital parameters of primordial binary stars (Kroupa 1995b; Oh & Kroupa 2016), and Cepheids are particularly likely to have experienced binary interactions, since the close orbital configurations observed among their progenitors (B-type main sequence stars) must adapt to the significant evolutionary increase in radius (typical Cepheid radii 20 − 200 R⊙). Elucidating the nature and frequency of these binary interactions is crucial for the forward modelling of populations of Cepheids and for understanding the intriguing hierarchy of multiple star systems hosting Cepheids (Evans et al. 2020). Paper II of this series will focus on such effects (Dinnbier et al., in prep.).
This article is structured as follows. Section 2 describes the set up of the simulations, initial conditions, and other choices made to create the cluster library. Section 3 presents how Cepheids are identified and traced in the NBODY6 simulations. Section 4 investigates the evolution and occurrence of Cepheids in dynamically evolving star clusters as a function of the cluster mass, metallicity, and galactocentric radius. Section 5 seeks to estimate the number of Cepheids occurring in clusters, fCC, true, and establishes upper and lower limits based on the N-body simulations. The discussion in Sect. 6 focuses on the impact of gas expulsion, initial conditions, and the role of molecular clouds. The final section, Sect. 7 summarises our results and conclusions.
2. Numerical methods and initial conditions
2.1. Numerics
The cluster simulations presented in this work are calculated by use of the Aarseth code NBODY6 (Aarseth 1999, 2003). The code integrates stellar trajectories with a fourth-order Hermite predictor-corrector scheme (Makino 1991) with individual block time steps coupled to the Ahmad-Cohen method (Ahmad & Cohen 1973; Makino & Aarseth 1992). Stellar evolution is treated by stellar evolutionary tracks due to Tout et al. (1996) and Hurley et al. (2000). To tackle the enormous range of relevant timescales, NBODY6 employs various sophisticated numerical tools such as two-body (Kustaanheimo & Stiefel 1965), three-body (Aarseth & Zare 1974), and multiple-body (Mikkola & Aarseth 1990) regularisation, which include the dynamical formation of these systems, exchanges, and ionisations. The regularisation techniques typically transform the coordinates to a four-dimensional space, and they utilise the properties of the Levi-Civita matrix (Kustaanheimo & Stiefel 1965; Bettis & Szebehely 1971; Stiefel & Scheifele 1975). The code initiates or terminates a particular regularisation technique according to given criteria. Not all compact systems are necessarily regularised. For example, unperturbed hierarchical systems are evolved as single bodies until an external perturbation or stellar evolution within the hierarchy necessitates an update of the system internal conditions (Mardling & Aarseth 1999). During regularisation, the code approximates binary star evolution with Roche-lobe mass transfer (Eggleton 1983; Hurley et al. 2002). Stellar evolution produces compact objects, and it also handles the products of stellar mergers (Kochanek 1992). We refer the reader to Aarseth (2003) for an in-depth description of relevant algorithms.
We assume that all stars are formed in embedded star clusters containing a substantial reservoir of unprocessed gas at the time of massive star formation. The gas is expelled due to feedback from massive stars, and the sudden change of the gravitational potential of the expelled gas affects the dynamics of the star cluster, which expands and loses a substantial fraction of its stars (Lada et al. 1984; Goodwin 1997; Geyer & Burkert 2001; Kroupa et al. 2001). To limit the number of free parameters, we adopted the gas expulsion model by Kroupa et al. (2001), where the gravitational potential ϕgas(r, t) of the gas is represented by a Plummer sphere that starts to exponentially decrease after a delay time td, that is,
 (1)
(1)
In the gas model, G, Mgas, agas, and τM denote the gravitational constant, initial mass of the gas component of the embedded star cluster, the Plummer length parameter of the gas component, and the gas expulsion timescale, respectively. For the parameters of the gas expulsion model, we adopted the values that seem to be the most promising according to current understanding of embedded star clusters (Kroupa et al. 2001; Lada & Lada 2003; Kuhn et al. 2014; Banerjee & Kroupa 2017). We adopted agas = aecl, where aecl is the Plummer length parameter of stars, Mgas = 2 Mecl, where Mecl is the initial stellar mass of the embedded cluster (this implies the star formation efficiency SFE ≡ Mecl/(Mecl + Mgas) = 1/3), τM = agas/cII ≈ 0.03 Myr, where cII = 10 km s−1 is the sound speed in ionised hydrogen, and td = 0.6 Myr is approximately the lifetime of the ultra-compact HII region in its deeply embedded phase.
The simulated clusters orbited a Milky Way-like galaxy on circular trajectories. The escaping stars were integrated in the gravitational field of the galaxy, so they form tidal tails, and stellar evolution was followed also in the tidal tails. The gravitational potential of the galaxy was represented by the model of Allen & Santillan (1991), which consists of three components: the bulge modelled as a Plummer potential of mass 1.4 × 10¹⁰ M⊙ and scale length 0.38 kpc; the stellar disc modelled as a Miyamoto-Nagai (Miyamoto & Nagai 1975) potential of mass 8.5 × 10¹⁰ M⊙ and radial and vertical scale lengths 5.3 kpc and 0.25 kpc, respectively; and a dark matter halo of a two-component potential that is nearly logarithmic at large galactocentric distances, and which encompasses a mass of 8 × 10¹¹ M⊙ within a sphere of 100 kpc radius. The particular form of the galactic potential has likely negligible influence on the results, as we discuss in Sect. 6.3.
2.2. Initial conditions
The clusters were generated by the software package MCLUSTER (Küpper et al. 2011) as Plummer models of stellar mass Mecl and Plummer parameter aecl. Employing the relation between the embedded cluster radius and its mass in stars (Marks & Kroupa 2012),
 (2)
(2)
we reduced the two-parameter space (Mecl, aecl) to a one-parameter family of models characterised by cluster mass Mecl. The clusters were initially in virial equilibrium with the primordial gas. The stars were populated to the cluster according to the recipe of Aarseth et al. (1974), where the position is generated first from the cluster mass profile, whereupon the absolute value of the velocity is drawn from the velocity distribution at the given cluster radius from the Plummer distribution function, and the direction of the velocity vector is oriented randomly. The clusters were initially not mass segregated.
The initial masses of stars were sampled from the model of the stellar initial mass function (IMF) given by Kroupa (2001), where the maximum allowed stellar mass, mmax, within the cluster is a function of Mecl according to the mmax − Mecl relation (Weidner et al. 2010). Thus, only massive clusters harboured the most massive stars. The minimum stellar mass was 0.08 M⊙. All stars formed in binaries with orbital parameters for stars of < 3 M⊙ according to the initial distribution function for periods, eccentricities and mass ratios of Kroupa (1995b), and more massive stars (> 3 M⊙) according to the binary properties of O stars (Sana et al. 2012; Moe & Di Stefano 2017). The method describing how to generate a realistic initial binary population without affecting the IMF is due to Oh et al. (2015) and Oh & Kroupa (2016). Since the evolution of the binaries is the focus of paper II, the details of the initial binary population and the evolution processes are provided there.
2.3. Assumptions about the embedded cluster mass function
There is observational evidence that the embedded cluster mass function (ECMF) in the Galaxy (e.g. Lada & Lada 2003; de la Fuente Marcos & de la Fuente Marcos 2004) as well as in more distant galaxies (e.g. Whitmore et al. 1999; Bik et al. 2003; Gieles et al. 2006) can be approximated by a power law of slope −2, that is,
 (3)
(3)
where dNecl(Mecl) is the number of embedded star clusters forming in a mass bin of size dMecl.
Our models span a cluster mass range of Mecl ∈ (50 M⊙, 6400 M⊙), where the lower mass limit follows from the mmax − Mecl relation, which requires mmax ≳ mmin, Ceph, and the upper mass limit is comparable to the mass of the most massive young star clusters observed in the galaxy M 31 (≈8.5 × 10³ M⊙; Johnson et al. 2017). The dependence  has the convenient property that the total mass of clusters in each logarithmic mass bin of constant size contains an identical total mass of clusters regardless of Mecl.
2.4. The library of simulations
The cluster masses, Mecl, span the range of 50 M⊙ to 6400 M⊙, and they are sampled by multiples of 2; that is Mecl = 50 M⊙, 100 M⊙, …, 6400 M⊙. The models are listed in Table 1. We ran each model Nmod times with different random seeds for stellar masses, positions, and velocities, where Nmod = 2i and i is the index after the model name; for instance, models M4 have Nmod = 16. We chose these values of Nmod to have the same total mass of star clusters in each logarithmic cluster mass bin dMecl when used with the ECMF of Eq. (3). This facilitates the calculation of any quantity ⟨q⟩ for the whole population of clusters (and thus its observed value integrated over a galaxy) as  , where qi is the quantity of interest and wi the relevant weighting factor (e.g. number of all Cepheids originating in all clusters of index i1).
List of star cluster models.
We calculated the population of clusters described in the previous paragraph for three galactocentric radii: Rg = 4 kpc, Rg = 8 kpc, and Rg = 12 kpc for solar metallicity; that is, Z = 0.014. We also calculated the same population of clusters for a galactocentric radius of Rg = 8 kpc and sub-solar metallicities of Z = 0.006 and Z = 0.002. Thus, for each considered choice of Rg and Z, we calculated 510 simulations in total.
3. Identification of Cepheids
Isolated stars with zero age main sequence (ZAMS) mass in the appropriate mass range (mmin, Ceph, mmax, Ceph) enter the Cepheid instability strip in the course of their evolution. Present models take into account the metallicity dependence of both the stellar evolutionary tracks (Hurley et al. 2000) and the borders of the instability strip for Cepheid stars (Anderson et al. 2016). They provide the mass range for Cepheids as follows: (mmin, Ceph, mmax, Ceph) = (3.2 M⊙, 11.0 M⊙) for Z = 0.002, (mmin, Ceph, mmax, Ceph) = (4.0 M⊙, 12.0 M⊙) for Z = 0.006, and (mmin, Ceph, mmax, Ceph) = (4.7 M⊙, 13.0 M⊙) for Z = 0.014. For the purpose of this work, we term all stars with initial mass in the range of (mmin, Ceph, mmax, Ceph) prospective Cepheids (ProCephs), and stars with initial masses below mmin, Ceph as lower mass stars. The star is then referred to as ProCep or a lower mass star for the rest of the simulation regardless of its actual mass, which can change with time. If the ProCep becomes a Cepheid, it is denoted a canonical Cepheid (CanCeph). There are also Cepheids that originate from a coalescence in a binary with both components having a ZAMS mass below mmin, Ceph. We call these upscattered Cepheids (UpCeps). For the adopted evolutionary tracks, stars with mass mmin, Ceph terminate core Helium burning at time tHe, end of 300 Myr, 190 Myr and 146 Myr for Z = 0.002, Z = 0.006, and Z = 0.014, respectively.
We searched for Cepheids automatically in the HR diagrams produced by NBODY6. For each star in the simulation, we recorded its temperature and luminosity whenever its stellar evolution was updated, which, during core helium burning, typically occurs every 0.01 to 0.3 Myr depending on the Cepheid mass and exact position in the HR diagram. This way, we obtained densely sampled HR diagrams even during the rapid evolution on the instability strip as shown in Fig. 1. Then, the algorithm diagnosed each star and classified it as a Cepheid if the star fulfilled all of the following criteria. (i) The star’s initial mass is in the mass range (mmin, Ceph/2, mmax, Ceph). The lower value of the mass range is to include a possible merger of two 0.5 mmin, Ceph stars in a hard binary, which can evolve to a Cepheid (UpCeps). (ii) The star undergoes core Helium burning. (iii) The surface temperature at which core Helium burning starts is rightwards from the blue boundary of the instability strip to exclude the stars which do not have Cepheid loops (stars with m > mmax, Ceph typically have a monotonically decreasing temperature during core Helium burning). (iv) The maximum temperature during core helium burning is leftwards from the red boundary of the instability strip, which means that the star lies on the instability strip during its core Helium burning at least on one output file. We used metallicity-dependent boundaries of the instability strip from Anderson et al. (2016). Verification of this searching procedure for more complicated HR diagrams with merging stars is presented in Appendix A.
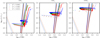 |
Fig. 1. HR diagrams outputted from NBODY6 for single stars of ZAMS mass of 4 M⊙ (left panel), 7 M⊙ (middle panel), and 10 M⊙ (right panel). The evolutionary paths are plotted after the stars left the main sequence. The colour indicates the metallicity, which is Z = 0.002 (blue), Z = 0.006 (green), and Z = 0.014 (red). Large crosses denote the time of core helium burning. For the purpose of this plot, we selected single stars, which evolve well in isolation from the other stars in the cluster. Thick solid lines show the Cepheid instability strip for the metallicities considered (Anderson et al. 2016). Thin solid lines represent ZAMS for stars of corresponding metallicity. |
To obtain the properties of the Cepheid (e.g. its distance from the cluster centre or binarity), we first determined the times when the Cepheid crosses the instability strip and then evaluated the desired properties at a random time (the event when the Cepheid is observed) from the time interval when the star is located within the instability strip. If the Cepheid passes the instability strip twice (we ignored the first passage through the instability strip because of its very short duration), we determined the time randomly from one of the two intervals on the instability strip weighted by their duration. The dynamics of Cepheids usually changes very little when it is within the strip because the duration in the strip is significantly shorter than the cluster relaxation time.
We classify the Cepheid as a cluster Cepheid if it is located closer than 10 pc to the density centre (Casertano & Hut 1985) of the cluster. The majority of Cepheids bound to the cluster are located near the cluster centre (closer than ≈2 pc) as a result of the cluster half-mass radii (several parsec) and mass segregation of ProCeps. The distance of 10 pc is comparable to the tidal radius of the clusters, so if a star exceeds this distance, it is likely to become unbound and recede. If the cluster is already dissolved, all its Cepheids are classified as field Cepheids.
To measure the fraction of Cepheids located in clusters (relatively to the Cepheids in the field and in clusters combined) in different contexts, we introduce the following terminology. The fraction of Cepheids in clusters of initial mass Mecl at given time t is denoted pCC(Mecl, t). The fraction of Cepheids in clusters of a particular cluster mass Mecl throughout the time interval (0, 300 Myr) is denoted pCC(Mecl),
 (4)
(4)
where Δti is the time interval near time ti, and the summation goes over all time intervals. The galaxy-wide fraction of Cepheids in clusters; that is, Cepheids formed in all star clusters within the galaxy over their life-time are denoted fCC,
 (5)
(5)
where ξecl(Mecl) is the ECMF of Eq. (3), and the summation goes over all cluster mass intervals. We stress that throughout this work, Mecl denotes the initial (not actual) cluster mass. As the cluster evolves, its actual mass can be significantly lower than its initial value. In addition, we study the fraction of Cepheids in clusters pCC(mCeph), which are of a given stellar mass mCeph regardless of the mass of their birth star clusters.
To gain basic insight, it is useful to mention some typical numbers of ProCeps formed in a coeval stellar population (CSP). Consider a CSP that is populated by the Kroupa IMF from the mass interval of 0.08 M⊙ to 50 M⊙. For such a CSP, the total mass of ProCeps comprises 17%, 14%, and 13% of the total initial CSP mass for Z = 0.002, Z = 0.006, and Z = 0.014, respectively. By number, ProCeps constitute 1.7%, 1.2%, and 0.95% of the total initial CSP for Z = 0.002, Z = 0.006 and Z = 0.014, respectively.
4. Cepheids in dynamically evolving star clusters
In order to quantify the position of Cepheids relatively to their birth clusters, we study the influence of the dynamical evolution of star clusters on ProCeps. First, we review the most relevant features of the dynamics of young star clusters experiencing expulsion of their residual gas (Sect. 4.1). Then, we investigate the mechanisms that unbind ProCeps from clusters and therefore determine the value of fCC as a function of cluster age and mass for clusters orbiting their host galaxy at a radius of Rg = 8 kpc and of metallicity Z = 0.014 (Sect. 4.2). We discuss the dependence of fCC on Rg and Z in Sects. 4.3 and 4.4. The probability of finding a star cluster hosting a particular number of Cepheids at the same time is studied in Sect. 4.5, and the Cepheids in the field, but still close to their birth star clusters are dealt with in Sect. 4.6.
4.1. Overview of dynamical evolution of tidally limited star clusters experiencing early gas expulsion
In the present models, stars do not conserve their adiabatic invariants in the gravitational potential during gas expulsion because the gas expulsion timescale τM is substantially shorter (τM ≈ 0.02 Myr) than the stellar half-mass crossing time, tcr (see Table 1). As a consequence, the cluster substantially expands while most stars (≈70% of the initial cluster population) escape from the cluster (Tutukov 1978; Lada et al. 1984; Geyer & Burkert 2001; Kroupa et al. 2001; Baumgardt & Kroupa 2007).
On a timescale of 1 Myr to several tens of Myr (depending on the cluster mass), the cluster revirialises, settling at a significantly larger half-mass radius than its initial value (Banerjee & Kroupa 2013, 2017). Further evolution is driven purely by stellar dynamics, where stars escape from the cluster mainly due to slow evaporation with a few energetic ejections, which mostly occur between more massive stars (Baumgardt & Makino 2003; Fujii & Portegies Zwart 2011; Oh et al. 2015; Schoettler et al. 2020). As the cluster mass decreases due to escaping stars and stellar mass loss, the tidal radius decreases, thereby further facilitating the escape of stars until the cluster eventually dissolves completely, leaving behind an unbound stellar stream.
Figure 2 shows the fraction of star clusters that remain gravitationally bound2 at a given age t in the tidal field of a galaxy (taking the Galaxy as the specifically computed example). At a particular galactocentric radius, the dissolution time of a cluster is mainly determined by the cluster mass Mecl. Particularly, at Rg = 8 kpc, all clusters with ≳1600 M⊙ survive up to the age of 300 Myr (the black lines in Fig. 2), while half of all 400 M⊙ and 100 M⊙ clusters dissolve within 250 Myr (medium magenta line) and 90 Myr (medium cyan line), respectively.
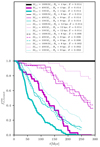 |
Fig. 2. Fraction of star clusters |

Another important parameter strongly impacting the cluster dissolution timescale is the galactocentric radius of its orbit (Vesperini & Heggie 1997; Baumgardt & Makino 2003). Clusters orbiting closer to the galactic centre dissolve earlier due to the stronger tidal field: at Rg = 4 kpc (thick solid lines in Fig. 2), half of 400 M⊙ and 100 M⊙ clusters dissolve within 120 Myr and 50 Myr, respectively. At Rg = 12 kpc (thin solid lines), the majority (≈75%) of 400 M⊙ clusters survive until at least 300 Myr, while half of 100 M⊙ clusters dissolve within 150 Myr. All 1600 M⊙ clusters are preserved for at least 300 Myr even at the smallest radius of 4 kpc. The influence of metallicity on cluster dissolution is negligible, as shown by the dashed and dotted lines for the model with Rg = 8 kpc.
4.2. Dynamical evolution of prospective Cepheids in clusters at Rg = 8 kpc and Z = 0.014
Here, we investigate the significance of different physical mechanisms that release ProCeps from clusters. Stars generally escape their birth clusters by three mechanisms: the rapid change of the gravitational potential during gas expulsion; gradual evaporation due to encounters within the cluster; and fast ejections in close encounters between several bodies.
To identify the mechanism responsible for the escape of the star, we state that any star escaping at speed vesc > 3σ(0), where σ(0) is the initial 3D velocity dispersion of stars in the embedded cluster (Table 1), is an ejection. It is unlikely for a star to achieve such a high speed without interacting in an unstable system of three or more bodies. The cause of an escape of a star with vesc < 3σ(0) is identified as the gas expulsion if the star escapes at time t < tee, where tee = rt/(0.1σ(0)) and rt is the tidal radius of the cluster; or, as dynamical evaporation if the star escapes at time t > tee. The choice of tee is motivated by the typical value of the velocity of stars released due to gas expulsion, which is of the order of σ(0). These stars reach the tidal boundary of the cluster at time ≈rt/σ(0). The factor of 0.1 is a safety factor to take into account the low velocity tail of the velocity distribution. The same definition of tee was adopted by Dinnbier & Kroupa (2020).
The early evolution of embedded star clusters is dominated by gas expulsion, which in our models starts at td = 0.6 Myr after formation of the cluster. However, the clusters dynamically evolve prior to td. We compare mass segregation of ProCeps and of lower mass stars by measuring the half-mass radius, rh, for both stellar populations, which is shown in Fig. 3. The simulation of the Mecl = 100 M⊙ cluster has rh for ProCeps significantly smaller than rh for lower mass stars at ≈td, which means that ProCeps are already concentrated near the cluster centre at the time of gas expulsion. The preferential presence of ProCeps near the cluster centre makes them more resilient to gas expulsion, which unbinds stars mainly from the outskirts of the cluster. These are mainly lower mass stars that are located at the outskirts. After gas expulsion, this cluster contains an excess of ProCeps relatively to lower mass stars. More massive clusters (Mecl ≳ 400 M⊙) do not have enough time to mass segregate prior td, which means that gas expulsion affects ProCeps and lower mass stars to a similar extent, meaning that more massive clusters lose ProCeps at a similar rate as lower mass stars. The mass segregation timescale for ProCeps seen in the simulations is close to the analytic value tms obtained from Spitzer (1969), which is listed in Table 1; for Mecl = 100 M⊙, the simulated cluster mass segregates before td (Table 1 provides tms = 0.28 Myr). For Mecl ≳ 400 M⊙, the simulated cluster mass segregates around or after td (Table 1 provides tms ≳ 0.50 Myr)3. Mass segregation continues after revirialisation, but it occurs on a significantly longer timescale (tms ≈ 30 Myr) than its initial value tms, because gas expulsion decreased the density of the cluster by a factor of 103.
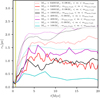 |
Fig. 3. Evolution of half-mass radius rh of ProCeps (solid lines) and lower mass stars (dotted lines) for clusters of mass Mecl = 100 M⊙, 400 M⊙, 1600 M⊙ and 6400 M⊙. The clusters orbit the galaxy at Rg = 8 kpc and have metallicity Z = 0.014. The vertical yellow line shows the time of gas expulsion td. The least massive clusters (Mecl = 100 M⊙; cyan) mass segregate their ProCeps before td, which results in ProCeps being more concentrated than lower mass stars. The following gas expulsion then preferentially unbinds stars from outskirts of the cluster, which are lower mass stars, resulting in a cluster that contains disproportionately more ProCeps. In contrast, the more massive clusters do not mass segregate before td, so the stellar loss due to gas expulsion affects ProCeps in a similar way to lower mass stars. |
To what extent does the preferential escape of lower mass stars as a consequence of mass segregation increase the relative population of ProCeps and make the lower mass clusters ‘Cepheid rich’? To answer this question, we compare the fraction of ProCeps in clusters (i.e. NPC, cl/NPC, tot) to the fraction of lower mass stars in clusters (i.e. Nlm, cl/Nlm, tot) and define the relative abundance of ProCeps as
 (6)
(6)
We then plot it as a function of time (Fig. 4). If η is larger than 1 (lower than 1), the cluster has an excess (deficit) in ProCeps relative to the lower mass stars and thus to the overall stellar content because the lower mass stars dominate the overall population by number. At time tee, η is close to 1 for clusters with Mecl ≳ 400 M⊙, but it is significantly larger (η ≈ 1.8) for the 100 M⊙ clusters which mass segregated before gas expulsion. After 50 Myr, η decreases in these clusters because of two effects. First, close encounters between ProCeps in the cluster centre are more likely than lower mass stars to eject ProCeps (see Fig. 5 below). Second, mass segregation retains more massive ProCeps in clusters, while the less massive ProCeps are more likely to escape to the field. Since more massive ProCeps evolve to Cepheids earlier than the less massive ones, ProCeps in clusters are preferentially depleted as a result of stellar evolution only. Thus, lower mass clusters contain more ProCeps than would be expected from their total mass.
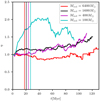 |
Fig. 4. Abundance of ProCeps η relatively to the lower mass stars in clusters as a function of time t. The time tee, indicating the transition between stars escaping due to gas expulsion (t < tee) and evaporation (t > tee) is indicated by vertical lines. While the non-mass-segregated clusters (Mecl ≳ 400 M⊙) have only small changes in η, the mass-segregated cluster (Mecl = 100 M⊙) has an increase in η around time tee. To avoid rapid fluctuations due to small number statistics, the plots are terminated when there are fewer than 10 ProCeps in clusters in all realisations of clusters of given mass. The figure represents clusters at Rg = 8 kpc and Z = 0.014. |
Clusters in the ≈400 M⊙ to ≈1600 M⊙ mass range gradually increase their η with time as the rarefied post-gas-expulsion clusters mass segregate (Fig. 4). The most massive clusters in our study (Mecl = 6400 M⊙) have η close to 1 almost independently of their age because of their very long mass segregation timescales. The differences in dynamical evolution of ProCeps between a lower mass (100 M⊙; movie 1) and more massive (3200 M⊙; movie 2) star cluster are illustrated in Fig. B.1, and in the accompanying online material4.
Figure 5 quantifies the mechanisms responsible for unbinding stars from clusters. For each cluster, we show two bars. The left bar represents ProCeps only, while the right bar represents lower mass stars only. The fraction of lower mass stars that become unbound due to gas expulsion (blue bars) decreases monotonically with increasing cluster mass, which is a well-known fact (e.g. Baumgardt & Kroupa 2007). However, ProCeps do not follow this trend, because they are preferentially retained in lower mass clusters due to dynamical mass segregation. Instead, the fraction of ProCeps that are unbound due to gas expulsion first increases with increasing Mecl, reaching a maximum of 0.52 for Mecl = 400 M⊙ and it further decreases as Mecl increases. The maximum is caused by mass segregation of ProCeps in clusters with Mecl ≲ 400 M⊙, which occurs before gas expulsion. The mechanism that unbinds most of the ProCeps is gas expulsion, with evaporation and ejections playing a secondary role; however, none of these processes are negligible. Dynamical ejections unbind fewer ProCeps than evaporation. In total, 2 to 10% of ProCeps are ejected, where lower mass clusters produce a higher fraction of ejected stars. In contrast, ejections are negligible for lower mass stars.
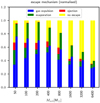 |
Fig. 5. Dynamical mechanisms responsible for stellar escapes as a function of the cluster mass. For each cluster mass, we plot two bar plots; the left bar plot represents ProCeps, the right bar plot represents lower mass stars. The colours indicate the relative number of stars in each group which escaped due to gas expulsion (blue), dynamical evaporation (green), dynamical ejection (red), and the rest which either terminated their core Helium burning within the cluster (for ProCeps) or are still present in the cluster by the age of 145 Myr (yellow). We note that in the least massive clusters (Mecl ≲ 200 M⊙), which mass segregate before td, lower mass stars and ProCeps react differently to gas expulsion: as Mecl decreases, more low-mass stars are unbound, while fewer ProCeps are unbound. The figure is for clusters with Rg = 8 kpc and Z = 0.014. |
Figure 6 shows the fraction of Cepheids located in their birth clusters pCC(Mecl, t) as a function of the cluster age and mass. The values for clusters at Rg = 8 kpc are shown in the middle panel. The histograms are produced by the Bayesian block method to take into account the non-uniformly sampled time when Cepheids occur. The main strengths of the method, which uses variable bin sizes, is its independence of the assumptions about the smoothness and shape of the function and the time resolution of the data (Scargle et al. 2013; Astropy Collaboration 2013). The plots feature all Cepheids formed within the simulations including UpCeps, which are present after time tHe, end. Clusters with Mecl ≳ 800 M⊙ have almost time-independent pCC(Mecl, t) ≈ 0.5. Less massive clusters have lower pCC(Mecl, t), which decreases with time as these clusters dissolve more easily. The higher abundance η of Cepheids in clusters of lower masses, which is due to mass segregation, is partially compensated due to faster dissolution of these clusters; pCC(Mecl, t) would be lower in the absence of mass segregation. The fraction pCC(Mecl) of cluster Cepheids averaged over time is shown in the left panel of Fig. 7 (red circles).
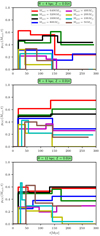 |
Fig. 6. Fraction pCC(Mecl, t) of cluster Cepheids as a function of time for clusters orbiting the galaxy at different galactocentric radii: Rg = 4 kpc (upper panel), Rg = 8 kpc (middle panel), and Rg = 12 kpc (lower panel). The cluster mass is indicated by colour. Metallicity is Z = 0.014 for all models. The plot shows all Cepheids including UpCeps, which occur after tHe, end. Generally, pCC(Mecl, t) decreases with time for lower mass clusters (Mecl ≲ 800 M⊙), and it stays approximately constant for clusters more massive than that. The histogram is binned by the Bayesian blocks algorithm. The lines terminate at 300 Myr or at the occurrence of the last Cepheid. |
The earlier dissolution of lower mass clusters implies that the Cepheids that occur in these clusters are on average of a larger mass  than those in more massive clusters, as shown in the right panel of Fig. 7, because lower mass Cepheids occur at the time when the majority of lower mass clusters have already dissolved, and the lower mass Cepheids have been released to the field.
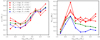 |
Fig. 7. Left panel: fraction of cluster Cepheids pCC(Mecl) (including UpCeps) as a function of cluster mass Mecl integrated over the first 300 Myr of the cluster evolution. Clusters orbiting at different galactocentric radii Rg are denoted by different symbols; clusters with different metallicity Z are denoted by different colour of the symbol. The external field of the galaxy, which impacts the lower mass clusters more, is responsible for the decrease of pCC(Mecl) with Rg. pCC(Mecl) increases with Mecl because more massive clusters withstand gas expulsion and the tidal field of the galaxy better. For lower mass clusters, pCC(Mecl) decreases with metallicity because Cepheids occur later at lower Z, at which time more low-mass clusters have been dissolved. Right panel: mean mass of Cepheids in the cluster as a function of Mecl. At a given metallicity, |


Conversely, lower mass Cepheids are preferentially hosted by more massive clusters, which survive for longer. It appears that the dependence of  on Mecl is robust because it is found in clusters at different orbital radii (red squares and triangles in Fig. 7) and metallicities (green and blue circles). Finally, the least massive clusters (Mecl ≲ 100 M⊙) have smaller
  because their ability to host high-mass ProCeps is limited by the IMF (cf. mmax in Table 1).
The occurrence of Cepheids in clusters therefore depends on several aspects. In particular, we note the dichotomy of pCC(Mecl, t) with age for high and low cluster masses, where Mecl ≈ 800 M⊙ separates the two regions.
The properties of ProCeps and Cepheids for the lower mass clusters show significant differences between individual realisations for clusters of the same mass. As an example, clusters of mass 200 M⊙ contain, on average, only 3.5 ProCeps (cf. NPC and Nmod in Table 1), which implies small number statistics for Cepheids in low mass clusters. Some low mass clusters do not follow the evolutionary path described in this section, where interaction of each individual ProCep with another ProCep or lower mass star decides whether these stars are retained in the cluster or not. For example, all ProCeps can be ejected from the cluster in a single dynamic encounter occurring before gas expulsion (i.e. ≲0.6 Myr). The coarseness is absent in more massive clusters (6400 M⊙ clusters have ≈125 ProCeps). This should be taken into account when comparing present theoretical findings with observations. Our results describe averages over a large cluster sample, so they are representative, for example, for a cluster population of a galaxy rather than for the individual cluster.
Up to this point, our aim was to theoretically understand the fraction of Cepheids in clusters with little emphasis on quantities that can be directly compared with observations. One quantity of more observational interest is the fraction of Cepheids of given mass, mCeph, located in clusters (Fig. 8). In this plot, the Cepheids at any mass bin originate from the whole star cluster population of the ECMF of Eq. (3). The fraction pCC(mCeph) increases with mCeph because more massive Cepheids occur earlier, when more lower mass star clusters are still gravitationally bound (it is the same effect which is responsible for the higher mean Cepheid mass  in lower mass clusters as seen in the right panel of Fig. 7).
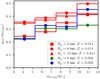 |
Fig. 8. Fraction of cluster Cepheids pCC(mCeph) as a function of the Cepheid mass mCeph for Cepheids originating from clusters at different galactocentric radius Rg (indicated by symbols) and of different metallicity Z (indicated by colour). The plot represents Cepheids originating from the whole population of star clusters of the ECMF of Eq. (3). Cepheids of higher mass have a slightly higher probability of being found in clusters. |
4.3. The role of galactocentric radius
The clusters at Rg = 4 kpc (upper panel of Fig. 6) and Rg = 12 kpc (lower panel) follow the same trends in pCC(Mecl, t) as the cluster at Rg = 8 kpc (middle panel), which was described in the previous section. The value of pCC(Mecl, t) decreases with time for lower mass clusters because they dissolve faster than more massive clusters (cf. Fig. 2), which have pCC(Mecl, t) almost independent of time. We note that Cepheids occur non-uniformly with time, with ≈80% of all Cepheids occurring before tHe, end ≈ 150 Myr (for Z = 0.014). This influences their statistics, which is relatively good at ≲150 Myr, but relatively poor afterwards, when only a small number of Cepheids can cause visible difference. While most of the clusters follow the expected trend of having larger pCC(Mecl, t) at a larger galactocentric radius, there are several exceptions because of low number statistics. An example is that of the Mecl = 100 M⊙ clusters (cyan lines), which have lower pCC(Mecl, t ≳ 150 Myr) for the Rg = 12 kpc models than for the Rg = 8 kpc models.
The time-averaged fraction of Cepheids in clusters for Rg = 4 kpc (red squares), Rg = 8 kpc (red circles) and Rg = 12 kpc (red triangles) is shown in the left panel of Fig. 7. For lower mass clusters (Mecl ≲ 400 M⊙), pCC(Mecl) generally increases with increasing Rg as the galactic tidal field becomes less important. Averaged over all the clusters with Mecl ≲ 400 M⊙, fCC = 0.17 for Rg = 4 kpc, fCC = 0.26 for Rg = 8 kpc, and fCC = 0.27 for Rg = 12 kpc. On the other hand, more massive clusters (Mecl ≳ 800 M⊙) have fCC ≈ 0.5 almost independently of Rg because they are not significantly affected by the tidal field of the galaxy.
4.4. The role of metallicity
Figure 9 shows the time evolution of pCC(Mecl, t) for clusters of different metallicities. At a lower metallicity, Cepheids occur at a lower mass mmin, Ceph and live longer (their tHe, end is larger). Consequently, pCC(Mecl, t) reaches lower values near tHe, end for clusters with lower metallicity because the clusters have more time to evaporate or dissolve; this trend is more pronounced in lower mass clusters (pCC(Mecl, tHe, end)≲0.1 for Z = 0.002) because they release stars to the field faster. When integrated over time (left panel of Fig. 7), the value of fCC averaged over clusters with Mecl ≲ 400 M⊙ decreases from fCC = 0.26 for Z = 0.014 via fCC = 0.24 for Z = 0.006 to fCC = 0.18 for Z = 0.002. Clusters with Mecl ≳ 800 M⊙ have fCC ≈ 0.5 with no dependence on Z. This shows that the highest sensitivity of pCC(Mecl) on metallicity is for lower mass clusters (Mecl ≲ 800 M⊙).
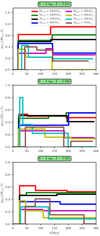 |
Fig. 9. Fraction of cluster Cepheids pCC(Mecl, t) as a function of time for clusters of different metallicities: Z = 0.014 (upper panel), Z = 0.006 (middle panel), Z = 0.002 (lower panel). The cluster mass is indicated by colour. All clusters have Rg = 8 kpc. |
This result is the consequence of the longer lifespan of Cepheids at a lower metallicity, at which time more lower mass clusters are dissolved, instead of differences in internal dynamics for clusters of a lower metallicity. This can be deduced from Fig. 2, where the fraction of gravitationally bound clusters at a given time,  , is almost independent of metallicity (cf. the solid, dashed and dotted lines). This result is also supported by Hurley et al. (2004), who find a rather minor influence of metallicity on star cluster evolution even for a metallicity substantially lower than considered here (Z = 10−4). Additionally, the lower mass of Cepheids at a lower metallicity (right panel of Fig. 7) means that their progenitors need a longer timescale for mass segregation and are more likely to escape the cluster during gas expulsion, further reducing the population of cluster Cepheids.
4.5. The number of Cepheids hosted by a cluster at the same time
To interpret the results, we remember that Mecl is the birth mass of the cluster. The present mass of the cluster hosting Cepheids is typically by a factor of two to three lower than this, depending on its age and initial Mecl.
Figure 10 shows the time-averaged number of Cepheids, CCmult, occurring at the same time within the same cluster as a function of the cluster age for clusters of four different masses. Since the number of Cepheids in the same cluster rapidly varies with time around small integer numbers, forming a teeth-like curve, we resort to taking a time average of this quantity. The histogram of the number of Cepheids is discussed below (see also Fig. 11 below). The value of CCmult increases with time up to tHe, end (Fig. 10; the grey dashed line) because lower mass Cepheids, which occur later are more abundant (according to the adopted model for the IMF), and they spend a longer time within the instability strip; this occurs despite the continuing cluster dissolution with progressing time. More massive clusters, which contain more ProCeps, have higher CCmult. CCmult also increases with decreasing metallicity (particularly before tHe, end) because of the lower minimum mass of Cepheids (and thus their higher abundance) in this environment (right panel of Fig. 10). After the expected lifetime of ProCeps tHe, end, CCmult suddenly drops, but it is non-zero; these Cepheids originate from UpCeps, which are shown by dashed lines (a more detailed study of UpCeps is available in Paper II).
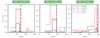 |
Fig. 10. Time dependence of CCmult for CanCeps (solid lines) and all Cepheids (dashed lines) in clusters of different mass as shown by the colour. The grey vertical dashed lines indicate the time tHe, end for the given metallicity. The histograms are binned by the Bayesian block method. The lines are shown for the interval marked by the occurrence of the first and last Cepheid in clusters in present models (the discretisation to individual Cepheids is the reason why all models do not reach exactly 300 Myr). |
How many Cepheids do we expect to see in a particular cluster at the same time? To answer this question, we counted the number of Cepheids in each of our simulated clusters every 30 kyr during the time interval of occurrence of CanCeps; that is, between 15 Myr and tHe, end. A histogram of this count is shown in Fig. 11. We first note that the histogram pertains to observations of a single star cluster, not the whole population of star clusters. For example, the probability of finding at least one Cepheid in a cluster with a birth stellar mass of 6400 M⊙ is p = 0.317, while for an 400 M⊙ cluster the probability is only p = 0.017. However, the galaxy forms ≈16× more 400 M⊙ clusters than 6400 M⊙ clusters, so the probability of finding at least one Cepheid among 400 M⊙ clusters is not that different as among 6400 M⊙ clusters (e.g. p = 0.017 × 16 = 0.272 vs. p = 0.317).
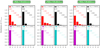 |
Fig. 11. Normalised histograms of the number of Cepheids located in the same cluster, CCmult, at a given time as a function of cluster mass and metallicity. The numbers above the columns indicate the number fraction of clusters which contained zero to four Cepheids at the same time. The Cepheids taken into account are the CanCeps only. None of the clusters contained more than six Cepheids at the same time. |
The probability of finding more Cepheids at the same time decreases with the number of Cepheids we intend to find, and also with decreasing cluster mass (Fig. 11). Clusters harbouring two and more Cepheids at the same time are usually the more massive ones, with mass larger than 400 M⊙. Clusters with initial mass ≲400 M⊙ almost never host more than one Cepheid. The highest value of CCmult found in our simulations is five, and this occurred for the most massive (Mecl = 6400 M⊙), and the least metallic (Z = 0.002) cluster. The event of CCmult = 5 occurred only once in more than 2500 simulations in total, so observations of clusters of masses below ≈6400 M⊙ with CCmult > 5 are likely to be rare. This low probability of two or more Cepheids occurring simultaneously in a given cluster agrees very well with the observed statistics based on the MW, M 31, and the majority of Cepheid hosting clusters in the LMC and SMC (Anderson & Riess 2018).
However, some LMC clusters hosting many Cepheids are remarkable exceptions to this general rule, notably NGC 1866 and NGC 2031 that each host ≈20 or more Cepheids (Welch & Stetson 1993; Testa et al. 2007). We assessed whether the occurrence of such clusters is consistent with our simulations in the following way. We assume that a Cepheid in a cluster occurs at a time that is independent of the occurrence of other Cepheids, and that the probability pioc of finding a given ProCep as a Cepheid at any time is substantially lower than 1. These assumptions imply Poisson distribution for Cepheids with a mean value of
 (7)
(7)
where NCeph is the number of Cepheids that occurred during the cluster’s life-time. From the values in the middle panel of Fig. 11 (metallicity similar to NGC 1866), we obtain λ = 0.97 and λ = 0.22 for models with Mecl = 6400 M⊙ and Mecl = 1600 M⊙, respectively. These values are consistent with the definition of λ, which is linearly proportional to NCeph. When scaling λ from the Mecl = 1600 M⊙ clusters to the Mecl = 6400 M⊙ clusters, we would obtain λ = 0.88 for Mecl = 6400 M⊙ clusters. Averaging these two points yields λ ≈ 0.93 for Mecl = 6400 M⊙ clusters. Adopting a mass of 1.35 × 10⁵ M⊙ for NGC 1866 (Fischer et al. 1992), Eq. (7) yields λ = 19.6. Thus, the Poisson distribution yields an expected 20 Cepheids, which is not too far from the known 24 Cepheids in NGC 1866 (Welch & Stetson 1993) whose simultaneous occurrence has a probability of ≈13%. Thus, the wealth of Cepheid members of these two LMC clusters is explained by their high mass, low metallicity (more numerous lower mass stars can become Cepheids), and a cluster age consistent with the occurrence of comparatively old short-period (low-mass) Cepheids. For reference, the mean pulsation periods of Cepheids in NGC 1866 and NGC 2031 reported by Testa et al. (2007) are 2.9 d and 3.2 d, respectively, corresponding to ages of ≈100 Myr assuming period-age relations without rotation (Bono et al. 2005) and approximately 200 Myr for period-age relations assuming average main sequence rotation rates (Anderson et al. 2016).
4.6. Cepheids in the outskirts of star clusters
Figure 12 shows the cumulative distribution of Cepheids according to the distance r from the density centre of their birth cluster. Each star is plotted at the time when it becomes a Cepheid, which means that the stars are shown at different ages. This enables a direct comparison with observations. Approximately 20% of Cepheids whose birth cluster is still gravitationally bound are located at distances from 10 pc to 50 pc. Interestingly, Anderson et al. (2013) find that 5 of 23 (22%) cluster Cepheids in their sample are located at this distance from clusters. Recent searches for Cepheids in MW clusters have primarily reported such new possible ‘halo’ members (Medina et al. 2021; Zhou & Chen 2021). We find approximately 5% of Cepheids located far away (≳1 kpc) from their birth clusters as a result of dynamical ejection. The distribution of Cepheids according to r is independent of the galactocentric radius Rg or metallicity Z.
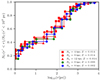 |
Fig. 12. Cumulative distribution of Cepheids according to the distance r to the density centre of their birth cluster for the whole population of star clusters from the ECMF of Eq. (3). We only plot the Cepheids whose birth cluster is still gravitationally bound at the time of the occurrence of the Cepheid. |
5. The fraction of Cepheids in star clusters
In this section, we provide the likely upper and lower estimate on fCC. The upper estimate on fCC is taken from present simulations, where the main mechanisms responsible for cluster dissolution are the early gas expulsion and the tidal field of the galaxy. However, star clusters are subjected to additional dissolution mechanisms, such as encounters with giant molecular clouds (GMCs; Spitzer 1958; Terlevich 1987; Theuns 1992; Jerabkova et al. 2021), which is not included in present simulations. The lower estimate on fCC is based on the difference between the population of observed open star clusters in the Galaxy and the population of bound star clusters in our models. We note that we do not, a priori, assume the physical mechanism for additional dissolution, we only assume the survival rate of star clusters.
We consider four different models of the galactic cluster population. In the first three models, we assume that at any galactocentric radius Rg, Cepheids are formed in star clusters of the ECMF and initial mass range as given in Sect. 2.3. Since the cluster number density often varies non-trivially as a function of the galactocentric radius with a significant fraction of star formation sometimes located in ring-like structures (e.g. Lewis et al. 2015), we assume rather extreme radial distributions of star clusters over the galaxy to constrain the possible variations in fCC: (i) all star clusters are located at the same galactocentric radius of Rg = 4 kpc; (ii) all star clusters are located at the same galactocentric radius of Rg = 12 kpc; and (iii) star clusters follow the usual exponential stellar surface density profile of spiral galaxies in the form of Σecl ∝ exp( − Rg/Rd) with the disc scale length of Rd = 2.5 kpc (Binney & Tremaine 2008).
The fourth model (iv) is based on the idea of Pflamm-Altenburg & Kroupa (2008), where the maximum cluster mass Mecl, max decreases with increasing Rg in disc galaxies as Mecl, max(Rg) = Mecl, max, 0exp( − γRg/Rd) because it is set by the local gas surface density. This dependence of the cluster masses on galactocentric radius was documented for the late-type galaxy M 33 by Pflamm-Altenburg et al. (2013), which also demonstrates the distribution of young clusters to be non-stochastic. Following Pflamm-Altenburg & Kroupa (2008), we adopted the slope γ = 1.5, the disc scale length Rd = 4 kpc, and the maximum cluster mass the galaxy can form Mecl, max, 0 = 8 × 10⁴ M⊙ (Weidner et al. 2004). The final value of fCC is calculated by weighting the ECMF of Eq. (3) (in the interval of 50 M⊙ to Mecl, max(Rg)) by the number of Cepheids forming in the particular annulus, which is proportional to 2πRgexp( − γRg/Rd).
5.1. The upper estimate on fCC
For the cluster distributions (i), (ii), (iii), and (iv) and for solar metallicity, we obtain fCC = 0.30, fCC = 0.36, fCC = 0.33, and fCC = 0.34, respectively (cf. the sixth to ninth columns of Table 2). For the sub-solar metallicities, Z = 0.006 and Z = 0.002, we only have models for Rg = 8 kpc, for which we obtain fCC = 0.35 and fCC = 0.32, respectively. Since metallicity has a minor influence on dynamical evolution of our models (cf. Sect. 4.4), we estimate fCC in sub-solar metallicity clusters by scaling their values from Rg = 8 kpc to Rg = 4 kpc and Rg = 12 kpc by the same factors as is the scaling for the model with Z = 0.014. We obtain fCC in the range from 0.27 to 0.32 for Z = 0.006, and fCC in the range from 0.25 to 0.29 for Z = 0.002 (Table 2).
5.2. The lower estimate on fCC
In the solar vicinity, only ≈10% of embedded star clusters survive to the age of 10 Myr, and ≈4% of embedded star clusters survive to the age of 100 Myr (Lada & Lada 2003), which is mainly attributed to encounters with GMCs. The observed fraction of surviving clusters is smaller than what we obtain in our simulations (cf. Fig. 2), which implies that more Cepheids are released to the field in the real galaxy. However, the inclusion of more realistic (i.e. non-spherically symmetric and evolving with time) GMCs to this type of simulation would be a non-trivial task, which to our knowledge has not been accomplished yet, so we resort to a coarse approximation to obtain an order of magnitude estimate.
Based on Lada & Lada (2003), we approximate the fraction of star clusters which remain gravitationally bound at age t by
 (8)
(8)
We assume that Eq. (8) is independent of the cluster mass, and of Rg. Then, for each Cepheid in a cluster (which occurs at the cluster age t), we measure the fraction of bound clusters  in our simulations. In the real galaxy, there is
  times Cepheids in clusters at t, so we take
  of each Cepheid as located within a star cluster.
The fraction of cluster Cepheids obtained by this correction for the additional dissolution processes is shown in the second to fifth columns of Table 2. It is smaller by a factor of 10 than without the correction (sixth to ninth columns), which indicates that molecular clouds or a similar disruptive mechanism play likely a crucial role in setting the value of fCC. These values of fCC are comparable to what is observed in the galaxy M 31 (fCC = 0.025; Anderson & Riess 2018).
6. Discussion
6.1. Gas expulsion and mass segregation
The most important parameters of gas expulsion which influence cluster dynamics is the star formation efficiency SFE and the gas expulsion time-scale τM (Baumgardt & Kroupa 2007). Although we adopt what appear to be their most likely values (Kroupa et al. 2001; Banerjee & Kroupa 2013; Megeath et al. 2016), we discuss the possible influence on fCC in case that these parameters are markedly different. For SFE higher than 1/2, gas expulsion unbinds only a small fraction of stars from the cluster. A small fraction of stars is also released when τM ≫ tcr. Nevertheless, lower mass clusters dissolve by 300 Myr due to cluster dynamics only (de la Fuente Marcos & de la Fuente Marcos 2004), while the more massive clusters are likely to retain the majority of their ProCeps. In these cases, we expect fCC to be somewhat larger than in our models.
On the other hand, if SFE ≲ 1/3 and τM ≲ tcr, the majority of clusters is quickly dispersed forming unbound OB associations with a possible handful of small bound clusters, which are remainders from the most massive and compact clusters (Tutukov 1978). In this case, fCC would be lower than in our models, possibly similar to our lower estimate on the fCC.
The present models started as non-mass segregated, but the lower mass clusters (Mecl ≲ 200 M⊙) developed mass segregation dynamically before the onset of gas expulsion at td = 0.6 Myr. However, the value of td is not well constrained. If gas expulsion started earlier (later), mass segregation will develop in clusters less (more) massive than 200 M⊙.
Mass segregation (either primordial or induced by dynamics) impacts pCC(Mecl) in several ways. As shown in Sect. 4.2, mass segregation retains more ProCeps in the cluster in comparison to lower mass stars, which tends to increase fCC in total. On the other hand, this effect is, to some degree, counteracted by stellar evolution when mass-segregated massive stars explode as supernovae near the cluster centre, causing more pronounced cluster expansion, unbinds more stars and results in faster cluster dissolution (Brinkmann et al. 2017), which would decrease fCC. The final outcome of the interplay of these two processes, which likely depends on both the cluster mass and Cepheid mass, is difficult to predict without further N-body calculations.
6.2. Initial binary fraction
The assumption of 100% binary fraction under the exemption of initial triple systems may have a significant impact on our results. Paper II in this series studies the dynamics of multiple systems in our simulation in detail. It suffices to state that our simulations suggest that a significant fraction (possibly the majority) of mid-B stars form in triples and quadruple systems instead of binaries. The presence of primordial triples can cause faster mass segregation (because these subsystems are more massive than single stars or binaries) and preserve more ProCeps in clusters increasing fCC; on the other hand, the dynamical interactions within subsystems and between subsystems and cluster members are likely to cause more ejections, decreasing fCC. Additional simulations spanning a wide parameter range of initial conditions would be required to study these effects in further detail.
6.3. The external potential of the galaxy
The gravitational potential of the galaxy was modelled using the approximation of Allen & Santillan (1991), even though more recent approximations are available (e.g. Irrgang et al. 2013; Pouliasis et al. 2017). We argue that the details of the potential are not critical for our results because the main influence of the potential is to define the tidal radius, beyond which the stars are removed from the cluster, thus setting the rate of evaporation. The clusters are on circular orbits, so the tidal radius does not change as the cluster revolves the galaxy (apart from cluster mass loss due to evaporation). A cluster of mass Mcl on a circular orbit of radius Rg has a tidal radius given by
 (9)
(9)
(Binney & Tremaine 2008, their Eqs. (3.80) and (8.106)), where Mglx is the mass of the galaxy within the cluster orbit and γ = 2Ω/κ is the ratio of the orbital and epicyclic frequency. Since Mglx follows from the magnitude of the rotational curve and γ follows from its slope, which is flat for most spiral galaxies (Bosma 1981; Rubin et al. 1982), implying γ ≈ 1.4, the value of the tidal radius is insensitive of given galaxy model for clusters located in the stellar disc. We note that in other theories of gravity (e.g. MOND), cluster evaporation can occur on a different timescale (faster in the case of MOND) and the tidal structure around the cluster can be asymmetric (Kroupa et al., in prep.).
This study is aimed at general spiral galaxies, which show a large variability in their gravitational potentials, so using a model particularly tuned for the Galaxy would not provide a general result.
6.4. The role of molecular clouds
The lower estimate on fCC in our models (Table 2) is similar to the observed fraction of cluster Cepheids in M 31, fCC, M31 = 0.025, (Senchyna et al. 2015; Anderson & Riess 2018). However, significant variations in fCC can exist among galaxies, and fCC ≈ 0.07 − 0.11 was estimated in the LMC, SMC, and the Milky Way (Anderson & Riess 2018, cf. their Sect. 3.1).
Here, we provide a tentative update on the Milky Way value of fCC using the high-quality astrometry from the Gaia mission’s Early Data Release 3 (Gaia Collaboration 2021), updated literature on Galactic open clusters (Loktin & Popova 2017; Cantat-Gaudin et al. 2018, 2020; Ferreira et al. 2021; Hunt & Reffert 2021; Dias et al. 2021), recent investigations of Cepheid membership in Galactic clusters (Breuval et al. 2020; Zhou & Chen 2021; Medina et al. 2021), and the most extensive literature on Galactic Cepheids from the General Catalog of Variable Stars (Samus’ et al. 2017), the Variable Star Index (Watson et al. 2006), and the re-classification of MW Cepheids by Ripepi et al. (2019). A more detailed investigation of this fraction will be presented separately (Cruz Reyes et al., in prep.). We limited our estimate to a volume of 2 kpc to strike a useful balance between statistics and completeness of Cepheids and clusters. Following several quality cuts and detailed inspection of light curves and other available data, we find 217 classical Cepheids within 2 kpc. Of these, 15 are bona fide members of star clusters. We thus find fCC, MW = 15/217 = 0.069, somewhat lower than the previous value of 11/130 = 0.085 in Anderson & Riess (2018). On one hand, the decrease in fCC, MW is driven by the greater number of Cepheids that can be placed within 2 kpc thanks to Gaia astrometry. On the other hand, the increase in known clusters resulted in several new cases as well as a reassessment of cluster membership of some other cases. However, it is likely that the list of known clusters within 2 kpc remains significantly less complete than the list of known Cepheids, as evidenced by the recent discovery of more than 600 clusters, mostly at distances beyond 1 kpc (Castro-Ginard et al. 2022). We therefore consider our updated estimate of fCC, MW = 15/217 = 0.069 a lower limit to the true fraction of cluster Cepheids within 2 kpc from the Sun.
Such large differences between different galaxies cannot be fully explained by lower metallicity (Z = 0.006 and Z = 0.002 was used for the LMC and SMC, respectively) nor by a different strength of the galactic tidal field. As shown in Sects. 4.3 and 4.4, decreasing metallicity from Z = 0.014 to Z = 0.002 decreases fCC only by a factor of 1.2, and increasing galactocentric radius from Rg = 4 kpc to Rg = 12 kpc increases fCC also by a factor of 1.25. A possible explanation of the difference of fCC for different galaxies might stem from different conditions in the interstellar medium in these galaxies, which forms molecular clouds of different masses and/or on different timescales, thus having a different impact on star clusters via the gravitational force. If true, this would imply a bias depending on the gaseous content of the galaxy.
7. Conclusions
We investigated the dynamical evolution of Cepheids in open star clusters with the main aim of estimating the fraction of Cepheids located in clusters and the field. We focused on the influence of the initial cluster mass, orbital radius within its galaxy, and metallicity. The stellar masses follow a realistic initial mass function, and all stars are assumed to form as binaries. At a young age, the clusters expel their non-star-forming gas; this unbinds a significant fraction of stars from the clusters. All the results are obtained directly from simulations.
Lower mass clusters dissolve more easily in the tidal field of the galaxy, releasing a higher fraction of their stars to the field than more massive clusters. For more massive stars, including ProCeps, this process is partially compensated by the rapid mass segregation in very low-mass clusters (Mecl ≲ 200 M⊙) occurring before gas expulsion. The fraction of Cepheids located in clusters increases with the cluster mass from ≈0.25 (for Mecl = 50 M⊙) to ≈0.60 (for Mecl = 6400 M⊙). Cepheids of higher mass are more likely (by ≈30%) to be found in clusters than Cepheids of lower mass because lower mass Cepheids appear at a later time when more clusters dissolve. The evolution of the lower mass (100 M⊙) and the more massive cluster (3200 M⊙) is shown as videos in the online material.
Clusters orbiting the galaxy at a larger galactocentric radius Rg take longer to dissolve in the galactic tidal field, retaining more stars (and thus more ProCeps). From Rg = 4 kpc to Rg = 12 kpc, the fraction of Cepheids in clusters fCC increases by a factor of 1.2. At a lower metallicity, Cepheids occur later, at the time when more star clusters are dissolved. As Z changes from the Solar value of 0.014 to a SMC value of 0.002, fCC decreases by a factor of 1.2.
At a given time, the majority of star clusters host at most one Cepheid. Generally, the probability of observing two or more Cepheids within the same cluster at the same time increases with the cluster mass and age, and slightly increases with decreasing metallicity (Figs. 10 and 11). For example, in an initially 6400 M⊙ cluster at Z = 0.002, the probability to observe two, three, and four Cepheids simultaneously is 7.4%, 3.5%, and 2.5%, respectively. The highest number of Cepheids at the same time detected in our simulations in any cluster is five, indicating that observing more Cepheids in one cluster than this is rare. However, we find that the extremely Cepheid-rich LMC clusters NGC 1866 and NGC 2031 are consistent with our results once their higher mass is accounted for. Our simulations allow us to understand the existence of such a large number of Cepheids in these clusters as being due to the combination of very high cluster mass, lower LMC metallicity, and a cluster age near the age when the least massive (most numerous) Cepheid progenitors become Cepheids.
Assuming that star clusters are formed with the mass function of Eq. (3) and then evolve in a Milky Way-like galaxy, we obtain fCC = 0.30 to 0.36 for the whole galaxy with Z = 0.014. This is an upper limit on fCC because it neglects other cluster dissolving mechanisms than gas expulsion, cluster internal dynamics, and the galactic tidal field. Given that the observed difference of fCC between the galaxy M 31 (fCC ≈ 0.025) on the one hand, and the Galaxy, LMC, and SMC (fCC ≈ 0.09) on the other hand, differs by a substantially larger factor than our simulations permit with a varying tidal field strength and metallicity, it is unlikely that the observed difference can be explained by variations of the galactic tidal field strength and metallicity only.
Using an analytical model to incorporate additional cluster disruption mechanisms to match the observed number of dissolved clusters (Lada & Lada 2003), we obtain substantially smaller values of fCC = 0.015 to 0.026. This disruption is mainly attributed to interactions with giant molecular clouds, which is not included in the present N-body simulations. Thus, fCC strongly depends on cluster disruption mechanisms, while its dependence on the galactic tidal field or metallicity is of secondary importance.
Movies
Movie 1 associated with Fig. B.1 (movie1_100_Msun) Access Supplementary Material
Movie 2 associated with Fig. B.1 (movie2_3200_Msun) Access Supplementary Material
Although the total mass of clusters in each logarithmic mass bin is the same, the number of stars that evolve into Cepheids is different in each bin because of the mmax − Mecl relation. For example, the least massive clusters do not populate the stellar IMF up to the maximum mass mmax, Ceph of stars which evolve to Cepheids because they have mmax < mmax, Ceph.
In this work, we consider a star cluster to be any group of at least ten centre-of-mass bodies (a centre-of-mass body is either a single star or a regularised binary or hierarchical system), which is located within the cluster tidal radius.
The formula used for calculating tms according to Spitzer (1969) was derived under idealised assumptions, so it might vary by a factor of several. The close agreement between our simulations is probably coincidental for our particular cluster profile, IMF and the choice of stars with the mass > 10 M⊙ to be mass segregated.
The present clusters are calculated for the external gravitational field of the Galaxy. If the clusters were positioned in the LMC and SMC, their tidal radii would be only marginally larger by factors of 1.3 and 1.1, respectively (the estimate is based on rotation curves from Stanimirović et al. 2004; van der Marel & Kallivayalil 2014), than if they were located in the Galaxy at Rg = 8 kpc. Given the modest variation of fCC on Rg, we do not expect the tidal field of the Magellanic Clouds to cause the large difference in the observed value of fCC.
Acknowledgments
We thank an anonymous referee for the useful comments and suggestions, which improved the quality of the paper. We would like to thank Sverre Aarseth for continuously developing the NBODY family of numerical integrators and Sambaran Banerjee for his advice about specifying integration parameters for the simulations. We appreciate the support of the ESO IT team, which was vital for performing the presented simulations. We thank Mauricio Cruz Reyes for assistance in obtaining an updated value for fCC based on Gaia EDR3 data. This research made use of Astropy (http://www.astropy.org), a community developed core Python package for Astronomy (Astropy Collaboration 2013) and Matplotlib Python Package (Hunter 2007). F.D. and P.K. acknowledge the Scientific Visitors Programme of European Southern Observatory in Garching, which made this project possible. F.D. and P.K. acknowledge support through grant 20-21855S from the Czech Grant Agency. R.I.A. acknowledges funding provided by SNSF Eccellenza Professorial Fellowship PCEFP2_194638 and funding from the European Research Council (ERC) under the European Union’s Horizon 2020 research and innovation programme (Grant Agreement No. 947660).
References
- Aarseth, S. J. 1971, Ap&SS, 13, 324 [NASA ADS] [CrossRef] [Google Scholar]
- Aarseth, S. J. 1999, PASP, 111, 1333 [NASA ADS] [CrossRef] [Google Scholar]
- Aarseth, S. J. 2003, Gravitational N-body Simulations (Cambridge: Cambridge University Press) [CrossRef] [Google Scholar]
- Aarseth, S. J., & Zare, K. 1974, Celest. Mech., 10, 185 [NASA ADS] [CrossRef] [Google Scholar]
- Aarseth, S. J., Henon, M., & Wielen, R. 1974, A&A, 37, 183 [NASA ADS] [Google Scholar]
- Ahmad, A., & Cohen, L. 1973, J. Comput. Phys., 12, 389 [Google Scholar]
- Allen, C., & Santillan, A. 1991, Rev. Mex. Astron. Astrofis., 22, 255 [NASA ADS] [Google Scholar]
- Anderson, R. I., & Riess, A. G. 2018, ApJ, 861, 36 [NASA ADS] [CrossRef] [Google Scholar]
- Anderson, R. I., Eyer, L., & Mowlavi, N. 2013, MNRAS, 434, 2238 [Google Scholar]
- Anderson, R. I., Saio, H., Ekström, S., Georgy, C., & Meynet, G. 2016, A&A, 591, A8 [NASA ADS] [CrossRef] [EDP Sciences] [Google Scholar]
- Astropy Collaboration (Robitaille, T. P., et al.) 2013, A&A, 558, A33 [NASA ADS] [CrossRef] [EDP Sciences] [Google Scholar]
- Banerjee, S., & Kroupa, P. 2013, ApJ, 764, 29 [CrossRef] [Google Scholar]
- Banerjee, S., & Kroupa, P. 2017, A&A, 597, A28 [NASA ADS] [CrossRef] [EDP Sciences] [Google Scholar]
- Baumgardt, H., & Kroupa, P. 2007, MNRAS, 380, 1589 [NASA ADS] [CrossRef] [Google Scholar]
- Baumgardt, H., & Makino, J. 2003, MNRAS, 340, 227 [NASA ADS] [CrossRef] [Google Scholar]
- Baumgardt, H., Hut, P., & Heggie, D. C. 2002, MNRAS, 336, 1069 [NASA ADS] [CrossRef] [Google Scholar]
- Bettis, D. G., & Szebehely, V. 1971, Ap&SS, 14, 133 [NASA ADS] [CrossRef] [Google Scholar]
- Bik, A., Lamers, H. J. G. L. M., Bastian, N., Panagia, N., & Romaniello, M. 2003, A&A, 397, 473 [CrossRef] [EDP Sciences] [Google Scholar]
- Binney, J., & Tremaine, S. 2008, Galactic Dynamics: Second Edition (Princeton: Princeton University Press) [Google Scholar]
- Bonnell, I. A., & Davies, M. B. 1998, MNRAS, 295, 691 [CrossRef] [Google Scholar]
- Bono, G., Marconi, M., Cassisi, S., et al. 2005, ApJ, 621, 966 [NASA ADS] [CrossRef] [Google Scholar]
- Bosma, A. 1981, AJ, 86, 1825 [NASA ADS] [CrossRef] [Google Scholar]
- Breuval, L., Kervella, P., Anderson, R. I., et al. 2020, A&A, 643, A115 [EDP Sciences] [Google Scholar]
- Brinkmann, N., Banerjee, S., Motwani, B., & Kroupa, P. 2017, A&A, 600, A49 [NASA ADS] [CrossRef] [EDP Sciences] [Google Scholar]
- Cantat-Gaudin, T., Jordi, C., Vallenari, A., et al. 2018, A&A, 618, A93 [NASA ADS] [CrossRef] [EDP Sciences] [Google Scholar]
- Cantat-Gaudin, T., Anders, F., Castro-Ginard, A., et al. 2020, A&A, 640, A1 [NASA ADS] [CrossRef] [EDP Sciences] [Google Scholar]
- Casertano, S., & Hut, P. 1985, ApJ, 298, 80 [Google Scholar]
- Castro-Ginard, A., Jordi, C., Luri, X., et al. 2020, A&A, 635, A45 [NASA ADS] [CrossRef] [EDP Sciences] [Google Scholar]
- Castro-Ginard, A., Jordi, C., Luri, X., et al. 2022, A&A, in press, [arXiv:2111.01819] [Google Scholar]
- de la Fuente Marcos, R., & de la Fuente Marcos, C. 2004, New Astron., 9, 475 [NASA ADS] [CrossRef] [Google Scholar]
- Dékány, I., Minniti, D., Hajdu, G., et al. 2015, ApJ, 799, L11 [CrossRef] [Google Scholar]
- Dias, W. S., Monteiro, H., Moitinho, A., et al. 2021, MNRAS, 504, 356 [NASA ADS] [CrossRef] [Google Scholar]
- Dinnbier, F., & Kroupa, P. 2020, A&A, 640, A84 [EDP Sciences] [Google Scholar]
- Eggleton, P. P. 1983, ApJ, 268, 368 [Google Scholar]
- Evans, N. R., Günther, H. M., Bond, H. E., et al. 2020, ApJ, 905, 81 [CrossRef] [Google Scholar]
- Ferrarese, L., Silbermann, N. A., Mould, J. R., et al. 2000, PASP, 112, 177 [NASA ADS] [CrossRef] [Google Scholar]
- Ferreira, F. A., Corradi, W. J. B., Maia, F. F. S., Angelo, M. S., & Santos, J. F. C., Jr. 2021, MNRAS, 502, L90 [NASA ADS] [CrossRef] [Google Scholar]
- Fischer, P., Welch, D. L., Cote, P., Mateo, M., & Madore, B. F. 1992, AJ, 103, 857 [NASA ADS] [CrossRef] [Google Scholar]
- Fujii, M. S., & Portegies Zwart, S. 2011, Science, 334, 1380 [Google Scholar]
- Gaia Collaboration (Prusti, T., et al.) 2016, A&A, 595, A1 [NASA ADS] [CrossRef] [EDP Sciences] [Google Scholar]
- Gaia Collaboration (Brown, A. G. A., et al.) 2021, A&A, 649, A1 [NASA ADS] [CrossRef] [EDP Sciences] [Google Scholar]
- Geyer, M. P., & Burkert, A. 2001, MNRAS, 323, 988 [NASA ADS] [CrossRef] [Google Scholar]
- Gieles, M., Larsen, S. S., Bastian, N., & Stein, I. T. 2006, A&A, 450, 129 [NASA ADS] [CrossRef] [EDP Sciences] [Google Scholar]
- Goodwin, S. P. 1997, MNRAS, 284, 785 [Google Scholar]
- Goodwin, S. P., & Kroupa, P. 2005, A&A, 439, 565 [NASA ADS] [CrossRef] [EDP Sciences] [Google Scholar]
- Heggie, D. C. 1975, MNRAS, 173, 729 [NASA ADS] [CrossRef] [Google Scholar]
- Holl, B., Audard, M., Nienartowicz, K., et al. 2018, A&A, 618, A30 [NASA ADS] [CrossRef] [EDP Sciences] [Google Scholar]
- Hunt, E. L., & Reffert, S. 2021, A&A, 646, A104 [NASA ADS] [CrossRef] [EDP Sciences] [Google Scholar]
- Hunter, J. D. 2007, Comput. Sci. Eng., 9, 90 [NASA ADS] [CrossRef] [Google Scholar]
- Hurley, J. R., Pols, O. R., & Tout, C. A. 2000, MNRAS, 315, 543 [Google Scholar]
- Hurley, J. R., Tout, C. A., & Pols, O. R. 2002, MNRAS, 329, 897 [Google Scholar]
- Hurley, J. R., Tout, C. A., Aarseth, S. J., & Pols, O. R. 2004, MNRAS, 355, 1207 [NASA ADS] [CrossRef] [Google Scholar]
- Irrgang, A., Wilcox, B., Tucker, E., & Schiefelbein, L. 2013, A&A, 549, A137 [NASA ADS] [CrossRef] [EDP Sciences] [Google Scholar]
- Irwin, J. B. 1955, Mon. Notes Astron. Soc. S. Afr., 14, 38 [NASA ADS] [Google Scholar]
- Jerabkova, T., Boffin, H. M. J., Beccari, G., et al. 2021, A&A, 647, A137 [NASA ADS] [CrossRef] [EDP Sciences] [Google Scholar]
- Johnson, L. C., Seth, A. C., Dalcanton, J. J., et al. 2017, ApJ, 839, 78 [NASA ADS] [CrossRef] [Google Scholar]
- Kholopov, P. N. 1956, Peremennye Zvezdy, 11, 325 [NASA ADS] [Google Scholar]
- Kochanek, C. S. 1992, ApJ, 385, 604 [NASA ADS] [CrossRef] [Google Scholar]
- Kroupa, P. 1995a, MNRAS, 277, 1507 [NASA ADS] [Google Scholar]
- Kroupa, P. 1995b, MNRAS, 277, 1491 [Google Scholar]
- Kroupa, P. 2001, MNRAS, 322, 231 [NASA ADS] [CrossRef] [Google Scholar]
- Kroupa, P., Aarseth, S., & Hurley, J. 2001, MNRAS, 321, 699 [NASA ADS] [CrossRef] [Google Scholar]
- Kuhn, M. A., Feigelson, E. D., Getman, K. V., et al. 2014, ApJ, 787, 107 [Google Scholar]
- Küpper, A. H. W., MacLeod, A., & Heggie, D. C. 2008, MNRAS, 387, 1248 [Google Scholar]
- Küpper, A. H. W., Kroupa, P., Baumgardt, H., & Heggie, D. C. 2010, MNRAS, 401, 105 [Google Scholar]
- Küpper, A. H. W., Maschberger, T., Kroupa, P., & Baumgardt, H. 2011, MNRAS, 417, 2300 [Google Scholar]
- Kustaanheimo, P., & Stiefel, E. 1965, Reine Angew. Math., 218, 204 [Google Scholar]
- Lada, C. J., & Lada, E. A. 2003, ARA&A, 41, 57 [Google Scholar]
- Lada, C. J., Margulis, M., & Dearborn, D. 1984, ApJ, 285, 141 [NASA ADS] [CrossRef] [Google Scholar]
- Lada, E. A., Depoy, D. L., Evans, N. J., III, & Gatley, I. 1991, ApJ, 371, 171 [NASA ADS] [CrossRef] [Google Scholar]
- Leavitt, H. S., & Pickering, E. C. 1912, Harv. Coll. Obs. Circ., 173, 1 [Google Scholar]
- Lewis, A. R., Dolphin, A. E., Dalcanton, J. J., et al. 2015, ApJ, 805, 183 [NASA ADS] [CrossRef] [Google Scholar]
- Loktin, A. V., & Popova, M. E. 2017, Astrophys. Bull., 72, 257 [NASA ADS] [CrossRef] [Google Scholar]
- Majaess, D., Carraro, G., Moni Bidin, C., et al. 2013, A&A, 560, A22 [NASA ADS] [CrossRef] [EDP Sciences] [Google Scholar]
- Makino, J. 1991, ApJ, 369, 200 [Google Scholar]
- Makino, J., & Aarseth, S. J. 1992, PASJ, 44, 141 [NASA ADS] [Google Scholar]
- Mardling, R., & Aarseth, S. 1999, in The Dynamics of Small Bodies in the Solar System, A Major Key to Solar System Studies, eds. B. A. Steves, & A. E. Roy, NATO Adv. Study Inst. (ASI) Ser. C, 522, 385 [NASA ADS] [CrossRef] [Google Scholar]
- Marks, M., & Kroupa, P. 2012, A&A, 543, A8 [NASA ADS] [CrossRef] [EDP Sciences] [Google Scholar]
- McMillan, S. L. W., Vesperini, E., & Portegies Zwart, S. F. 2007, ApJ, 655, L45 [Google Scholar]
- Medina, G. E., Lemasle, B., & Grebel, E. K. 2021, MNRAS, 505, 1342 [NASA ADS] [CrossRef] [Google Scholar]
- Megeath, S. T., Gutermuth, R., Muzerolle, J., et al. 2016, AJ, 151, 5 [Google Scholar]
- Meingast, S., & Alves, J. 2019, A&A, 621, L3 [NASA ADS] [CrossRef] [EDP Sciences] [Google Scholar]
- Mikkola, S., & Aarseth, S. J. 1990, Celest. Mech. Dyn. Astron., 47, 375 [CrossRef] [Google Scholar]
- Miyamoto, M., & Nagai, R. 1975, PASJ, 27, 533 [NASA ADS] [Google Scholar]
- Moe, M., & Di Stefano, R. 2017, ApJS, 230, 15 [Google Scholar]
- Mouri, H., & Taniguchi, Y. 2002, ApJ, 580, 844 [NASA ADS] [CrossRef] [Google Scholar]
- Musella, I., Marconi, M., Stetson, P. B., et al. 2016, MNRAS, 457, 3084 [CrossRef] [Google Scholar]
- Oh, S., & Kroupa, P. 2016, A&A, 590, A107 [NASA ADS] [CrossRef] [EDP Sciences] [Google Scholar]
- Oh, S., Kroupa, P., & Pflamm-Altenburg, J. 2015, ApJ, 805, 92 [Google Scholar]
- Pawlak, M., Pejcha, O., Jakubčík, P., et al. 2019, MNRAS, 487, 5932 [NASA ADS] [CrossRef] [Google Scholar]
- Perets, H. B., & Šubr, L. 2012, ApJ, 751, 133 [Google Scholar]
- Pflamm-Altenburg, J., & Kroupa, P. 2006, MNRAS, 373, 295 [NASA ADS] [CrossRef] [Google Scholar]
- Pflamm-Altenburg, J., & Kroupa, P. 2008, Nature, 455, 641 [Google Scholar]
- Pflamm-Altenburg, J., González-Lópezlira, R. A., & Kroupa, P. 2013, MNRAS, 435, 2604 [CrossRef] [Google Scholar]
- Porras, A., Christopher, M., Allen, L., et al. 2003, AJ, 126, 1916 [NASA ADS] [CrossRef] [Google Scholar]
- Pouliasis, E., Di Matteo, P., & Haywood, M. 2017, A&A, 598, A66 [NASA ADS] [CrossRef] [EDP Sciences] [Google Scholar]
- Riess, A. G., Yuan, W., Casertano, S., Macri, L. M., & Scolnic, D. 2020, ApJ, 896, L43 [Google Scholar]
- Ripepi, V., Molinaro, R., Musella, I., et al. 2019, A&A, 625, A14 [NASA ADS] [CrossRef] [EDP Sciences] [Google Scholar]
- Röser, S., Schilbach, E., & Goldman, B. 2019, A&A, 621, L2 [NASA ADS] [CrossRef] [EDP Sciences] [Google Scholar]
- Rubin, V. C., Ford, W. K., Jr., Thonnard, N., & Burstein, D. 1982, ApJ, 261, 439 [NASA ADS] [CrossRef] [Google Scholar]
- Samus’, N. N., Kazarovets, E. V., Durlevich, O. V., Kireeva, N. N., & Pastukhova, E. N. 2017, Astron. Rep., 61, 80 [Google Scholar]
- Sana, H., de Mink, S. E., de Koter, A., et al. 2012, Science, 337, 444 [Google Scholar]
- Sandage, A. 1958, ApJ, 128, 150 [NASA ADS] [CrossRef] [Google Scholar]
- Scargle, J. D., Norris, J. P., Jackson, B., & Chiang, J. 2013, ApJ, 764, 167 [Google Scholar]
- Schoettler, C., de Bruijne, J., Vaher, E., & Parker, R. J. 2020, MNRAS, 495, 3104 [NASA ADS] [CrossRef] [Google Scholar]
- Senchyna, P., Johnson, L. C., Dalcanton, J. J., et al. 2015, ApJ, 813, 31 [CrossRef] [Google Scholar]
- Sollima, A. 2020, MNRAS, 495, 2222 [Google Scholar]
- Soszyński, I., Udalski, A., Szymański, M. K., et al. 2020, Acta Astron., 70, 101 [Google Scholar]
- Spera, M., Mapelli, M., & Jeffries, R. D. 2016, MNRAS, 460, 317 [NASA ADS] [CrossRef] [Google Scholar]
- Spitzer, L., Jr. 1958, ApJ, 127, 17 [NASA ADS] [CrossRef] [Google Scholar]
- Spitzer, L., Jr. 1969, ApJ, 158, L139 [NASA ADS] [CrossRef] [Google Scholar]
- Stanimirović, S., Staveley-Smith, L., & Jones, P. A. 2004, ApJ, 604, 176 [Google Scholar]
- Sterzik, M. F., & Durisen, R. H. 1998, A&A, 339, 95 [NASA ADS] [Google Scholar]
- Stiefel, E. L., & Scheifele, G. 1975, Linear and Regular Celestial Mechanics. Perturbed Two-body Motion. Numerical Methods. Canonical Theory, 303 [Google Scholar]
- Tanikawa, A., Hut, P., & Makino, J. 2012, New Astron., 17, 272 [NASA ADS] [CrossRef] [Google Scholar]
- Terlevich, E. 1987, MNRAS, 224, 193 [NASA ADS] [CrossRef] [Google Scholar]
- Testa, V., Marconi, M., Musella, I., et al. 2007, A&A, 462, 599 [NASA ADS] [CrossRef] [EDP Sciences] [Google Scholar]
- Theuns, T. 1992, A&A, 259, 493 [NASA ADS] [Google Scholar]
- Tout, C. A., Pols, O. R., Eggleton, P. P., & Han, Z. 1996, MNRAS, 281, 257 [Google Scholar]
- Turner, D. G. 1976, AJ, 81, 1125 [NASA ADS] [CrossRef] [Google Scholar]
- Turner, D. G., & Burke, J. F. 2002, AJ, 124, 2931 [NASA ADS] [CrossRef] [Google Scholar]
- Tutukov, A. V. 1978, A&A, 70, 57 [NASA ADS] [Google Scholar]
- van der Marel, R. P., & Kallivayalil, N. 2014, ApJ, 781, 121 [Google Scholar]
- Vesperini, E., & Heggie, D. C. 1997, MNRAS, 289, 898 [Google Scholar]
- Wang, L., Kroupa, P., & Jerabkova, T. 2019, MNRAS, 484, 1843 [NASA ADS] [CrossRef] [Google Scholar]
- Watson, C. L., Henden, A. A., & Price, A. 2006, Soc. Astron. Sci. Annu. Symp., 25, 47 [Google Scholar]
- Weidner, C., Kroupa, P., & Larsen, S. S. 2004, MNRAS, 350, 1503 [CrossRef] [Google Scholar]
- Weidner, C., Kroupa, P., & Bonnell, I. A. D. 2010, MNRAS, 401, 275 [NASA ADS] [CrossRef] [Google Scholar]
- Welch, D. L., & Stetson, P. B. 1993, AJ, 105, 1813 [NASA ADS] [CrossRef] [Google Scholar]
- Whitmore, B. C., Zhang, Q., Leitherer, C., et al. 1999, AJ, 118, 1551 [CrossRef] [Google Scholar]
- Zhou, X., & Chen, X. 2021, MNRAS, 504, 4768 [NASA ADS] [CrossRef] [Google Scholar]
Appendix A: Detection of Cepheids originating from stellar mergers
Since we detect Cepheids automatically according to their evolution in the HR diagram (the description is in Sect. 3), it is important to make sure that the recipe is able to deal not only with stars evolving in isolation, but also with more complicated cases including binary star evolution and stellar mergers. Typical examples (for Z = 0.014) are shown in Figure A.1.
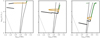 |
Fig. A.1. Examples of HR diagrams where the evolutionary path of the primary had been altered by a merger with the secondary. These plots show examples from the library of simulations calculated by NBODY6 for Z = 0.014. The evolution from the terminal age main-sequence to core He burning is represented by black points, during core He burning by orange points, and afterwards by green points. The coalescence causes a sudden increase of luminosity, which can be seen as the discontinuity in the evolutionary tracks. The instability strip and ZAMS are shown by the thick and thin black lines, respectively. Left panel: Coalescence with relatively massive secondary (7 M⊙), which increases the primary mass so much that the merger object does not become a Cepheid. Middle panel: Coalescence with a lower mass secondary, which does not prevent the star from becoming a Cepheid. Right panel: Lower mass primary (4.3 M⊙), which would not have evolved to a Cepheid in isolation, becomes a Cepheid after a coalescence. |
The left panel details the evolution of a 11 M⊙ and 7 M⊙ binary with initial orbital period of 27 days, which coalesces when the primary increases in radius as it evolves out of the MS (the discontinuity before core He burning). The merger mass is 14.1 M⊙. Core He burning (orange points) then commences leftwards of the blue boundary of the instability strip, and the star monotonically decreases in effective temperature during this stage, which is dissimilar to the loop experienced by Cepheids. For this reason, the star does not fulfil condition (iii) for the detection of Cepheids (Sect. 3).
The middle panel shows a 8.4 M⊙ primary with a secondary of 1.1 M⊙ and initial orbital period of 13 days. In this case, the coalescence only slightly increases the mass, and the ProCep becomes a Cepheid.
The right panel shows coalescence of a primary of ZAMS mass 4.3 M⊙ with its 1.6 M⊙ companion. For a metallicity of Z = 0.014, the initial mass of the primary is lower than the mass threshold for Cepheids, which is mmin, Ceph = 4.7 M⊙. After the coalescence, the merged star has a mass of 5.3 M⊙, and it becomes a Cepheid.
The cases in the middle and right panels are detected as Cepheids by the automatic routine. The case in the left panel is not detected as a Cepheid. This demonstrates that the automatic procedure is able to identify Cepheids also for more complicated evolutionary tracks including mergers.
Appendix B: Comparison of the evolution of ProCeps in a lower mass (100 M⊙) and a more massive (3200 M⊙) cluster
The lower mass cluster, which contains three ProCeps in total, segregates its more massive stars before the onset of gas expulsion at 0.6 Myr (upper row of Figure B.1). At this time (upper middle panel), two ProCeps are already near the cluster centre. The third ProCep, which is located at x ≈ −0.6 pc, returns to the cluster centre, where it interacts with the other two Cepheids, forming a densely bound system. This results in all three ProCeps being concentrated at the cluster centre, while lower mass stars are more dispersed or escape the cluster (upper right panel). The complicated interaction between the most massive bodies ejects one of the ProCep and a lower mass star at 7.2 Myr (shown only in the online material).
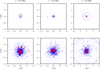 |
Fig. B.1. Evolutionary snapshots for an example of a lower mass (100 M⊙; upper row) and more massive star clusters (3200 M⊙; lower row). The plots are shown at the beginning of the simulations (left column), immediately before the beginning of gas expulsion (middle column), and after gas expulsion; the time is indicated above the panels. ProCeps are marked red, while stars with mass below mmin, Ceph or above mmax, Ceph are marked blue. Compact objects (seen only in the online material) are marked black. Stellar mass is proportional to the area of the dots. The magenta circle shows the cluster tidal radius. We note that the length scale in the right column is inflated by a factor of 10. The evolution of both star clusters up to 12 Myr can be seen as movies in the online material. |
In contrast, the more massive star cluster (lower row of Figure B.1) does not mass segregate ProCeps before gas expulsion, which results in the population of ProCeps being dispersed throughout the cluster to a similar degree as the lower mass stars. Gas expulsion then unbinds a comparable fraction of ProCeps as low mass stars from the cluster.
All Tables
All Figures
|
Fig. 1. HR diagrams outputted from NBODY6 for single stars of ZAMS mass of 4 M⊙ (left panel), 7 M⊙ (middle panel), and 10 M⊙ (right panel). The evolutionary paths are plotted after the stars left the main sequence. The colour indicates the metallicity, which is Z = 0.002 (blue), Z = 0.006 (green), and Z = 0.014 (red). Large crosses denote the time of core helium burning. For the purpose of this plot, we selected single stars, which evolve well in isolation from the other stars in the cluster. Thick solid lines show the Cepheid instability strip for the metallicities considered (Anderson et al. 2016). Thin solid lines represent ZAMS for stars of corresponding metallicity. |
| In the text | |
|
Fig. 2. Fraction of star clusters |
| In the text | |
|
Fig. 3. Evolution of half-mass radius rh of ProCeps (solid lines) and lower mass stars (dotted lines) for clusters of mass Mecl = 100 M⊙, 400 M⊙, 1600 M⊙ and 6400 M⊙. The clusters orbit the galaxy at Rg = 8 kpc and have metallicity Z = 0.014. The vertical yellow line shows the time of gas expulsion td. The least massive clusters (Mecl = 100 M⊙; cyan) mass segregate their ProCeps before td, which results in ProCeps being more concentrated than lower mass stars. The following gas expulsion then preferentially unbinds stars from outskirts of the cluster, which are lower mass stars, resulting in a cluster that contains disproportionately more ProCeps. In contrast, the more massive clusters do not mass segregate before td, so the stellar loss due to gas expulsion affects ProCeps in a similar way to lower mass stars. |
| In the text | |
|
Fig. 4. Abundance of ProCeps η relatively to the lower mass stars in clusters as a function of time t. The time tee, indicating the transition between stars escaping due to gas expulsion (t < tee) and evaporation (t > tee) is indicated by vertical lines. While the non-mass-segregated clusters (Mecl ≳ 400 M⊙) have only small changes in η, the mass-segregated cluster (Mecl = 100 M⊙) has an increase in η around time tee. To avoid rapid fluctuations due to small number statistics, the plots are terminated when there are fewer than 10 ProCeps in clusters in all realisations of clusters of given mass. The figure represents clusters at Rg = 8 kpc and Z = 0.014. |
| In the text | |
|
Fig. 5. Dynamical mechanisms responsible for stellar escapes as a function of the cluster mass. For each cluster mass, we plot two bar plots; the left bar plot represents ProCeps, the right bar plot represents lower mass stars. The colours indicate the relative number of stars in each group which escaped due to gas expulsion (blue), dynamical evaporation (green), dynamical ejection (red), and the rest which either terminated their core Helium burning within the cluster (for ProCeps) or are still present in the cluster by the age of 145 Myr (yellow). We note that in the least massive clusters (Mecl ≲ 200 M⊙), which mass segregate before td, lower mass stars and ProCeps react differently to gas expulsion: as Mecl decreases, more low-mass stars are unbound, while fewer ProCeps are unbound. The figure is for clusters with Rg = 8 kpc and Z = 0.014. |
| In the text | |
|
Fig. 6. Fraction pCC(Mecl, t) of cluster Cepheids as a function of time for clusters orbiting the galaxy at different galactocentric radii: Rg = 4 kpc (upper panel), Rg = 8 kpc (middle panel), and Rg = 12 kpc (lower panel). The cluster mass is indicated by colour. Metallicity is Z = 0.014 for all models. The plot shows all Cepheids including UpCeps, which occur after tHe, end. Generally, pCC(Mecl, t) decreases with time for lower mass clusters (Mecl ≲ 800 M⊙), and it stays approximately constant for clusters more massive than that. The histogram is binned by the Bayesian blocks algorithm. The lines terminate at 300 Myr or at the occurrence of the last Cepheid. |
| In the text | |
|
Fig. 7. Left panel: fraction of cluster Cepheids pCC(Mecl) (including UpCeps) as a function of cluster mass Mecl integrated over the first 300 Myr of the cluster evolution. Clusters orbiting at different galactocentric radii Rg are denoted by different symbols; clusters with different metallicity Z are denoted by different colour of the symbol. The external field of the galaxy, which impacts the lower mass clusters more, is responsible for the decrease of pCC(Mecl) with Rg. pCC(Mecl) increases with Mecl because more massive clusters withstand gas expulsion and the tidal field of the galaxy better. For lower mass clusters, pCC(Mecl) decreases with metallicity because Cepheids occur later at lower Z, at which time more low-mass clusters have been dissolved. Right panel: mean mass of Cepheids in the cluster as a function of Mecl. At a given metallicity, |
| In the text | |
|
Fig. 8. Fraction of cluster Cepheids pCC(mCeph) as a function of the Cepheid mass mCeph for Cepheids originating from clusters at different galactocentric radius Rg (indicated by symbols) and of different metallicity Z (indicated by colour). The plot represents Cepheids originating from the whole population of star clusters of the ECMF of Eq. (3). Cepheids of higher mass have a slightly higher probability of being found in clusters. |
| In the text | |
|
Fig. 9. Fraction of cluster Cepheids pCC(Mecl, t) as a function of time for clusters of different metallicities: Z = 0.014 (upper panel), Z = 0.006 (middle panel), Z = 0.002 (lower panel). The cluster mass is indicated by colour. All clusters have Rg = 8 kpc. |
| In the text | |
|
Fig. 10. Time dependence of CCmult for CanCeps (solid lines) and all Cepheids (dashed lines) in clusters of different mass as shown by the colour. The grey vertical dashed lines indicate the time tHe, end for the given metallicity. The histograms are binned by the Bayesian block method. The lines are shown for the interval marked by the occurrence of the first and last Cepheid in clusters in present models (the discretisation to individual Cepheids is the reason why all models do not reach exactly 300 Myr). |
| In the text | |
|
Fig. 11. Normalised histograms of the number of Cepheids located in the same cluster, CCmult, at a given time as a function of cluster mass and metallicity. The numbers above the columns indicate the number fraction of clusters which contained zero to four Cepheids at the same time. The Cepheids taken into account are the CanCeps only. None of the clusters contained more than six Cepheids at the same time. |
| In the text | |
|
Fig. 12. Cumulative distribution of Cepheids according to the distance r to the density centre of their birth cluster for the whole population of star clusters from the ECMF of Eq. (3). We only plot the Cepheids whose birth cluster is still gravitationally bound at the time of the occurrence of the Cepheid. |
| In the text | |
|
Fig. A.1. Examples of HR diagrams where the evolutionary path of the primary had been altered by a merger with the secondary. These plots show examples from the library of simulations calculated by NBODY6 for Z = 0.014. The evolution from the terminal age main-sequence to core He burning is represented by black points, during core He burning by orange points, and afterwards by green points. The coalescence causes a sudden increase of luminosity, which can be seen as the discontinuity in the evolutionary tracks. The instability strip and ZAMS are shown by the thick and thin black lines, respectively. Left panel: Coalescence with relatively massive secondary (7 M⊙), which increases the primary mass so much that the merger object does not become a Cepheid. Middle panel: Coalescence with a lower mass secondary, which does not prevent the star from becoming a Cepheid. Right panel: Lower mass primary (4.3 M⊙), which would not have evolved to a Cepheid in isolation, becomes a Cepheid after a coalescence. |
| In the text | |
|
Fig. B.1. Evolutionary snapshots for an example of a lower mass (100 M⊙; upper row) and more massive star clusters (3200 M⊙; lower row). The plots are shown at the beginning of the simulations (left column), immediately before the beginning of gas expulsion (middle column), and after gas expulsion; the time is indicated above the panels. ProCeps are marked red, while stars with mass below mmin, Ceph or above mmax, Ceph are marked blue. Compact objects (seen only in the online material) are marked black. Stellar mass is proportional to the area of the dots. The magenta circle shows the cluster tidal radius. We note that the length scale in the right column is inflated by a factor of 10. The evolution of both star clusters up to 12 Myr can be seen as movies in the online material. |
| In the text | |
Current usage metrics show cumulative count of Article Views (full-text article views including HTML views, PDF and ePub downloads, according to the available data) and Abstracts Views on Vision4Press platform.
Data correspond to usage on the plateform after 2015. The current usage metrics is available 48-96 hours after online publication and is updated daily on week days.
Initial download of the metrics may take a while.