Fig. 10.
Download original image
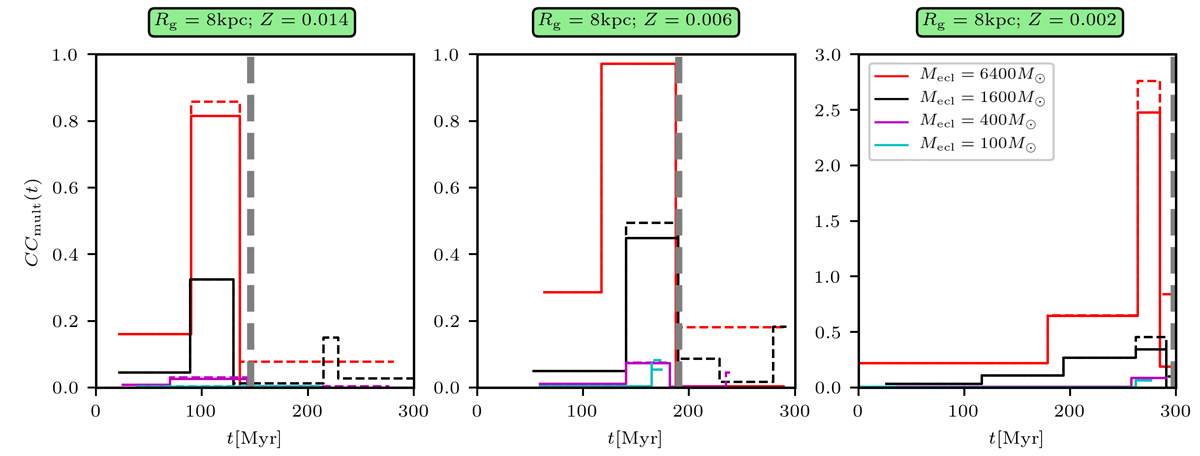
Time dependence of CCmult for CanCeps (solid lines) and all Cepheids (dashed lines) in clusters of different mass as shown by the colour. The grey vertical dashed lines indicate the time tHe, end for the given metallicity. The histograms are binned by the Bayesian block method. The lines are shown for the interval marked by the occurrence of the first and last Cepheid in clusters in present models (the discretisation to individual Cepheids is the reason why all models do not reach exactly 300 Myr).
Current usage metrics show cumulative count of Article Views (full-text article views including HTML views, PDF and ePub downloads, according to the available data) and Abstracts Views on Vision4Press platform.
Data correspond to usage on the plateform after 2015. The current usage metrics is available 48-96 hours after online publication and is updated daily on week days.
Initial download of the metrics may take a while.