Fig. 4.
Download original image
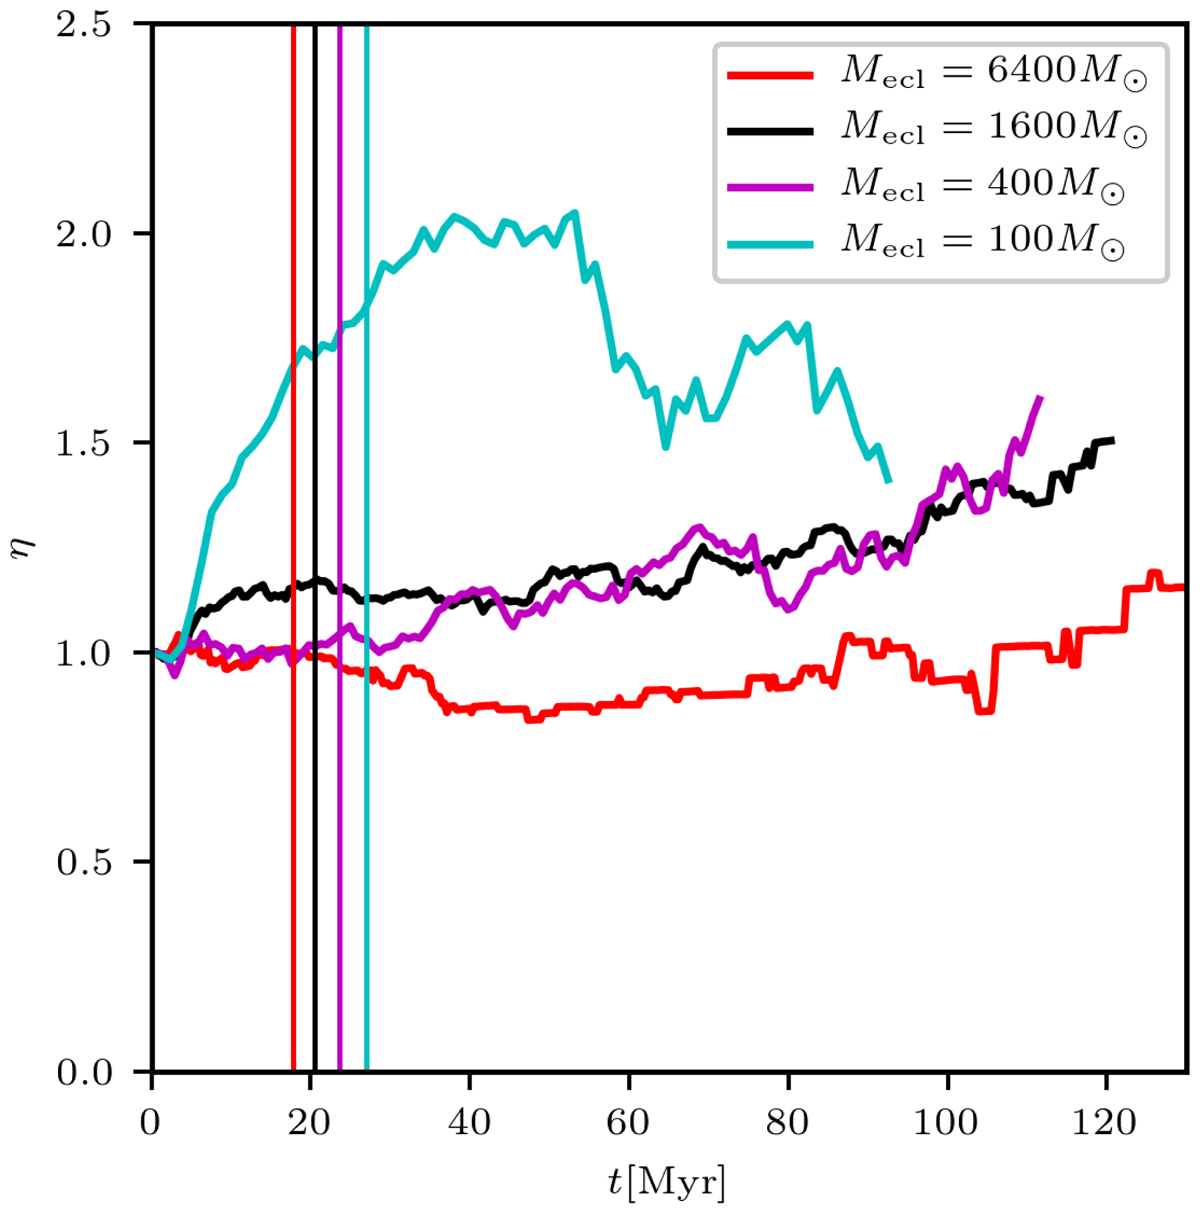
Abundance of ProCeps η relatively to the lower mass stars in clusters as a function of time t. The time tee, indicating the transition between stars escaping due to gas expulsion (t < tee) and evaporation (t > tee) is indicated by vertical lines. While the non-mass-segregated clusters (Mecl ≳ 400 M⊙) have only small changes in η, the mass-segregated cluster (Mecl = 100 M⊙) has an increase in η around time tee. To avoid rapid fluctuations due to small number statistics, the plots are terminated when there are fewer than 10 ProCeps in clusters in all realisations of clusters of given mass. The figure represents clusters at Rg = 8 kpc and Z = 0.014.
Current usage metrics show cumulative count of Article Views (full-text article views including HTML views, PDF and ePub downloads, according to the available data) and Abstracts Views on Vision4Press platform.
Data correspond to usage on the plateform after 2015. The current usage metrics is available 48-96 hours after online publication and is updated daily on week days.
Initial download of the metrics may take a while.