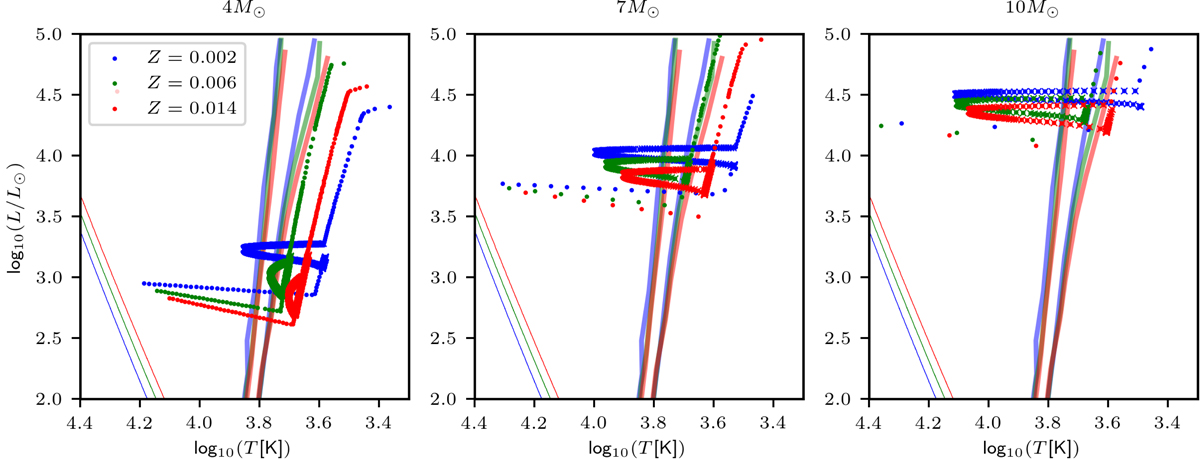
Fig. 1.

Download original image
HR diagrams outputted from NBODY6 for single stars of ZAMS mass of 4 M⊙ (left panel), 7 M⊙ (middle panel), and 10 M⊙ (right panel). The evolutionary paths are plotted after the stars left the main sequence. The colour indicates the metallicity, which is Z = 0.002 (blue), Z = 0.006 (green), and Z = 0.014 (red). Large crosses denote the time of core helium burning. For the purpose of this plot, we selected single stars, which evolve well in isolation from the other stars in the cluster. Thick solid lines show the Cepheid instability strip for the metallicities considered (Anderson et al. 2016). Thin solid lines represent ZAMS for stars of corresponding metallicity.
Current usage metrics show cumulative count of Article Views (full-text article views including HTML views, PDF and ePub downloads, according to the available data) and Abstracts Views on Vision4Press platform.
Data correspond to usage on the plateform after 2015. The current usage metrics is available 48-96 hours after online publication and is updated daily on week days.
Initial download of the metrics may take a while.


