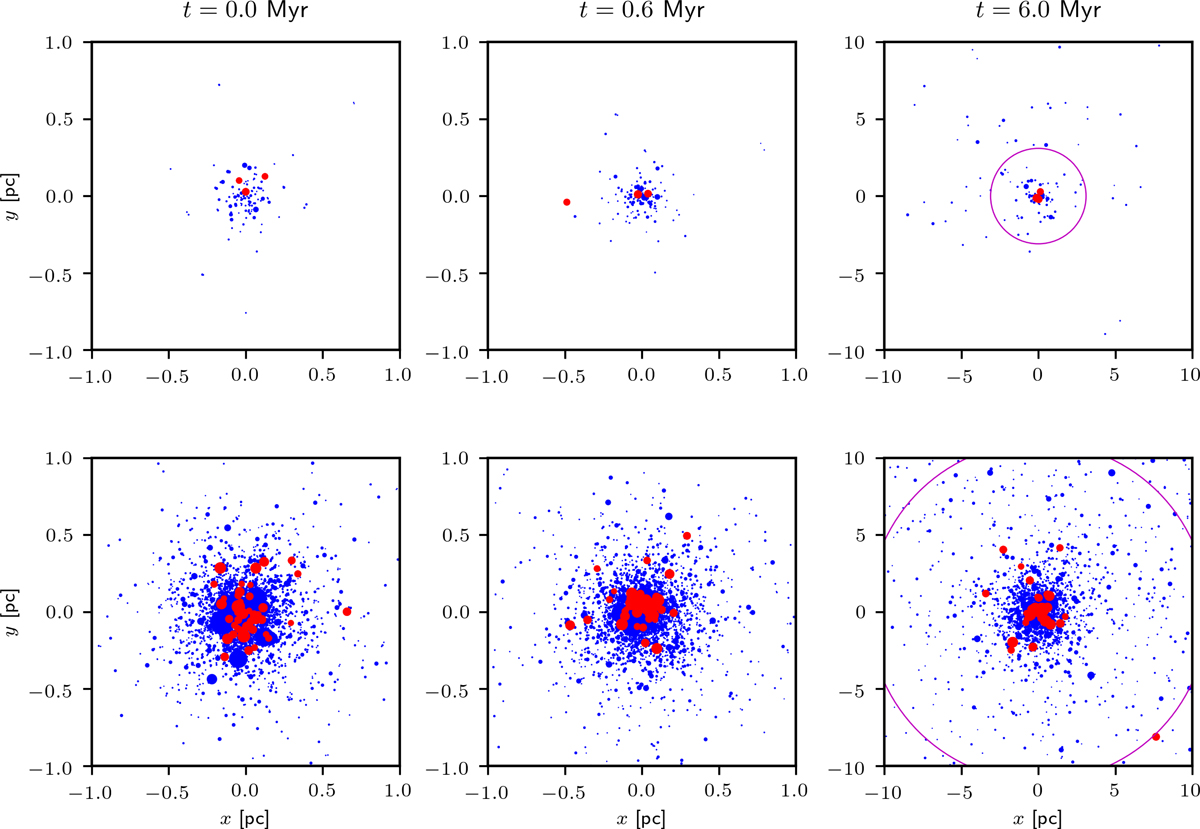
Fig. B.1.
Download original image
Evolutionary snapshots for an example of a lower mass (100 M⊙; upper row) and more massive star clusters (3200 M⊙; lower row). The plots are shown at the beginning of the simulations (left column), immediately before the beginning of gas expulsion (middle column), and after gas expulsion; the time is indicated above the panels. ProCeps are marked red, while stars with mass below mmin, Ceph or above mmax, Ceph are marked blue. Compact objects (seen only in the online material) are marked black. Stellar mass is proportional to the area of the dots. The magenta circle shows the cluster tidal radius. We note that the length scale in the right column is inflated by a factor of 10. The evolution of both star clusters up to 12 Myr can be seen as movies in the online material.
Current usage metrics show cumulative count of Article Views (full-text article views including HTML views, PDF and ePub downloads, according to the available data) and Abstracts Views on Vision4Press platform.
Data correspond to usage on the plateform after 2015. The current usage metrics is available 48-96 hours after online publication and is updated daily on week days.
Initial download of the metrics may take a while.