| Issue |
A&A
Volume 658, February 2022
|
|
|---|---|---|
| Article Number | A85 | |
| Number of page(s) | 16 | |
| Section | Interstellar and circumstellar matter | |
| DOI | https://doi.org/10.1051/0004-6361/202142504 | |
| Published online | 03 February 2022 | |
Expanding the submillimeter wave spectroscopy and astronomical search for thioacetamide (CH3CSNH2) in the ISM★
1
National Radio Astronomy Observatory,
Charlottesville,
VA
22903,
USA
e-mail: This email address is being protected from spambots. You need JavaScript enabled to view it.
2
Department of Chemistry, University of Virginia,
Charlottesville,
VA
22903,
USA
3
Univ. Lille, CNRS, UMR 8523 - PhLAM - Physique des Lasers Atomes et Molécules,
59000
Lille,
France
4
Max-Planck-Institut für Radioastronomie,
Auf dem Hügel 69,
53121
Bonn,
Germany
5
INAF, Osservatorio Astrofisico di Arcetri,
Largo E. Fermi 5,
50125
Firenze,
Italy
6
Université Grenoble Alpes, CNRS, Institut de Planétologie et d’Astrophysique de Grenoble(IPAG),
38000
Grenoble,
France
7
Dipartimento di Chimica, Biologia e Biotecnologie, Università di Perugia,
Via Elce di Sotto 8,
06123
Perugia,
Italy
8
Dipartimento di Chimica “Giacomo Ciamician”, Università di Bologna,
Via Selmi 2,
40126,
Bologna,
Italy
9
Department of Astronomy, University of Virginia,
Charlottesville,
VA
22903,
USA
10
Department of Chemistry, Massachusetts Institute of Technology,
Cambridge,
MA
02139,
USA
Received:
21
October
2021
Accepted:
26
November
2021
Abstract
Context. One of the biggest unsolved mysteries of modern astrochemistry is understanding chemical formation pathways in the interstellar medium (ISM) and circumstellar environments. The detections (or even nondetections) of molecules composed of low-abundance atomic species (such as S, P, Si, and Mg) may help to constrain chemical pathways. Thioacetamide (CH3CSNH2) is the sulfur analog to acetemide (CH3CONH2) and it is a viable candidate to search for in astronomical environments – specifically toward regions where other S-bearing molecules have been found and, if possible, that also contain a detection of CH3CONH2. If detected, it would not only continue to expand the view of molecular complexity in astronomical environments, but also help to better elucidate the possible formation pathways of these types of species in these environments.
Aims. Our aim is to expand the frequency range of the measured rotational spectrum of CH3CSNH2 beyond 150 GHz and then to use those measurements to extend the search for this species in the ISM. The new laboratory measurements and expanded search cover more parameter space for determining under what conditions CH3CSNH2 may be detected, leading to possible constraints on the formation of large S-bearing molecules found in the ISM.
Methods. The rotational spectrum of CH3CSNH2 was investigated up to 650 GHz. Using the newly refined spectrum of CH3CSNH2, as well as additional spectroscopic data on the chemically related species CH3CONH2, a variety of astronomical sources were searched including data from the following large surveys: Prebiotic Interstellar Molecule Survey conducted with the Green Bank Telescope; Exploring molecular complexity with ALMA conducted with the Atacama Large Millimeter/submillimeter Array; and Astrochemical Surveys at IRAM conducted with the Institut de Radioastronomie Millimétrique 30 m Telescope.
Results. A total of 1428 transitions from the vt = 0 state with maximum values J = 47 and Ka = 20 in the range up to 330 GHz, and J = 95 and Ka = 20 in the range from 400–660 GHz were assigned. We also assigned 321 transitions from the vt = 1 state with the maximum values J = 35 and Ka = 9 up to 330 GHz. We achieved a final fit with a root-mean-square deviation of 43.4 kHz that contains 2035 measured lines from our study and the literature for vt = 0 and vt = 1 states of A and E symmetries. The final fit is based on the rho-axis-method Hamiltonian model that includes 40 parameters. An astronomical search for CH3CSNH2 was conducted based on all the new spectroscopic data. No transitions of CH3CSNH2 were detected toward any of the sources contained in our survey. Using the appropriate telescope and physical parameters for each astronomical source, upper limits to the column densities were found for CH3CSNH2 toward each source.
Key words: astrochemistry / line: identification / ISM: molecules / radio lines: ISM / submillimeter: ISM / methods: laboratory: molecular
The new spectroscopic line list is only available at the CDS via anonymous ftp to cdsarc.u-strasbg.fr (130.79.128.5) or via http://cdsarc.u-strasbg.fr/viz-bin/cat/J/A+A/658/A85
© ESO 2022
1 Introduction
One of the biggest unsolved mysteries of modern astrochemistry is understanding chemical formation pathways in the interstellar medium (ISM) and circumstellar environments (CSEs). The detections (or even nondetections) of new species are necessary to help calibrate and constrain existing chemical models in an attempt to make them more predictive. Using low-abundance atomic species (such as S, P, Si, and Mg) may help to constrain the chemical pathways. This is because routes to forming molecules from these elements are typically more limited than from species suchas C, O, N, and H that (1) form molecules easily; (2) are in large abundance; and (3) show a rich molecular chemistry. Furthermore, while molecules that formed from these low-abundance atomic species have primary formation pathways in the gas phase, for example, SiO (Rivero Santamaría et al. 2017), SiS (Mota et al. 2021), and HF (Neufeld & Wolfire 2009), grain surface chemistry is critical because grain surfaces provide sites of absorption and desorption where atomic species can interact and dissipate excess energy as a result of their formation. In addition, molecular species containing sulfur have been postulated to be used as “chemical clocks” to measure theoverall evolutionary state of an interstellar environment (for example, Matteucci 2001; Wakelam et al. 2004; Li et al. 2015). Sulfur is also extensively used in observations of solar system bodies such as Mars, Venus, Io, and meteorites to elucidate chemical and physical processes and the effects of solar radiation on these objects (Biver et al. 1999; Moullet et al. 2010; Belyaev et al. 2012; Franz et al. 2019). Sulfur bearing species are also sensitive to gas temperature and density and, as such, have been used to understand the physical environments of numerous astronomical environments (Charnley 1997; Esplugues et al. 2014; Semenov et al. 2018, and references therein).
However, the main sulfur carriers on grain mantles have yet to be fully characterized. Only OCS and SO2 have been unambiguously identified on grain surfaces (Palumbo et al. 1995, 1997; Zasowski et al. 2009). Hydrogen sulfide (H2S) – a main reactant in numerous chemical networks on grain surfaces – has yet to be identified (van der Tak et al. 2003).
From the list of known interstellar S-bearing molecules (Table 1), nearly all species havecorresponding detections of their O-substituted counterparts. For example, methanol (CH3OH) is the O-analog to methyl mercaptan (CH3SH). In fact, the only analogous O-bearing molecules that have yet to be detected from the list are diacetylene ether (C4O) and propadienone (CH2CCO). In addition,from a formation chemistry and detection point of view, it is very surprising that (CH2CCS) has been detected as well as its thioaldehyde isomer – HCCCHS (Cernicharo et al. 2021). This is completely opposite from what is found in the O-analog species. That is, the aldehyde HCCCHO is very abundant and easily detected toward several environments (Irvine et al. 1988; Hollis et al. 2004b; Requena-Torres et al. 2008) whereas CH2CCO has so far eluded detection, though recent theoretical predictions offer a possible explanation (Shingledecker et al. 2019). As such, searching for S-bearing species with already identified O-substituted counterparts in astronomical environments can provide a basis (or proxy) for searching for more complex species. And, while it may not always lead to a detection – or sometimes a completely different species may be found – searching for and setting detection limits will help to calibrate existing chemical networks that predict abundances of S-bearing species.
Acetamide (CH3CONH2) and N-methylformamide (CH3NHCHO), are two isomers which contain a peptide bond (Hollis et al. 2006a; Belloche et al. 2017; Ligterink et al. 2020). The detection of these molecules under interstellar conditions is important because (1) it again increases the limit of molecular complexity found in astronomical environments and (2) these molecules may provide a starting point to the formation of larger, more complex, prebiotic astronomical molecules. And, to date, the formation routes to these species are still uncertain. Thioacetamide (CH3CSNH2) is the sulfur analog to CH3CONH2 and is a viable candidate to search for in astronomical environments – specifically toward regions where other S-bearing molecules have been found and, if possible, that also contain a detection of CH3CONH2. If detected, it would not only continue to expand the limits of molecular complexity in astronomical environments but also help to better elucidate the possible formation pathway of these types of species in astronomical environments.
Thioacetamide is a planar, asymmetric top molecule with Cs symmetry. Its rotational spectrum was recorded recently by free-jet absorption spectroscopy in the 59.6–110.0 GHz frequency region (Maris et al. 2019). In addition to detecting the most abundant isotopologue, the 34S species was also observed in natural abundance (4.25%). Some of the rotational transition lines showed small splittings (1–2 MHz) due to the 14N nuclear quadrupole interaction. Because of the internal rotation of the methyl group, all lines are further split into A and E components. The barrier to this internal rotation is low (V3 ≈ 110 cm−1), which leads to the relatively large frequency splittings between the A and E states. That study also conducted the first attempt at an astronomical search for this molecule using the observational data from the unbiased Astronomical Surveys at IRAM (ASAI1) program (Lefloch et al. 2018) toward two sources (associated with low-mass star forming regions) that illustrated diverse and extreme physical conditions – L1544, a cold prestellar core, and L1157-B1, a shocked region within the ISM. These sources were also selected because the emission regions are known to be extended with respect to the IRAM 30 m beam (10′′–30′′), thus minimizing the affects of beam dilution. The observations were carried out at 3 mm (72–116 GHz), 2 mm (126–173 GHz), and 1.3 mm (200–276 GHz).
No detection of CH3CSNH2 was reported and upper limits were given on the abundance of CH3CSNH2 toward these sources. And while several smaller sulfur bearing species have been detected toward these regions, no larger S-bearing molecules have been detected and there has also not been a detection of CH3CONH2 – the O-analog of CH3CSNH2 toward these sources either.
In order to conduct a broader radio astronomical search for CH3CSNH2, additional spectroscopic data (both from the laboratory and space) from a wider range of sources are necessary. As such, we present here a new study investigating the rotational spectrum of CH3CSNH2 using laboratory measurements from 150 to 650 GHz. These measurements were done at room temperature which enabled a global analysis of both the ground and the first torsional excited states. This new study has permitted, for the first time, an accurate prediction in the millimeter- and submillimeter wave ranges necessary for a more extensive astronomical search. In addition, the existing lower frequency data were used to search for transitions at cm wavelengths that may potentially show maser activity. In Sect. 2 we describe the experimental details of the study and the full analysis of the spectrum; in Sect. 3 we describe the astronomical search for this species specifically toward regions with previous detections of CH3CONH2 as well as other sources obtained from archival data from various astronomical facilities; in Sect. 4 we discuss the implication of the investigation in the context of the current presumed formation pathways of CH3CONH2 in the ISM and a comparison of the abundances found between the S- and O-substituted species already detected toward various astronomical environments and finally, in Sect. 5 we provide a summary and possible future observational work needed to better elucidate the formation of large S-bearing species in the ISM.
Current list of known ISM/CSE S-bearing species.
2 Spectroscopic study
2.1 Experimental details
The sample of CH3CSNH2 was purchased from Aldrich and used without purification. The absorption measurements of the rotational spectrum between 150 and 650 GHz were conducted using the fast-scanning Terahertz spectrometer in Lille. The details of the spectrometer are described in Zakharenko et al. (2015).
The radiation source present in the spectrometer is a commercially available Virginia Diodes (VDI) frequency multiplication chain driven by an in-house fabricated fast sweep frequency synthesizer. The fast sweep system is based on the up-conversion of an AD9915 direct digital synthesizer (DDS) operating between 320 and 420 MHz into the Ku band (12.5–18.25 GHz) by mixing the signals from the AD9915 and an Agilent E8257 synthesizer with subsequent sideband filtering. The DDS provides rapid frequency scanning with up to 50 ms per point frequency switching rate. In order to obtain an optimum signal-to-noise ratio, the spectrum was scanned with a slower rate of 1 ms per point and with 4 scans co-averaged. The sample pressure during measurements was ~ 15 Pa at room temperature. Absorption signals were detected by an InSb liquid He-cooled bolometer (QMC Instruments Ltd.). Estimated uncertainties for the measured line frequencies are 30 kHz.
2.2 Analysis of the spectra
Thioacetamide is an asymmetric near-prolate rotor (κ ≈ −0.48). It has nonzero dipole components along the a- (μa = 4.1 D) and b-axes (μb = −1.1 D) as determined by Soundararajan (1957). The molecule is challenging from the spectroscopic point of view as it exhibits large amplitude methyl torsional motion. The interaction between internal rotation of the methyl group and overall rotation of the molecule complicates the spectral analysis. For CH3CSNH2, the barrier to internal rotation is low (V3 ≈ 110 cm−1), and leads to relatively large torsional A − E splittings of the rotational energy levels. The low-lying excited torsional states add more complexity through Coriolis-type interactions with the ground state as well as with each other. As a result, a correct interpretation of the ground state rotational spectrum of CH3CSNH2 within a large range of J and Ka quantum numbers requires a global analysis including excited torsional states.
In the present study, we used the theoretical model base of the rho-axis method (RAM) (Kirtman 1962; Lees & Baker 1968; Herbst et al. 1984). The main advantage of the RAM Hamiltonian is its general approach that simultaneously takes into account the A- and E-symmetry species and all torsional levels, intrinsically taking the inter-torsional interactions into account within the rotation-torsion manifold of energy levels. This method is particularly suitable for a difficult case of low barrier to internal rotation (Ilyushin et al. 2004; Neill et al. 2012) or when large coupling between internal and overall rotation occurs (Smirnov et al. 2014), or both. Because this method has been presented in great detail in the literature (Hougen et al. 1994; Kleiner 2010), we do not describe it here. The RAM used for the spectral analysis in this present study has been previously shown to be very effective for a number of molecules that contain an internal methyl rotor (Ilyushin et al. 2010, 2013; Smirnov et al. 2014). In particular, it has been used for the oxygen-bearing analog of CH3CSNH2, CH3CONH2 (Ilyushin et al. 2004) which has a lower barrier to internal rotation than CH3CSNH2 (V3≈ 25 cm−1). For the analysis, we employed the RAM36 (rho-axis-method for 3- and 6-fold barriers) code that uses the RAM approach for molecules with a C3v top attached to a Cs or C2v symmetry molecular frame and having 3- or 6-fold barriers to internal rotation, respectively. A general expression for the RAM Hamiltonian implemented in this code, as well as further details of the theoretical approach, is found in Ilyushin et al. (2010) and Ilyushin & Hougen (2013). The code RAM36 used for this analysis is publicly available2, and has been successfully utilized in the spectral analysis of many molecules (Ilyushin et al. 2010, 2013; Smirnov et al. 2014), including the recent analysis of the sulfur-containing molecule CH3CHS (Margulès et al. 2020a).
To begin, we refit the data from the previous study (Maris et al. 2019) using the RAM36 program. Using predictions obtained from the initial RAM36 fit, we assigned and fit the a R transitions in the usual manner, with numerous cycles of refinement of the parameter set while new data were gradually added. However, it was not possible to observe the hyperfine splittings due to our Doppler-limited resolution.
Next, we searched for the bR and bQ lines. However, these transitions could not be assigned unambiguously due to the dense spectra and their much smaller relative intensities. Also, several high Ka series of the ground torsional state transitions were perturbed by the interactions with the first excited torsional state; therefore it was necessary to get more precise information about the positions of energy levels of this state. The band origins of the first torsional states are νA = 61.6589 cm−1, νE = 51.3985 cm−1, giving relative intensities to ground state at room temperature of 0.74 and 0.78, respectively. The analysis of the first torsional state also stabilized the fit and reduced the correlation between torsional parameters of the RAM Hamiltonian models.
Finally, we assigned 1428 transitions from the vt = 0 state with the maximum values J = 47 and Ka = 20 in the range up to 330 GHz,and J = 95 and Ka = 20 in the range 400–660 GHz. We also assigned 321transitions from the vt = 1 state with the maximum values J = 35 and Ka = 9 up to 330 GHz. The final data set contains both the data from the previous study (Maris et al. 2019), and new assignments in the millimeter- and submillimeter wave ranges. The total of 2035 lines for vt = 0 and vt = 1 states of A and E symmetries were fitted with root-mean-square deviation of 43.4 kHz (wrms = 0.90). The final fit is based on the RAM Hamiltonian model that includes 40 parameters. The values of the molecular parameters obtained from the final fits are presented in Table 2, where they are compared with the parameters from the initial fit of the data from the previous study (Maris et al. 2019). The new combination of data from the vt = 0 and vt = 1 states required 23 more parameters that also improved the overall quality of the fit. In particular, the inclusion of the vt = 1 state permitted the removal of the strong correlation between F and ρ parameters of the Hamiltonian, and to accurately determine the V6 parameter.
Spectral predictions for astronomical use were calculated using the set of RAM Hamiltonian parameters presented in last column of Table 2. The predictions include the rotational transitions of the ground and first excited torsional states of CH3CSNH2 calculated at 300 K for J values up to 95 and in the frequency range up to 400 GHz. In addition, we provided the tabulated values for the partition function in Table 3, with Qtot (T) = Qvib(T) × Qtr(T). The torsion-rotational partition function Qtr(T) was calculated from first principles, that is, via direct summation over the rotational-torsional states. In the presence of low-energy vibrationally excited states, the vibrational part of the partition function should be also taken into account to derive column densities. The vibrational partition function was calculated with respect to the zero-point energy level using the following expression:
 (1)
(1)
The normal modes were obtained from the harmonic force field ab initio calculation at the B3LYP/6-311G++(3dp, 2pd) level of theory and basis set using Gaussian 09 (Frisch et al. 2016a). The harmonic frequencies are given in Table 4. Only the seven lowest vibrational excited state levels were considered (mode 2–8 in the Table 4). The contribution of the torsional mode is included in Qtr (T) and thus, it is not considered for Qvib. The remaining modes above 1000 cm−1 were found to have no influence on the partition function calculations for the temperatures up to 300 K. The results of the fit, as well as the predictions, are available in the Supplementary Material associated with this article.
Molecular parameters in cm−1 of CH3CSNH2 obtained with the RAM36 program.
3 Expanded astronomical searches
In the initial analysis characterizing the spectroscopy of CH3CSNH2, two astronomical sources were selected from the ASAI survey to search for transitions of CH3CSNH2 based on the initial fit from that work (Maris et al. 2019). The ASAI survey targets sources associated with Solar-type star forming regions over a wide range of evolutionary states, temperatures, densities and kinematics providing a diverse sample of sources to investigate (Lefloch et al. 2018). The protostellar core L1544 and the shocked region L1157-B1 associated with the chemically rich outflow L1157 were the two sources that were selected. Both regions are spatially extended (with respect to the IRAM 30 m beam). No transitions of CH3CSNH2 were detected above the 3σ noise level of those observations. That study assumed a dipole moment of ~ 4 D in order to calculate the upper limit to the column density of CH3CSNH2 toward these sources. For both sources, the upper limit to the beam averaged column density was < 1012 cm−2. With the improved spectroscopic observations of this study and the inclusion of the vibrational part of the partition function, it is now possible to perform a more extensive search for CH3CSNH2 and to provide a more robust constraint on column densities.
3.1 Search for CH3CSNH2 toward Sgr B2(N2) with ALMA
We searched for CH3CSNH2 toward the hot molecular core Sgr B2(N2). This source belongs to the protocluster Sgr B2(N) that contains several hot cores and (ultracompact) HII regions (for example, Bonfand et al. 2017; Gaume et al. 1995), as well as a large number of compact continuum sources detected with the Atacama Large Millimeter/submillimeter Array (ALMA) that are characterized by densities above 108 cm−3 and were interpreted as being high mass young stellar objects (Sánchez-Monge et al. 2017; Ginsburg et al. 2018). Sgr B2(N) has often been targeted over the past five decades to search for complex organic molecules thanks to the high column densities of its hot cores that facilitate the detection of these molecules.
We used the data from the Exploring molecular complexity with ALMA (EMoCA) imaging spectral line survey performed with ALMA in Cycles 0 and 1 to search for CH3CSNH2 toward Sgr B2(N2). Details about the observations and data reduction of this survey can be found in Belloche et al. (2016). In short, the survey covers the frequency range from 84.1 to 114.4 GHz with a spectral resolution of 488 kHz that corresponds to 1.7–1.3 km s-1 in velocity space. The median angular resolution of the survey is 1.6′′ which corresponds to ~13 000 au at a distance of 8.15 kpc (Reid et al. 2019). The phase center of the interferometric observations was located at (α, δ)J2000 = (17h47m19.s87, − 28°22′16.′′0). The spectrum that is analyzed here corresponds to the peak position of Sgr B2(N2) located at (α, δ)J2000 = (17h47m19.s86, − 28°22′13.′′4).
We used the software WEEDS (Maret et al. 2011) to model the observed spectrum under the assumption of local thermodynamic equilibrium (LTE) and to produce a synthetic spectrum. This assumption is justified by the high densities that characterize the region where the hot core emission is detected (> 1 × 107 cm-3, see Bonfand et al. 2019). As described in Belloche et al. (2016), we modeled the emission of each molecule separately and then added their contributions together. We modeled the spectrum of each species with five parameters: size of the emitting region, column density, temperature, line width, and velocity offset with respect to the assumed systemic velocity of the source (74 km s−1).
We did not detect emission from CH3CSNH2 toward Sgr B2(N2) with the EMoCA survey. In order to derive an upper limit to its column density, we assumed that its emission should trace a similar region as CH3CONH2 and we fixed the size of the emitting region, temperature, line width, and velocity offset to the values derived for CH3CONH2 in Sgr B2(N2) by Belloche et al. (2017). The only free parameter was then the column density of CH3CSNH2. Figure 1 shows the synthetic spectrum of CH3CSNH2 that we usedto derive the upper limit to its column density. This upper limit is reported in Table 5, along with the parameters derived earlier for CH3CONH2, methanol (CH3OH), and methyl mercaptan (CH3SH) by Belloche et al. (2017) and Müller et al. (2016) from the EMoCA survey.
Table 5 indicates that CH3CSNH2 is at least ~9 times less abundant than CH3CONH2 in Sgr B2(N2). For comparison, CH3SH is ~ 120 times less abundant than CH3OH in this source. If these two pairs of molecules have similar abundance ratios, then the emission lines of CH3CSNH2 may be one order of magnitude weaker than the upper limits we obtained with the EMoCA survey, and thus most likely well below the spectral confusion limit toward this source in this frequency range.
Rotational, vibrational, and total partition functions of CH3CSNH2 at various temperatures.
Harmonic vibrational frequencies up to 1000 cm−1 of CH3CSNH2 determined at the B3LYP/6-311++G(3df,2pd) level of theory and basis set.
3.2 Search for CH3CSNH2 toward Sgr B2(N) with the GBT
The PRebiotic Interstellar Molecule Survey (PRIMOS)3 was a key science program that started in 2008 January and concluded in 2011 July taken with the Robert C. Byrd Green Bank Telescope (GBT) currently managed by the Green Bank Observatory (GBO). The PRIMOS project covers nearly all observable frequencies available to ground based instrumentation from ~ 300 MHz to 48 GHz at high sensitivity (~3−9 mK rms) and spectral resolution (24.4 kHz). The pointing position for these observations were centered on the Sgr B2(N) Large Molecule Heimat (LMH) at (α, δ)J2000 = (17h47m19.s8, − 28°22′17.′′0), nearly identical to the pointing position of the EMoCA survey (see Sect. 3.1).
The systemic velocities found for CH3CONH2 in the original detection paper (Hollis et al. 2006a) are +64, +73 and +82 km s−1. In general, there is much less contribution from the + 73 km s−1 component compared to + 64 km s−1 and + 82 km s−1 in the GBT observations. However, the ALMA observations are also sensitive to the compact emission regions of molecular gas (the resolution and associated source sizes from the EMoCA survey are ~ 1.6′′ whereas the GBT observations are sensitive to a range of resolutions and source sizes, dependent on observing frequency, from ~ 15′′ to ~ 80′′). As such, from these two complementary data sets, it is possible to investigate the hot compact regions as well as the colder more extended molecular gas in searching for transitions of CH3CSNH2 toward the Sgr B2(N) region. Intensities are presented on the  scale (Ulich & Haas 1976).
The detection of large molecules with the PRIMOS data set for the last 15 yr has come as a surprise as previously, the prevailing theories for the formation of large molecules was believed to be driven primarily by grain surface chemistry during a warm-up phase during the process of star formation (Garrod et al. 2008). As such, the regions surrounding hot molecular cores would be ideal for these discoveries (see Sect. 3.1). Yet the PRIMOS observations have shown that there is a large diversity of complex molecules in the clouds surrounding the Sgr B2(N) region and not specifically centered on the hot core regions. In addition, PRIMOS observations have also shown a rich and complex molecular diversity among the spiral arms clouds in the intervening gas (Corby et al. 2018) toward the Galactic Center. These observations together indicate that gas phase chemistry may drive the formation of molecules that cannot happen on grain surfaces (Neill et al. 2012). Even more interesting was the conclusion that most transitions of these larger molecules (for example, CH3OCHO and CH2NH) with energy levels below 30 GHz are astronomical masers (Faure et al. 2014, 2018) leading to the detection of new molecules which would have otherwise eluded detection (McGuire et al. 2012).
Since the initial observations from the first detection of CH3CONH2 (Hollis et al. 2006a), additional transitions have been observed with the GBT as part of the PRIMOS survey. Also, the initial detection did not include any of the hyperfine structure (HFS) in the modeling of the spectral line profiles from PRIMOS nor in the determination of the total column density. In this work, spectral line profiles of the low frequency transitions were modeled for all the A-state transitions below 48 GHz. In addition, transitions below 18 GHz were modeled using the measured HFS (F. J. Lovas, priv. comm.). Above 18 GHz, the HFS is no longer resolved at the resolution of our astronomical observations. We used the software MOLSIM (Lee et al. 2021) to perform the modeling and to estimate the upper limit for the spectral analysis of the PRIMOS and ASAI surveys. Synthetic spectra are produced with a single excitation temperature assumption, that all transitions are thermalized, and corrected for optical depth as discussed in Turner (1991) and Mangum & Shirley (2015).
Acetamide (CH3CONH2) is an oblate, asymmetric top molecule (Kc is a good quantum number) with an internal methyl rotor (Yamaguchi et al. 2002). The dipole moments of CH3CONH2 are μa = 1.14 D and μb = 3.5 D (Hollis et al. 2006a). As such, b-type transitions would be inherently stronger than a-type transitions. Several attributes of the detected transitions in PRIMOS were immediately found. First, as expected, only b-type transitions were detected. Second, only ΔJ = 0, Q-branch transitions were detected with ΔKa = 1 and ΔKc = −1 for the A-symmetry states (hereafter, the convention b Q1,−1 will be used to describe the types of transitions). Figure 2 shows all the Q-branch, A-symmetry state, b-type transitions observed in the PRIMOS survey. The lowest frequency transition detected near 6358 MHz (Fig. 2a) shows resolved HFS, multiple velocity components at +62, +71 and + 81 km s−1 and maser activity. The model fit (green trace) cannot reproduce the measured emission features detected from this transition. In contrast, nearly all other transitions detected are well characterized by the LTE model – even the weaker features. The transition near 9253 MHz (Fig. 2b) has a slightly stronger + 62km s−1 absorption component than predicted by the model. This can be explained by possible contamination from other spectral features near those frequencies in either absorption or emission or from other sources contained within the GBT beam at these frequencies such as Sgr B2(M). For example, the H(113)ϵ recombination spectral line profile is clearly impacted by absorption due to the acetamide transition near 21 362 MHz (Fig. 2g). What also differs from the initial detection paper by Hollis et al. (2006a) is that the best fit velocity components of CH3CONH2 occur at +62, +71 and + 81 km s−1 and not at the notional +64, +73 and + 82 km s−1 identified in other species – suggesting a spatial differentiation of acetamide from other species such as formamide, glycolaldehyde, propynal and cyclopropenone (Hollis et al. 2004b,a, 2006b; Belloche et al. 2013). Table 6 presents the spectroscopic parameters for the CH3CONH2 transitions detected in this work including the HFS for frequencies below 18 GHz (where resolved) for the A-symmetry states and Fig. 3 shows the 6358 MHz transition illustrating all the HFS and velocity components.
The situation is not as clear for the E-symmetry state transitions. Figure 4 shows the detection of ten E-state transitions. Unlike the A-state transitions, given the difficulty in fitting the E-state, there is no corresponding HFS data available. Inaddition, the astronomically detected E-state transitions in the low frequency data are not limited to just b Q1,−1 type transitions. For example, the feature detected at 26 196 MHz (Fig. 4j) is a a Q0,−1 transition; the features detected at 9050 (Fig. 4a) and 14652 MHz (Fig. 4c) are a P0,1 transitions; finally the feature detected at 13 388 MHz (Fig. 4b) is a a Q0,1 transition that appears to be a weak maser transition. Nonetheless, the best fit parameters found for the E-state transition are constrained to be similar to that for the A-states; that is the model (green trace) fits the data very well for an excitation temperature similar to what was determined for the A-state but with a factor of ~2 times highercolumn density for those features found in absorption and not contaminated by other spectral features. Similar to the detected A-state transitions, several E-state transitions are contaminated by features from H-recombination lines (H(104)δ at 22 095 MHz, H(106)δ at 20 891 MHz, and H(85)β at 20 686 MHz) or possibly other unidentified transitions. We note that the 15 115 MHz CH3CONH2 transition (Fig. 4e) only shows emission near the 71 km s−1 velocity component and no other features at 62 or 81 km s−1 suggesting that this feature is also a maser transition or possibly contaminated by another species. The largest discrepancy between the data and the fit is around 14 960 MHz. With no other transitions in the passband to interfere with the detection, this feature is markedly absent in the astronomical data compared to the other detected transitions. This transition is a a Q0,−1 similar to the transitions shown in Figs. 4e, g and j. Looking at the energy levels of the transitions in these figures, it appears that for transitions with upper state energies less than 10 K, features are detected in absorption (Figs. 4g and j). At 15 K, the feature of this transition type is in emission (Fig. 4e). And, at ~11 K, features from this transition type are absent (Fig. 4d). It is possible that features from these types of transitions pass from emission (when Eu ~ 15K) to absorption (when Eu ~ 9.87 and 9.0 K) passing through an upper state energy around 11 K. This could account for the transition being absent compared to the model data. The transition is also unique in that it is a J − Ka = 2 transition for both the upper and lower states. None of the other astronomically detected transitions are of this type. Table 6 presents the spectroscopic data for the E-state CH3CONH2 transitions detected in the PRIMOS observations.
In total, the best fit model to the PRIMOS data was found for an excitation temperature of 5.8 K and a source size of 20′′ for both the A- and E-state transitions, and the total measured CH3CONH2 column density determined from the PRIMOS data from the current analysis, is ~ 7.7 × 1013 cm−2 for the A-state transitions and ~1.5 × 1014 cm−2 for the E-state transitions. These values are on the same order of magnitude with both the ~ 8 × 1013 cm−2 column density determined by Hollis et al. (2006a) at an excitation temperature of 5 K and the ~ 5 × 1013 cm−2 determined by Halfen et al. (2011) at an excitation temperature of 17 K for transitions detected with upper state energy levels lower than 40 K. And, as expected, the observed temperature and measured column densities from this current work are much lower than what was reported by Belloche et al. (2017) toward SgrB2(N2) from the EMoCA survey where CH3CONH2 was detected at a column density of ~2 × 1017 cm−2 at an excitation temperature of 180 K (see Table 5) – clearly emission coming from a hot core region which is beam diluted in our GBT observations. What this analysis also indicates, given the structural similarity of CH3CONH2 and CH3CSNH2, are the types of transitions that are most likely to be detected at lower frequencies with single dish instruments such as the GBT.
Figure 5 shows the results of our attempt to detect the strongest transitions, including possible maser transitions, from CH3CSNH2 between 8 and 24 GHz from the PRIMOS survey. Since the fit to CH3CSNH2 was done utilizing the rho-axis method (see Sect. 2.2), A- and E-symmetry state transitions from CH3CSNH2 were both initially searched for, though due to the limited Doppler resolution used in the spectrometer, it was not possible to search for any HFS. Also, given μa = 4.1 D for CH3CSNH2, the strongest transitions should be a-type transitions (μb = −1.1 D). Finally, the lowest energy state transitions could also be possible maser transitions. And, for completeness, we searched for all A- and E-symmetry state, P- and Q-branch, a- and b-type transitions over the entire PRIMOS observing range.
As was done when first characterizing the astronomical spectra of CH3CONH2, we used an LTE-model4 assuming a non-thermal background source of emission (Hollis et al. 2007; McGuire et al. 2016) and simulated the spectrum of CH3CSNH2 assuming a temperature of 5.8 K, a source size of ~ 20′′ and a line width of 20 km s−1. However, as Fig. 5 illustrates, similar to what was found in the EMoCA survey, no CH3CSNH2 transitions (in red) were detected – although there is a nearly frequency coincident absorption feature close to the 1(0,1)–0(0,0) E transition at 8189.41 MHz. The lack of exact frequency coincidence and of any additional transitions detected however, makes this feature very unlikely to be due to CH3CSNH2. To set an upper limit of CH3CSNH2, a rotational temperature of 5.8 K was used and based on the lowest noise level from the CH3CSNH2 passbands, an upper limit of 2.2 × 1013 cm−2 was found – again indicating that CH3CSNH2 is at least an order of magnitude less abundant than CH3CONH2 in the low temperature, extended regions around Sgr B2(N).
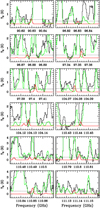 |
Fig. 1 Synthetic LTE spectrum of CH3CSNH2 (in red) used to derive the upper limit to its column density, overlaid on the ALMA spectrum of Sgr B2(N2) (in black) and the synthetic spectrum that contains the contributions of all the species (but not CH3CSNH2) that we have identified so far in this source (in green). The dotted line in each panel indicates the 3σ noise level. The transitions of CH3CSNH2 that have a modeled peak temperature lower than 3σ and the ones that are heavily contaminated by other species are not shown. |
Parameters of our best-fit LTE model of methanol, methyl mercaptan, and acetamide, and column density upper limit for thioacetamide, toward Sgr B2(N2).
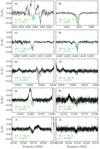 |
Fig. 2 Synthetic LTE spectrum of CH3CONH2 (in green) A-symmetry state transitions generated from the physical conditions and observing parameters described in Sect. 3.2 (Tex = 5.8 K, source size of 20′′, three velocity components at +62, +71 and + 81 km s−1 yielding an NT ~ 7.7 × 1013 cm−2 from all three components) overlaid on the GBT spectrum of Sgr B2(LMH) (in black). Transition quantum numbers and upper state energy levels (Table 6) are in the bottom left corner of each spectrum. Quantum numbers with an “⋆” have HFS included in the synthetic spectrum. |
Spectroscopic properties of CH3CONH2 lines detected in PRIMOS toward Sgr B2(LMH).
3.3 Search for CH3CSNH2 toward NGC 6334I with ALMA
To date, there are only 3 sources with confirmed detections of CH3CONH2. These include the already discussed, Sgr B2(N) region, the high mass star forming regions NGC 6334I (Ligterink et al. 2020) and G31.41+0.31 (Colzi et al. 2021). NGC 6334I, at a distance of 1.3 kpc (Reid et al. 2014), is a massive protocluster (Hunter et al. 2006) undergoing active star formation. Toward this source, two distinct regions exhibit spectra typical to hot core regions, designated MM1 and MM2 (Zernickel et al. 2012; Brogan et al. 2016). This source was the site of the first interstellar detections of methoxymethanol (CH3OCH2OH) (McGuire et al. 2017) and the first two vibrationally excited torsional states of acetic acid (CH3COOH) (Xue et al. 2019) and has been the target of several investigations of complex molecules (El-Abd et al. 2019; Melosso et al. 2020).
ALMA observations of NGC 6334I at an angular resolution of 0.26′′ in ALMA Bands 4 and 7 were used to search for transitions of CH3CSNH2 toward this source. The details of the individual data sets and their reductions are available in Hunter et al. (2017) and McGuire et al. (2017, 2018).
Figure 6 shows the results of our attempt to detect the strongest transitions from CH3CSNH2 in ALMA Bands 4 and 7 and, in the data presented, only the most prominent transitions are shown (Table 7). As with the data shown toward Sgr B2(N) with the EMoCA and PRIMOS programs, there is no evidence supporting its presence toward NGC 6334I. Similar to Fig. 1, the dotted lines represent 3σ rms values and the synthetic LTE spectrum (red trace) is overlaid on the ALMA spectrum (black trace). Assuming Tex to be 135 K, typical of other large molecules toward this source and the best fit temperature determined from the detection of CH3CONH2 in Ligterink et al. (2020), the upper limit of NT of CH3CSNH2 is 2 × 1015 cm−2. Given the measured CH3CONH2 column density of 4.7 × 1016 cm−2, the upper limit of the CH3CSNH2/CH3CONH2 abundance ratio is 0.04 - which is about a factor of 3 smaller than what was found toward Sgr B2(N2) in a similar frequency range from the EMoCA survey (see Sect. 3.1).
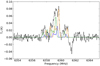 |
Fig. 3 Illustrative spectrum of CH3CONH2 showing therelative intensities of all the HFS (Table 6) and multiple velocity components at +62 (in yellow), +71 (in blue) and + 81 km s−1 (in green) overlaid on the GBT spectrum of Sgr B2(LMH) (in black). The intensity of these emission features cannot be matched by the synthetic LTE model in this work. |
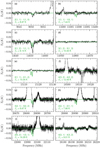 |
Fig. 4 Synthetic LTE spectrum of CH3CONH2 (in green) E-symmetry state transitions generated from the physical conditions and observing parameters described in Sect. 3.2 (Tex = 5.8 K, source size of 20′′, three velocity components at +62, +71 and + 81 km s−1 yielding an NT ~ 1.5 × 1014 cm−2 from all 3 components) overlaid on the GBT spectrum of Sgr B2(LMH) shown in black. Transition quantum numbers and upper state energy levels (Table 6) are in the bottom left corner of each spectrum. |
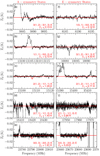 |
Fig. 5 Synthetic LTE spectrum of CH3CSNH2 (in red). The A-symmetry state transitions are presented in the first column in panels a–e and the E-symmetry state transitions are presented in the second column in panels f–j. The spectrum was generated from the physical conditions and observing parameters described in Sect. 3.2 (that is, Tex = 5.8, source size of 20′′, NT ~ 2.2 × 1013 cm−2) overlaid onthe GBT spectrum of Sgr B2(LMH) shown in black. Transition quantum numbers and upper state energy levels (Table 7) are at the bottom of each spectrum. No significant emission from CH3CSNH2 transitions are detected beyond the 3σ upper limit. |
3.4 Cursory search for CH3CSNH2 in the ASAIsources with the IRAM 30 m
In order to complete the investigation that initially started with the search for CH3CSNH2 toward L1544 and L1157-B from the ASAI survey, the remaining targets from the ASAI survey were searched for the strongest transitions of CH3CSNH2 and CH3CONH2. All the objects represent different evolutionary stages to forming a Sun-like star – starless cores to Class 0/I sources (such as Barnard 1, NGC 1333-IRAS 4A, L1157mm, L1527, and SVS13-A) as well as jet-driven shocked regions (such as L1448R2). The observational details of the ASAI survey and the sources therein are fully described in Lefloch et al. (2018). Here we present only the parameters that were used to derive the column densities or the upper limits of both species toward these sources.
As with the searches already presented toward Sgr B2 and NGC 6334I, we find no evidence of CH3CSNH2 in any of the ASAI sources. In addition, and quite unfortunate, we also find no evidence for CH3CONH2 toward any of the ASAI sources either (see Figs. 7 and 8). As such, meaningful column density ratios cannot be determined as only upper limits to the column densities of CH3CSNH2 and CH3CONH2 can be determined.
Similar to the analysis performed toward Sgr B2(N) and NGC 6334I, a synthetic spectrum of each molecule was generated using the physical conditions for the source (Table 8) and the spectroscopic line parameters measured in this work. Then, following the methodology that was used to find the upper limits to HCCCHS and HCCCHO (Margulès et al. 2020b), the 3σ upper limit to the column density was derived, using the line that gave the most rigorous constraint (that is the line that would be the highest signal-to-noise in the event of a detection). These lines are provided in Table 9 along with the resulting upper limits.
Spectroscopic properties of the CH3CSNH2 lines shown toward the Sgr B2 and NGC 6334I regions.
4 Discussion
The question that remains is whether the detection (or non-detections) of these larger molecules better calibrate existing chemical formation theories. Earlier work suggested that the formation of NH2CHO (and possibly CH3CONH2) can form in the gas phase via NH2 + H2CO → NH2CHO + H (Barone et al. 2015; Skouteris et al. 2017). An analogous reaction with CH3CHO, that is, NH2 + CH3CHO, can lead to CH3CONH2 + H in competition with another channel leading to NH2CHO + CH3. However, a kinetic study has shown that NH2 + CH3CHO has an activation energy barrier (Hack et al. 1986). Following these examples, the reactions NH2 + H2CS and NH2 + CH3CHS may lead to the formation ofNH2CHS and CH3CSNH2, respectively.Of course, dedicated work is necessary to confirm this suggestion.
A more recent study was done to try and determine the most probable formation route to form CH3CONH2 under interstellar conditions. Foo et al. (2018) investigated every possible structural isomer of CH3CONH2 and as CH3CONH2 was found to be the most stable isomer, they selected the 4 most stable bimolecular species (and associated reaction pathways) as possible molecular precursors to form CH3CONH2 (as well as other possible unimolecular formation schemes whereby CH3CONH2 could form by the rearrangement of atoms from a molecular isomer – such as CH3NHCHO). In that work, it was shown that the most probable reaction pathways to forming CH3CONH2 would be the following gas phase reactions:

Of these reactions, only (3) and (5) could be feasible and the formation route via H2O + CH3CN requires a 2-step process to form CH3CONH2 through the isomerization of CH3NHCHO. However, both have to travel through large transition state barriers which make these routes highly improbable except in regions that can clearly drive nonthermal excitation – such as shocked regions. For example, the formation (and detection) of methyl isocyanide (CH3NC) and carbodiimide (HNCNH) is explained by the nonthermal processes from the isomerization of methyl cyanide (CH3CN) and cyanamide (NH2CN), respectively (Remijan et al. 2005; McGuire et al. 2012). As such, the final formation of CH3CONH2 could be through the isomerization of CH3NHCHO.
As always, additional possibilities exist to form molecules on grain surfaces. In recent experiments by Ligterink et al. (2018), a CH4:HNCO ice mixture at 30 K was irradiated by far UV photons to investigate the potential products generated. The precursors used in these reactions are the same chemical precursors as in reaction (2) only now these species are contained in an ice matrix instead of in the gas phase. The main conclusion was that the formation of amides can be explained by nonenergetic radical recombination reactions with NH2. For example, the formation of formamide (NH2CHO) on a grain surface takes place by:
 (6)
(6)
while acetamide is formed by:

The experiments successfully reproduced the abundance ratios of CH3CONH2/NH2CHO measured in the ISM. The experimental value determined is 0.4 and while the observed values vary toward different sources, all measured values fall within a range of 0.04–1.6 (for example, Hollis et al. 2006a; Belloche et al. 2017, 2019; Halfen et al. 2011 and this work). The conclusion reached based on these experiments was that specifically toward hot cores, the abundance of CH3CONH2 can be explained by a formation on interstellar grains with subsequent desorption from grain surfaces. Yet, gas phase reactions under some interstellar conditions cannot be ruled out. By observing less abundant species with similar molecular structure, it may be possible to better determine the formation pathways – or at least which pathway is more dominant or prevalent.
Acetamide (CH3CONH2) and other oxygen-bearing amide molecules are shown to efficiently form on grain surfaces involving radicals. The reactant radicals as listed in reactions (6)–(8) form through the photodissociation of methanol and ammonia on grain surfaces. Given the presumed reactions (either in the gas phase or grain surface) for the formation of CH3CONH2, it may be possible to obtain additional insight into the chemical kinetics by looking for similar reactions to form CH3CSNH2. Yet, the overall excitation and distribution of S-bearing molecules are quite different from their O-bearing counterparts. Gas-grain models specifically do not take into account surface reactions from many small S-bearing species as the behavior of sulfur on grain surfaces is less well understood. Furthermore, the energetics of the S-substituted species will be different from their O-bearing counterparts making the chemical kinetics that is driving their formation much different given a similar looking reaction.
Considering that a majority of large sulfur-bearing molecules have been detected toward cold regions such as dark clouds (for example, Cernicharo et al. 2021, and references therein), the possible gas-phase formation pathways to forming CH3CONH2 may help to guide our understanding on the formation mechanism of its sulfur-substitute amide, CH3CSNH2. Therefore, we propose analogous neutral-neutral reactions to that of CH3CONH2:

Of the precursor species in these reactions, all have been detected in the gas phase toward a diverse sample of astronomical objects. For example, HNCS and CH3NH2 were detected in the outer envelopes and hot cores of Sgr B2(N) (Kaifu et al. 1974; Halfen et al. 2009; Corby et al. 2015); CH3CN is ubiquitous toward numerous sources including hot cores (Gieser et al. 2021, and references therein), translucent clouds (Corby et al. 2015), and dark clouds (Willacy et al. 1993).
Finally, H2CCS has recently been detected toward cold regions (Cernicharo et al. 2021) and CH4, H2S, CS and NH3 are all highly abundant in the gas phase in nearly all regions of molecular gas. As such, the proposed gas-phase formation routes to CH3CSNH2 in reactions (9–12) may be possible if energetically favorable. To test their feasibility, quantum chemical calculations were carried out with the Gaussian 16 suite of programs (Frisch et al. 2016b). All geometries were optimized using Density Functional Theory with the B3LYP method (Stephens et al. 1994) and a 6-311G++(d,p) basis set. The energetics were corrected with free energy corrections at a temperature of 15 K at the same level of theory. Due to the potentially large activation energies of reactions (9) and (11), no transition states or intermediates were found for these reactions as such high energy pathways would be impractical in interstellar conditions. Instead full reaction paths were only calculated for reactions (10) and (12) analogous to the study by Foo et al. (2018). The transition states were confirmed using an internal reaction coordinate analysis, and all stationary points found were further constrained by performing CCSD(T) single point energy calculations with the aug-cc-pVTZ basis set. The Gibbs free energy of reactions (9–12) were found to be −37.52, −27.62, −236.11, and −133.87 kJ mole−1, respectively. Reaction (10) was found to be a two step process with Gibbs free energy of activations of 210.89 kJ mole−1 for the first step and 111.56 kJ mole−1 for the second. Reaction (12) was a single step process with a Gibbs free energy of activation of 170.62 kJ mole−1. Though all proposed reactions are exothermic, the associated energy barriers are rather large for feasible reaction paths in cold interstellar conditions.
Also, the presumed main driver of S-chemistry on grain surfaces, H2S, has yet to be unambigously detected on a grain surface. The grain surface reactions to the formation of larger S-bearing molecules require that a radical containing S (such as, HCS) or neutral species (such as, CS) be available in large abundances on grain surfaces. Since these precursor species have yet to be directly detected on grain surfaces, it is unlikely that analogous routes with S-bearing species in reactions (6)–(8) would lead to the formation of larger S-bearing molecules. In addition, dedicated searches for larger S-bearing molecules have taken place over a variety of sources with several non-detections (for example, CH3CHS; Margulès et al. 2020a, and NH2CHS; Margulès et al. 2020b) and toward locations where comparative O-chemistry may not be present (Cernicharo et al. 2021). As such, it is currently difficult to constrain any of the chemistry with such a disparate set of data, yet trends comparing the relative abundances between the O-bearing vs. S-bearing species have been done toward those sources even if all we have are upper limits to the column densities which may eventually lead to a better determination of the formation pathways of both families of molecules.
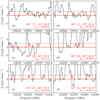 |
Fig. 6 Synthetic LTE spectrum of CH3CSNH2 (in red) used to derive the upper limit to its column density, overlaid on the ALMA spectrum of NGC 6334I (in black). Figure labels are similar to Fig. 1. The transitions of CH3CSNH2 that are weaker than 3σ and the ones that are heavily contaminated by other species are not shown. |
Parameters for each of the ASAI sources used to search for CH3CSNH2 and CH3CONH2.
Upper limits to the abundances of CH3CSNH2 and CH3CONH2 toward the ASAI sources and the spectral line parameters used to calculate the upper limits in each of the sets of observations.
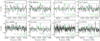 |
Fig. 7 Transitions of CH3CONH2 used to calculate the 3σ upper limits given in Table 9. In each panel, the green trace shows the transition simulated using the derived upper limit column density and the physical parameters assumed for that source. The dotted line in each panel indicates the 3σ noise level. The quantum numbers and upper-level energies for each transition is shown in the lower right of each panel. The source name is given in the upper left of each panel. Due to the large variances between observations, the intensity and velocityaxes are not necessarily uniform between each panel. |
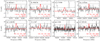 |
Fig. 8 Transitions of CH3CSNH2 used to calculate the upper limits given in Table 9. Panel description is the same as in Fig. 7. |
5 Conclusions
The spectrum of CH3CSNH2 was investigated and new fits were generated using the RAM method to assign the spectrum of CH3CSNH2 from 150 to 650 GHz. A total of 1428 transitions from the vt = 0 state with maximum values J = 47 andKa = 20 in the range to 330 GHz, and J = 95 and Ka = 20 in the range 400–660 GHz were assigned. We also assigned 321 transitions from the vt = 1 state with the maximum values J = 35 and Ka = 9 up to 330 GHz. The final data set contains both the data from the previous study (Maris et al. 2019), and new assignments in the millimeter and submillimeter-wave ranges. The total of 2035 lines for vt = 0 and vt = 1 states of A and E symmetries were fit with root-mean-square deviation of 43.4 kHz. The final fit is based on the RAM Hamiltonian model that includes 40 parameters. An astronomical search for CH3CSNH2 was conducted based on all the new spectroscopic data. No transitions of CH3CSNH2 were detected toward any source. Using the appropriate telescope and physical parameters for each astronomical source, upper limits to the column densities were found for CH3CSNH2 toward each source.
In addition, new transitions of CH3CONH2 were searched for and detected toward Sgr B2(N-LMH) utilizing the GBT PRIMOS data set. In total, the best fit model to the PRIMOS data was found for an excitation temperature of 5.8 K and a source size of 20′′ for both the A- and E-state transitions, and the total measured CH3CONH2 column density determined from the PRIMOS data from the current analysis is ~ 7.7 × 1013 cm−2 for the A-state transitions and ~1.5 × 1014 cm−2 for the E-state transitions. As expected, the observed temperature and measured column densities from this current work are much lower than what was reported by Belloche et al. (2017) toward SgrB2(N2) from the EMoCA survey where CH3CONH2 was detected at a column density of ~2 × 1017 cm−2 and an excitation temperature of 180 K – clearly emission coming from a hot core region which is beam diluted in our GBT observations. What this analysis also indicates, given the structural similarity of CH3CONH2 and CH3CSNH2, are the types of transitions that are most likely to be detected at lower frequencies with single dish facilities such as the GBT. And while no transitions of CH3CSNH2 were detected, the investigation of large S-bearing species compared to their O-bearing counterparts may eventually provide insight into possible formation routes. The gas phase formation routes to form larger S-bearing molecules need further investigation into their energetics. In addition, if grain surface reactions are to be considered as a viable route to the formation of larger S-bearing species, precursors such as H2S and CS need to be first identified within grain mantles.
Acknowledgements
We would like to thank an anonymous referee for their strong support of this work. This paper makes use of the following ALMA data: ADS/JAO.ALMA#2011.0.00017.S, ADS/JAO.ALMA#2012.1.00012.S, ADS/JAO.ALMA#2017.1.00370.S, and ADS/JAO.ALMA#2017.1.00661.S. ALMA is a partnership of ESO (representing its member states), NSF (USA), and NINS (Japan), together with NRC (Canada), NSC and ASIAA (Taiwan), and KASI (Republic of Korea), in cooperation with the Republic of Chile. The Joint ALMA Observatory is operated by ESO, AUI/NRAO, and NAOJ. The National Radio Astronomy Observatory is a facility of the National Science Foundation operated under cooperative agreement by Associated Universities, Inc. The interferometric data are available in the ALMA archive at https://almascience.eso.org/aq/. This paper makes use of the PRIMOS data under GBT Archive Project Code AGBT07A-051. The Green Bank Observatory is a facility of the National Science Foundation operated under cooperative agreement by Associated Universities, Inc. This work is based on observations carried out as part of the Large Program ASAI under project number 012-12 with the IRAM 30 m telescope. IRAM is supported by INSU/CNRS (France), MPG (Germany) and IGN (Spain). C.X. is a Grote Reber Fellow, and acknowledges support from the National Science Foundation through the Grote Reber Fellowship Program administered by Associated Universities, Inc./National Radio Astronomy Observatory and the VirginiaSpace Grant Consortium. Part of this work has been carried out within the Collaborative Research Centre 956, sub-project B3, funded by the Deutsche Forschungsgemeinschaft (DFG) – project ID 184018867.
References
- Barone, V., Latouche, C., Skouteris, D., et al. 2015, MNRAS, 453, L31 [Google Scholar]
- Belloche, A., Müller, H. S. P., Menten, K. M., Schilke, P., & Comito, C. 2013, A&A, 559, A47 [NASA ADS] [CrossRef] [EDP Sciences] [Google Scholar]
- Belloche, A., Müller, H. S. P., Garrod, R. T., & Menten, K. M. 2016, A&A, 587, A91 [NASA ADS] [CrossRef] [EDP Sciences] [Google Scholar]
- Belloche, A., Meshcheryakov, A. A., Garrod, R. T., et al. 2017, A&A, 601, A49 [NASA ADS] [CrossRef] [EDP Sciences] [Google Scholar]
- Belloche, A., Garrod, R. T., Müller, H. S. P., et al. 2019, A&A, 628, A10 [NASA ADS] [CrossRef] [EDP Sciences] [Google Scholar]
- Belyaev, D. A., Montmessin, F., Bertaux, J.-L., et al. 2012, Icarus, 217, 740 [CrossRef] [Google Scholar]
- Biver, N., Bockelée-Morvan, D., Crovisier, J., et al. 1999, AJ, 118, 1850 [NASA ADS] [CrossRef] [Google Scholar]
- Bonfand, M., Belloche, A., Menten, K. M., Garrod, R. T., & Müller, H. S. P. 2017, A&A, 604, A60 [NASA ADS] [CrossRef] [EDP Sciences] [Google Scholar]
- Bonfand, M., Belloche, A., Garrod, R. T., et al. 2019, A&A, 628, A27 [NASA ADS] [CrossRef] [EDP Sciences] [Google Scholar]
- Brogan, C. L., Hunter, T. R., Cyganowski, C. J., et al. 2016, ApJ, 832, 187 [Google Scholar]
- Cernicharo, J., Cabezas, C., Agúndez, M., et al. 2021, A&A, 648, L3 [EDP Sciences] [Google Scholar]
- Charnley, S. B. 1997, ApJ, 481, 396 [NASA ADS] [CrossRef] [Google Scholar]
- Colzi, L., Rivilla, V. M., Beltrán, M. T., et al. 2021, A&A, 653, A129 [NASA ADS] [CrossRef] [EDP Sciences] [Google Scholar]
- Corby, J. F., Jones, P. A., Cunningham, M. R., et al. 2015, MNRAS, 452, 3969 [NASA ADS] [CrossRef] [Google Scholar]
- Corby, J. F., McGuire, B. A., Herbst, E., & Remijan, A. J. 2018, A&A, 610, A10 [NASA ADS] [CrossRef] [EDP Sciences] [Google Scholar]
- El-Abd, S. J., Brogan, C. L., Hunter, T. R., et al. 2019, ApJ, 883, 129 [Google Scholar]
- Esplugues, G. B., Viti, S., Goicoechea, J. R., & Cernicharo, J. 2014, A&A, 567, A95 [NASA ADS] [CrossRef] [EDP Sciences] [Google Scholar]
- Faure, A., Remijan, A. J., Szalewicz, K., & Wiesenfeld, L. 2014, ApJ, 783, 72 [CrossRef] [Google Scholar]
- Faure, A., Lique, F., & Remijan, A. J. 2018, J. Phys. Chem. Lett., 9, 3199 [NASA ADS] [CrossRef] [Google Scholar]
- Foo, L., Surányi, A., Guljas, A., et al. 2018, Mol. Astrophys., 13, 1 [NASA ADS] [CrossRef] [Google Scholar]
- Franz, H. B., King, P. L., & Gaillard, F. 2019, in Volatiles in the Martian Crust, eds. J. Filiberto, & S. P. Schwenzer (Amsterdam: Elsevier), 119 [CrossRef] [Google Scholar]
- Frisch, M. J., Trucks, G. W., Schlegel, H. B., et al. 2016a, Gaussian ~09 Revision A.02, gaussian Inc. Wallingford CT [Google Scholar]
- Frisch, M. J., Trucks, G. W., Schlegel, H. B., et al. 2016b, Gaussian ~16 Revision C.01, gaussian Inc. Wallingford CT [Google Scholar]
- Garrod, R. T., Widicus Weaver, S. L., & Herbst, E. 2008, ApJ, 682, 283 [Google Scholar]
- Gaume, R. A., Claussen, M. J., de Pree, C. G., Goss, W. M., & Mehringer, D. M. 1995, ApJ, 449, 663 [Google Scholar]
- Gieser, C., Beuther, H., Semenov, D., et al. 2021, A&A, 648, A66 [EDP Sciences] [Google Scholar]
- Ginsburg, A., Bally, J., Barnes, A., et al. 2018, ApJ, 853, 171 [Google Scholar]
- Hack, W., Kurzke, H., Rouveirolles, P., & Wagner, H. G. 1986, Berichte der Bunsengesellschaft für physikalische Chemie, 90, 1210 [CrossRef] [Google Scholar]
- Halfen, D. T., Ziurys, L. M., Brünken, S., et al. 2009, ApJ, 702, L124 [NASA ADS] [CrossRef] [Google Scholar]
- Halfen, D. T., Ilyushin, V., & Ziurys, L. M. 2011, ApJ, 743, 60 [Google Scholar]
- Herbst, E., Messer, J. K., De Lucia, F. C., & Helminger, P. 1984, J. Mol. Spectr., 108, 42 [NASA ADS] [CrossRef] [Google Scholar]
- Hollis, J. M., Jewell, P. R., Lovas, F. J., & Remijan, A. 2004a, ApJ, 613, L45 [Google Scholar]
- Hollis, J. M., Jewell, P. R., Lovas, F. J., Remijan, A., & Møllendal, H. 2004b, ApJ, 610, L21 [Google Scholar]
- Hollis, J. M., Lovas, F. J., Remijan, A. J., et al. 2006a, ApJ, 643, L25 [Google Scholar]
- Hollis, J. M., Remijan, A. J., Jewell, P. R., & Lovas, F. J. 2006b, ApJ, 642, 933 [Google Scholar]
- Hollis, J. M., Jewell, P. R., Remijan, A. J., & Lovas, F. J. 2007, ApJ, 660, L125 [NASA ADS] [CrossRef] [Google Scholar]
- Hougen, J. T., Kleiner, I., & Godefroid, M. 1994, J. Mol. Spectr., 163, 559 [Google Scholar]
- Hunter, T. R., Brogan, C. L., Megeath, S. T., et al. 2006, ApJ, 649, 888 [NASA ADS] [CrossRef] [Google Scholar]
- Hunter, T. R., Brogan, C. L., MacLeod, G., et al. 2017, ApJ, 837, L29 [NASA ADS] [CrossRef] [Google Scholar]
- Ilyushin, V. 2004, J. Mol. Spectr., 227, 140 [NASA ADS] [CrossRef] [Google Scholar]
- Ilyushin, V. V., & Hougen, J. T. 2013, J. Mol. Spectr., 289, 41 [NASA ADS] [CrossRef] [Google Scholar]
- Ilyushin, V. V., Alekseev, E., Dyubko, S., Kleiner, I., & Hougen, J. T. 2004, J. Mol. Spectr., 227, 115 [NASA ADS] [CrossRef] [Google Scholar]
- Ilyushin, V. V., Kisiel, Z., Pszczólkowski, L., Mäder, H., & Hougen, J. T. 2010, J. Mol. Spectr., 259, 26 [NASA ADS] [CrossRef] [Google Scholar]
- Ilyushin, V. V., Endres, C. P., Lewen, F., Schlemmer, S., & Drouin, B. J. 2013, J. Mol. Spectr., 290, 31 [NASA ADS] [CrossRef] [Google Scholar]
- Irvine, W. M., Brown, R. D., Cragg, D. M., et al. 1988, ApJ, 335, L89 [Google Scholar]
- Kaifu, N., Morimoto, M., Nagane, K., et al. 1974, ApJ, 191, L135 [Google Scholar]
- Kirtman, B. 1962, J. Chem. Phys., 37, 2516 [NASA ADS] [CrossRef] [Google Scholar]
- Kleiner, I. 2010, J. Mol. Spectr., 260, 1 [NASA ADS] [CrossRef] [Google Scholar]
- Lee, K. L. K., Loomis, R. A., Xue, C., El-Abd, S., & McGuire, B. A. 2021, https://doi.org/10.5281/zenodo.5092150 [Google Scholar]
- Lees, R. M., & Baker, J. G. 1968, J. Chem. Phys., 48, 5299 [NASA ADS] [CrossRef] [Google Scholar]
- Lefloch, B., Bachiller, R., Ceccarelli, C., et al. 2018, MNRAS, 477, 4792 [Google Scholar]
- Li, J., Wang, J., Zhu, Q., Zhang, J., & Li, D. 2015, ApJ, 802, 40 [Google Scholar]
- Ligterink, N. F. W., Terwisscha van Scheltinga, J., Taquet, V., et al. 2018, MNRAS, 480, 3628 [Google Scholar]
- Ligterink, N. F. W., El-Abd, S. J., Brogan, C. L., et al. 2020, ApJ, 901, 37 [Google Scholar]
- Mangum, J. G., & Shirley, Y. L. 2015, PASP, 127, 266 [Google Scholar]
- Maret, S., Hily-Blant, P., Pety, J., Bardeau, S., & Reynier, E. 2011, A&A, 526, A47 [NASA ADS] [CrossRef] [EDP Sciences] [Google Scholar]
- Margulès, L., Ilyushin, V. V., McGuire, B. A., et al. 2020a, J. Mol. Spectr., 371, 111304 [CrossRef] [Google Scholar]
- Margulès, L., McGuire, B. A., Evans, C. J., et al. 2020b, A&A, 642, A206 [EDP Sciences] [Google Scholar]
- Maris, A., Calabrese, C., Favero, L. B., et al. 2019, ACS Earth Space Chem., 3, 1537 [NASA ADS] [CrossRef] [Google Scholar]
- Matteucci, F. 2001, The Chemical Evolution of the Galaxy (Dordrecht: Springer,) 253 [Google Scholar]
- McGuire, B. A., Loomis, R. A., Charness, C. M., et al. 2012, ApJ, 758, L33 [NASA ADS] [CrossRef] [Google Scholar]
- McGuire, B. A., Carroll, P. B., Loomis, R. A., et al. 2016, Science, 352, 1449 [Google Scholar]
- McGuire, B. A., Shingledecker, C. N., Willis, E. R., et al. 2017, ApJ, 851, L46 [Google Scholar]
- McGuire, B. A., Brogan, C. L., Hunter, T. R., et al. 2018, ApJ, 863, L35 [NASA ADS] [CrossRef] [Google Scholar]
- Melosso, M., Dore, L., Tamassia, F., et al. 2020, J. Phys. Chem. A, 124, 240 [NASA ADS] [CrossRef] [Google Scholar]
- Mota, V. C., Varandas, A. J. C., Mendoza, E., Wakelam, V., & Galvão, B. R. L. 2021, ApJ, 920, 37 [NASA ADS] [CrossRef] [Google Scholar]
- Moullet, A., Gurwell, M. A., Lellouch, E., & Moreno, R. 2010, Icarus, 208, 353 [CrossRef] [Google Scholar]
- Müller, H. S. P., Belloche, A., Xu, L.-H., et al. 2016, A&A, 587, A92 [NASA ADS] [CrossRef] [EDP Sciences] [Google Scholar]
- Neill, J. L., Muckle, M. T., Zaleski, D. P., et al. 2012, ApJ, 755, 153 [Google Scholar]
- Neufeld, D. A., & Wolfire, M. G. 2009, ApJ, 706, 1594 [Google Scholar]
- Palumbo, M. E., Tielens, A. G. G. M., & Tokunaga, A. T. 1995, ApJ, 449, 674 [NASA ADS] [CrossRef] [Google Scholar]
- Palumbo, M. E., Geballe, T. R., & Tielens, A. G. G. M. 1997, ApJ, 479, 839 [NASA ADS] [CrossRef] [Google Scholar]
- Reid, M. J., Menten, K. M., Brunthaler, A., et al. 2014, ApJ, 783, 130 [Google Scholar]
- Reid, M. J., Menten, K. M., Brunthaler, A., et al. 2019, ApJ, 885, 131 [Google Scholar]
- Remijan, A. J., Hollis, J. M., Lovas, F. J., Plusquellic, D. F., & Jewell, P. R. 2005, ApJ, 632, 333 [NASA ADS] [CrossRef] [Google Scholar]
- Requena-Torres, M. A., Martín-Pintado, J., Martín, S., & Morris, M. R. 2008, ApJ, 672, 352 [Google Scholar]
- Rivero Santamaría, A., Dayou, F., Rubayo-Soneira, J., & Monnerville, M. 2017, J. Phys. Chem. A, 121, 1675 [CrossRef] [Google Scholar]
- Sánchez-Monge, Á., Schilke, P., Schmiedeke, A., et al. 2017, A&A, 604, A6 [NASA ADS] [CrossRef] [EDP Sciences] [Google Scholar]
- Semenov, D., Favre, C., Fedele, D., et al. 2018, A&A, 617, A28 [NASA ADS] [CrossRef] [EDP Sciences] [Google Scholar]
- Shingledecker, C. N., Álvarez-Barcia, S., Korn, V. H., & Kästner, J. 2019, ApJ, 878, 80 [Google Scholar]
- Skouteris, D., Vazart, F., Ceccarelli, C., et al. 2017, MNRAS, 468, L1 [NASA ADS] [Google Scholar]
- Smirnov, I. A., Alekseev, E. A., Ilyushin, V. V., et al. 2014, J. Mol. Spectr., 295, 44 [NASA ADS] [CrossRef] [Google Scholar]
- Soundararajan, S. 1957, Trans. Faraday Soc., 53, 159 [CrossRef] [Google Scholar]
- Stephens, P. J., Chabalowski, C. F., Devlin, F. J., & Jalkanen, K. J. 1994, Chem. Phys. Lett., 225, 247 [NASA ADS] [CrossRef] [Google Scholar]
- Taylor, B. N.,& Kuyatt, C. E. 1994, Guidelines for Evaluating and Expressing the Uncertainty of NIST Measurement Results, 1297 (USA: National Institute of Standards and Technology) [Google Scholar]
- Turner, B. E. 1991, ApJS, 76, 617 [NASA ADS] [CrossRef] [Google Scholar]
- Ulich, B. L., & Haas, R. W. 1976, ApJS, 30, 247 [Google Scholar]
- van der Tak, F. F. S., Boonman, A. M. S., Braakman, R., & van Dishoeck, E. F. 2003, A&A, 412, 133 [NASA ADS] [CrossRef] [EDP Sciences] [Google Scholar]
- Wakelam, V., Caselli, P., Ceccarelli, C., Herbst, E., & Castets, A. 2004, A&A, 422, 159 [NASA ADS] [CrossRef] [EDP Sciences] [Google Scholar]
- Willacy, K., Williams, D. A., & Minh, Y. C. 1993, MNRAS, 263, L40 [Google Scholar]
- Xu, L.-H., Fisher, J., Lees, R., et al. 2008, J. Mol. Spectr., 251, 305 [Google Scholar]
- Xue, C., Remijan, A. J., Brogan, C. L., et al. 2019, ApJ, 882, 118 [NASA ADS] [CrossRef] [Google Scholar]
- Yamaguchi, A., Hagiwara, S., Odashima, H., Takagi, K., & Tsunekawa, S. 2002, J. Mol. Spectr., 215, 144 [NASA ADS] [CrossRef] [Google Scholar]
- Zakharenko, O., Motiyenko, R. A., Margulès, L., & Huet, T. R. 2015, J. Mol. Spectr., 317, 41 [Google Scholar]
- Zasowski, G., Kemper, F., Watson, D. M., et al. 2009, ApJ, 694, 459 [CrossRef] [Google Scholar]
- Zernickel, A., Schilke, P., Schmiedeke, A., et al. 2012, A&A, 546, A87 [NASA ADS] [CrossRef] [EDP Sciences] [Google Scholar]
Access to the entire PRIMOS data set, specifics on the observing strategy, and overall frequency coverage information is available at http://archive.nrao.edu by searching for GBT Program ID: AGBT07A_051.
As with CH3CONH2, maser transitions are identified because they greatly deviate from the predicted LTE-model. A full characterization of the spectrum including this maser activity is beyond the scope of this work.
All Tables
Rotational, vibrational, and total partition functions of CH3CSNH2 at various temperatures.
Harmonic vibrational frequencies up to 1000 cm−1 of CH3CSNH2 determined at the B3LYP/6-311++G(3df,2pd) level of theory and basis set.
Parameters of our best-fit LTE model of methanol, methyl mercaptan, and acetamide, and column density upper limit for thioacetamide, toward Sgr B2(N2).
Spectroscopic properties of CH3CONH2 lines detected in PRIMOS toward Sgr B2(LMH).
Spectroscopic properties of the CH3CSNH2 lines shown toward the Sgr B2 and NGC 6334I regions.
Parameters for each of the ASAI sources used to search for CH3CSNH2 and CH3CONH2.
Upper limits to the abundances of CH3CSNH2 and CH3CONH2 toward the ASAI sources and the spectral line parameters used to calculate the upper limits in each of the sets of observations.
All Figures
|
Fig. 1 Synthetic LTE spectrum of CH3CSNH2 (in red) used to derive the upper limit to its column density, overlaid on the ALMA spectrum of Sgr B2(N2) (in black) and the synthetic spectrum that contains the contributions of all the species (but not CH3CSNH2) that we have identified so far in this source (in green). The dotted line in each panel indicates the 3σ noise level. The transitions of CH3CSNH2 that have a modeled peak temperature lower than 3σ and the ones that are heavily contaminated by other species are not shown. |
| In the text | |
|
Fig. 2 Synthetic LTE spectrum of CH3CONH2 (in green) A-symmetry state transitions generated from the physical conditions and observing parameters described in Sect. 3.2 (Tex = 5.8 K, source size of 20′′, three velocity components at +62, +71 and + 81 km s−1 yielding an NT ~ 7.7 × 1013 cm−2 from all three components) overlaid on the GBT spectrum of Sgr B2(LMH) (in black). Transition quantum numbers and upper state energy levels (Table 6) are in the bottom left corner of each spectrum. Quantum numbers with an “⋆” have HFS included in the synthetic spectrum. |
| In the text | |
|
Fig. 3 Illustrative spectrum of CH3CONH2 showing therelative intensities of all the HFS (Table 6) and multiple velocity components at +62 (in yellow), +71 (in blue) and + 81 km s−1 (in green) overlaid on the GBT spectrum of Sgr B2(LMH) (in black). The intensity of these emission features cannot be matched by the synthetic LTE model in this work. |
| In the text | |
|
Fig. 4 Synthetic LTE spectrum of CH3CONH2 (in green) E-symmetry state transitions generated from the physical conditions and observing parameters described in Sect. 3.2 (Tex = 5.8 K, source size of 20′′, three velocity components at +62, +71 and + 81 km s−1 yielding an NT ~ 1.5 × 1014 cm−2 from all 3 components) overlaid on the GBT spectrum of Sgr B2(LMH) shown in black. Transition quantum numbers and upper state energy levels (Table 6) are in the bottom left corner of each spectrum. |
| In the text | |
|
Fig. 5 Synthetic LTE spectrum of CH3CSNH2 (in red). The A-symmetry state transitions are presented in the first column in panels a–e and the E-symmetry state transitions are presented in the second column in panels f–j. The spectrum was generated from the physical conditions and observing parameters described in Sect. 3.2 (that is, Tex = 5.8, source size of 20′′, NT ~ 2.2 × 1013 cm−2) overlaid onthe GBT spectrum of Sgr B2(LMH) shown in black. Transition quantum numbers and upper state energy levels (Table 7) are at the bottom of each spectrum. No significant emission from CH3CSNH2 transitions are detected beyond the 3σ upper limit. |
| In the text | |
|
Fig. 6 Synthetic LTE spectrum of CH3CSNH2 (in red) used to derive the upper limit to its column density, overlaid on the ALMA spectrum of NGC 6334I (in black). Figure labels are similar to Fig. 1. The transitions of CH3CSNH2 that are weaker than 3σ and the ones that are heavily contaminated by other species are not shown. |
| In the text | |
|
Fig. 7 Transitions of CH3CONH2 used to calculate the 3σ upper limits given in Table 9. In each panel, the green trace shows the transition simulated using the derived upper limit column density and the physical parameters assumed for that source. The dotted line in each panel indicates the 3σ noise level. The quantum numbers and upper-level energies for each transition is shown in the lower right of each panel. The source name is given in the upper left of each panel. Due to the large variances between observations, the intensity and velocityaxes are not necessarily uniform between each panel. |
| In the text | |
|
Fig. 8 Transitions of CH3CSNH2 used to calculate the upper limits given in Table 9. Panel description is the same as in Fig. 7. |
| In the text | |
Current usage metrics show cumulative count of Article Views (full-text article views including HTML views, PDF and ePub downloads, according to the available data) and Abstracts Views on Vision4Press platform.
Data correspond to usage on the plateform after 2015. The current usage metrics is available 48-96 hours after online publication and is updated daily on week days.
Initial download of the metrics may take a while.