Fig. 5
Download original image
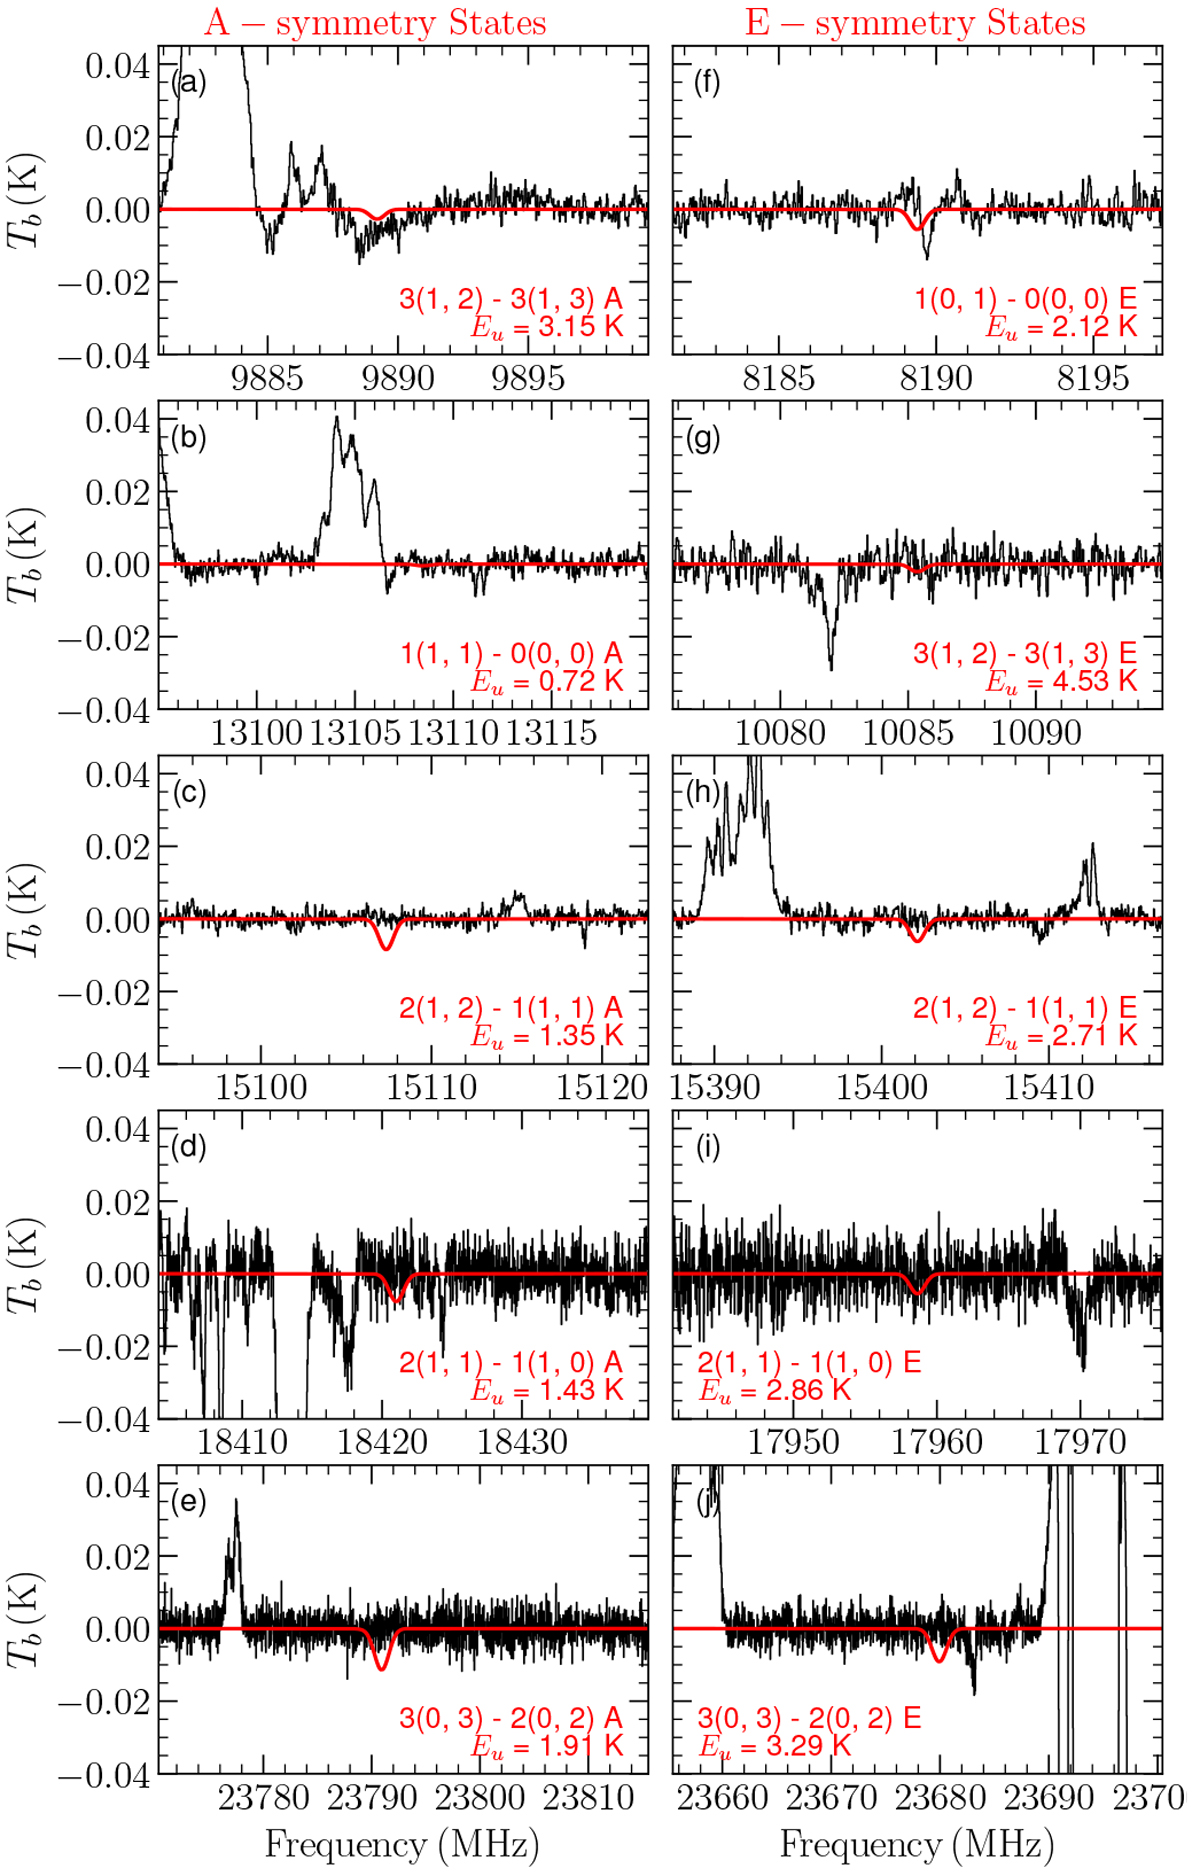
Synthetic LTE spectrum of CH3CSNH2 (in red). The A-symmetry state transitions are presented in the first column in panels a–e and the E-symmetry state transitions are presented in the second column in panels f–j. The spectrum was generated from the physical conditions and observing parameters described in Sect. 3.2 (that is, Tex = 5.8, source size of 20′′, NT ~ 2.2 × 1013 cm−2) overlaid onthe GBT spectrum of Sgr B2(LMH) shown in black. Transition quantum numbers and upper state energy levels (Table 7) are at the bottom of each spectrum. No significant emission from CH3CSNH2 transitions are detected beyond the 3σ upper limit.
Current usage metrics show cumulative count of Article Views (full-text article views including HTML views, PDF and ePub downloads, according to the available data) and Abstracts Views on Vision4Press platform.
Data correspond to usage on the plateform after 2015. The current usage metrics is available 48-96 hours after online publication and is updated daily on week days.
Initial download of the metrics may take a while.