| Issue |
A&A
Volume 663, July 2022
|
|
|---|---|---|
| Article Number | A132 | |
| Number of page(s) | 19 | |
| Section | Atomic, molecular, and nuclear data | |
| DOI | https://doi.org/10.1051/0004-6361/202243172 | |
| Published online | 26 July 2022 | |
Submillimeter wave spectroscopy and astronomical search for 1-propanimine★
1
Université de Lille,
CNRS, UMR 8523, PhLAM, Physique des Lasers Atomes et Molécules,
59000
Lille, France
e-mail: This email address is being protected from spambots. You need JavaScript enabled to view it.
2
National Radio Astronomy Observatory,
Charlottesville,
VA 22903 USA
3
Max-Planck-Institut für Radioastronomie,
Auf dem Hügel 69,
53121
Bonn, Germany
4
Department of Chemistry, Massachusetts Institute of Technology,
Cambridge,
MA 02139 USA
5
Astrophysik/I. Physikalisches Institut, Universität zu Köln,
Zülpicher Str. 77,
50937
Köln, Germany
6
Departments of Chemistry and Astronomy, University of Virginia,
Charlottesville,
VA 22904 USA
7
Univ Rennes, Ecole Nationale Supérieure de Chimie de Rennes,
CNRS, ISCR UMR6226,
35000
Rennes, France
Received:
21
January
2022
Accepted:
28
February
2022
Abstract
Context. Methanimine, CH2NH, and ethanimine, CH3CHNH, were both detected in the interstellar medium (ISM), the former in the 1970s and the latter nearly a decade ago. By analogy with nitriles, for which hydrogen cyanide, acetonitrile, and ethyl cyanide are the most abundant, n-propanimine was suggested as a candidate for detection in the ISM.
Aims. To date, no measurements of the rotational spectrum of 1-propanimine have been made. We present measurements and an analysis of its spectrum in the millimeter- and submillimeter-wave domain in order to provide an accurate prediction that is required to search for this molecule in the ISM.
Methods. The rotational spectrum of propanimine was investigated from 150 to 470 GHz. Watson’s asymmetric top Hamiltonian in the Ir representation and S reduction was used for the analysis. The new prediction allowed us to search for 1-propanimine toward the high-mass star forming region Sagittarius B2(N), the dark molecular cloud TMC-1, as well as a sample of low-mass protostellar objects. These sources were observed with the Atacama Large Millimeter/submillimeter Array, the Green Bank Telescope, or the IRAM 30 m telescope.
Results. A total of 585 and 296 transitions of the E and Z-1-propanimine, respectively, were newly assigned and fitted in the laboratory spectra recorded up to 470 GHz. Quantum numbers up to J = 73 and Ka = 18 were reached for the E isomer and J = 56 and Ka = 17 for the Z isomer. We report the nondetection of 1-propanimine toward all astronomical sources investigated in this work. We find in particular that 1-propanimine is at least 20 times less abundant than methanimine in the envelope of the high-mass star forming region Sagittarius B2(N).
Conclusions. The accurate spectroscopic prediction of its spectrum provided in this work will allow astronomers to continue the search for 1-propanimine in the ISM.
Key words: ISM: molecules / methods: laboratory: molecular / submillimeter: ISM / molecular data / astrochemistry / line: identification
Full Tables 2 and 3 are only available at the CDS via anonymous ftp to cdsarc.u-strasbg.fr (130.79.128.5) or via http://cdsarc.u-strasbg.fr/viz-bin/cat/J/A+A/663/A132
© L. Margulès et al. 2022
 Open Access article, published by EDP Sciences, under the terms of the Creative Commons Attribution License (https://creativecommons.org/licenses/by/4.0), which permits unrestricted use, distribution, and reproduction in any medium, provided the original work is properly cited.
1 Introduction
Carbon and nitrogen atoms can be connected together by a single, double, or triple bond. In the interstellar medium (ISM) more than 45 cyanides (including isocyanides) have been observed1, but the number of detected compounds with a double or single bond between nitrogen and carbon atoms is much more limited. Six imines have been detected: methanimine, CH2NH (Godfrey et al. 1973); E- and Z-ethanimine, CH3CHNH (Loomis et al. 2013); E- and Z-cyanomethanimine, HNCHCN (zaleski et al. 2013; Rivilla et al. 2019); and Z-2-propynimine, HCC-CHNH (Bizzocchi et al. 2020). Several compounds with a C = N double bond can be added: iminopropadienylidene HNCCC (Kawaguchi et al. 1992); ketenimine, also called ethenimine, CH2CNH (Lovas et al. 2006); carbodiimide, HNCNH (McGuire et al. 2012); HCCN and CCN radicals (Guélin & Cernicharo 1991; Anderson & Ziurys 2014); the methylene amidogen H2CN (Ohishi et al. 1994); and three isocyanates HNCO (Snyder & Buhl 1972), CH3NCO (Cernicharo et al. 2016), and C2H5NCO (Rodríguez-Almeida et al. 2021).
It should be noted that imines, which have a permanent dipole moment of about 2D and often two stereoisomers (E and Z), are generally less easily detected by their rotational spectra than nitriles. The latter usually have a permanent dipole moment between 3 and 4D and have no stereoisomer issued from the CN bond due to its axial symmetry. How can imines form in the ISM? Several approaches have been considered mainly in the solid phase, but it should be noted that expecting a general behavior for imines in the ISM independently of the substituent is only a hypothesis. The reduction of nitriles to corresponding imines on the surfaces of interstellar dust grains by atomic hydrogen bombardment has been proposed several times for methanimine (Godfrey et al. 1973), ethanimine (Loomis et al. 2013), or Z-cyanomethanimine (Rivilla et al. 2019). However, based on laboratory grain chemistry simulations, this approach appears unable to generate significant amounts of methanimine in the ISM (Theulé et al. 2011), and it seems to be even less efficient for substituted derivatives (Nguyen et al. 2019). Oxidation of amines to form imines by removal of dihydrogen could be accomplished by photolysis (Bossa et al. 2012), but amines like ethylamine or propargylamine corresponding to detected imines (ethanimine and propynimine, respectively) have not yet been detected or only tentatively in the case of ethylamine (Zeng et al. 2021), which makes this approach very hypothetical.
The reaction of ammonia on aldehydes followed by the elimination of one molecule of water could explain the formation of imines. The detection of α-aminoalcohols, which are intermediates in this type of reaction, could support this approach, but the rotational spectra of these kinetically unstable compounds have never been recorded. While thermal formation on matrix at 80 K has been demonstrated, their characterization in the gas phase has been limited to a detection in mass spectrometry during the warming of the solid in vacuo (Bossa et al. 2009). On the other hand, laboratory simulations of the formation of methanimine on interstellar grains by dehydration of the α-aminoalcohol intermediate did not allow the identification of the imine (Vinogradoff et al. 2012). Other approaches could be envisaged, such as using nitrogen radicals with various reagents (e.g., CO, H2CO, CH4) or ammonia with radicals, but to the best of our knowledge these approaches have never been rationalized in the aim to find a way for the synthesis of imines in the ISM. Recently, it has been proposed, on the basis of theoretical calculations, that methanimine could be the precursor of other imines (Lupi et al. 2020). It should be noted that all the imines detected in the ISM have corresponding nitriles that are abundant in certain astronomical environments (HCN for methanimine, CH3CN for E- and Z-ethanimine, HC3N for Z-propynimine, and NCCN for E- and Z-cyanomethanimine), even if the detection of NCCN, a compound without dipole moment, was made through the protonated derivative (Agúndez et al. 2015).
Consequently, ethyl cyanide (C2H5CN) being abundant in the ISM, we have identified 1-propanimine, C2H5CHNH (hereafter simply propanimine), which is the next complex compound after CH2NH and CH3CHNH, as a candidate for detection in the ISM. Since low boiling point imines in pure form can easily be synthesized by dehydrocyanation in vacuo of the corresponding α-aminonitrile (Guillemin & Denis 1988), we used this approach to record the millimeter wave spectrum of C2H5CHNH from 150 GHz to 470 GHz.
2 Experimental Analysis
2.1 Synthesis
2-aminobutyronitrile (C2H5CH(CN)NH2) was slowly vaporized in a reactor containing dry KOH in half-section and heated to 90 °C. A trap cooled at −80 °C removed high boiling point compounds and the gaseous flow of pure E- and Z-propanimine was condensed in a trap immersed in a liquid nitrogen bath (Guillemin & Denis 1988). As the propanimine was found to have a stability well below one minute in the cell, the synthesis had to take place during the measurements, and the gaseous flow of the imine was continuously introduced into the Pyrex cell of the spectrometer in slow flow mode.
2.2 Lille: Submillimeter Wave Spectra
The measurements in the frequency range under investigation (150–470 GHz) were performed using the Lille spectrometer (Zakharenko et al. 2015). The absorption cell was a Pyrex tube (6 cm diameter, 120 cm long). The sample pressure during measurements was about 10 Pa at room temperature; the line width was limited by Doppler broadening. The frequency ranges 150–330 and 400–470 GHz were covered with various active and passive frequency multipliers from VDI Inc. and an Agilent synthesizer (12.5–18.25 GHz) was used as the source of radiation. Estimated uncertainties for measured line frequencies are 50 kHz, which is a bit higher than our usual uncertainties (30 kHz). This is due to the fact that we had to use a frequency step two to three times larger than usual (from 60 kHz at 150 GHz up to 126 kHz at 470 GHz) in order to be faster because we had to work in a flow mode with a limited amount of samples.
3 Analysis of the Laboratory Spectra of Propanimine
No spectroscopic studies of propanimine existed when we started this work. The first prediction of the spectra was done using spectroscopic parameters coming from density functional theory calculations at the B3LYP level of theory with a 6-311++g(3df, 2pd) basis set. The calculations were performed using the Gaussian 09 suite of programs (Frisch et al. 2009). As in the case of ethanimine, the E isomer was found to be more stable than the Z isomer (+3.16 kJ mol−1, this energy difference includes the zero-point correction) (see Fig. 1). Considering the Boltzmann factor at room temperature, the lines of the Z isomer should be about four times less intense than the lines of the E isomer. However, the values of the dipole moment obtained from calculations are larger for the Z isomer (µa = 2.49 D, µb = 1.00 D) than those for the E isomer (µa = 1.12 D, µb = 0.75 D, µc = 1.57 D). Typically, in the centimeter and millimeter wave domain, the most intense transitions of complex organic molecules are the R-branch transitions related to the µa component of the dipole moment. The value of µa of the Z isomer is twice that of the E isomer because the intensity of a transition is proportional to µ2, the spectra at room temperature for the two isomers will have similar intensities even if the Z isomer is 3.16 kJ mol−1 higher in energy than the E isomer, as illustrated in Fig. 2. In astronomical hot molecular cores with typical temperatures of 150–250 K both should be detectable.
The identification of the spectrum began with the transitions of the aR-branches. Even if there were large offsets with respect to the predictions made from the density functional theory calculations, the characteristic pattern of the branch was well reproduced, which allowed unambiguous identification. The offsets observed between the calculations and the experimental spectra at 160 GHz for the aR-branch band heads corresponding to J = 19−18 were +470 MHz and +290 MHz for the Z and E stereoisomers, respectively. All aR-branch lines were then analysed up to 470 GHz without difficulties. Then bR lines were searched for and included in the fit. Finally, nice Q-branch lines due to µc-type transitions could be observed for the E isomer above 400 GHz. It should be noted that these transitions do not exist for Z isomer because its µc is zero. Internal rotation splitting of the CH3 group (for the E isomer) or hyperfine structure splitting caused by the 14N nucleus are only resolvable in selected transitions at low frequencies. The two types of splitting were not resolved here.
A total of 585 distinct lines of the E isomer were assigned with maximum values for J and Ka of 73 and 18, respectively. Both A and S reductions were tested since this molecule is very close to the prolate limit with κ = −0.9864. The A reduction requires 24 parameters; using the S reduction with one additional parameter decreases the standard deviation of the fit from 146.1 to 39.4 kHz. Even with an additional parameter, the reduction S is more efficient in our case. A more detailed discussion on the advantage of the S reduction over the A reduction in the case of SO2 with one and two 18O can be found in Margulès et al. (2020b). The final fits and the prediction were done using this reduction for both stereoisomers. The spectra of the Z isomer looks different from that of the E isomer because of the lack of the µc dipole moment. The spectra of the Z isomer are less dense than those the E isomer. Finally, 296 distinct lines could be assigned for the Z conformer with maximum values for J and Ka of 56 and 17, respectively. The standard deviation of the fit is 48.4 kHz and 19 parameters were determined. We employed ASFIT (Kisiel 2001) for the fitting. The final set of parameters that we obtained are listed in Table 1. Part of the new measurements for the E and Z -propanimine are given in Tables 2 and 3, respectively. Owing to their large size, the complete versions of the global fit (full Tables 2 and 3) for the two stereoisomers are supplied at the CDS. The predicted spectra are available in standard .cat format (Pickett 1991) from the new database of the Lille spectroscopy group called the Lille Spectroscopic Database (https://lsd.univ-lille.fr). The predictions can be generated using various options (e.g., intensity units, temperature, and frequency range) that provide additional flexibility in the data access.
The tabulated values for the partition function are given in Table 4, with Qtot(T) = Qvib(T) × Qrot(T). The rotational partition function was obtained directly at various temperatures from SPCAT (Pickett 1991). The vibrational contribution was calculated in the harmonic approximation (Gordy & Cook 1984), as we proceeded in our previous studies (see, e.g., Margulès et al. 2020c). Of the 27 vibrational modes, only the 7 with an energy level lower than 1000 cm−1 (1439 K) were considered. The other higher energy states have no influence on the calculation of the partition function. The harmonic frequencies of the vibrational modes used in the Qvib(T) calculations were obtained from density functional theory calculations at the B3LYP level of theory with a 6-311++g(3df, 2pd) basis set.
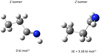 |
Fig. 1 E and Z stereoisomers of propanimine. Isomer E, which is more stable than isomer Z, was calculated to be 3.16 kJ mol−1 lower in energy (zero-point correction included) via the B3LYP/6-311++g(3df,2pd) procedure using the Gaussian 09 suite of programs (Frisch et al. 2009). |
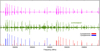 |
Fig. 2 Comparison of the experimental spectrum recorded at room temperature and the theoretical spectrum between 167.4 and 170.0 GHz. Top: simulated spectrum at 300 K for both isomers of propanimine. Middle: part of the experimental spectrum. Bottom: predictions for isomers E (in red) and Z (in blue). |
Spectroscopic parameters of E- and Z-propanimine (in MHz) in the S reduction.
4 Astronomical Observations
4.1 Search for Propanimine and Related Imines Toward Sgr B2(N) with the GBT
As described in Remijan et al. (2022), the PRebiotic Interstellar Molecule Survey (PRIMOS)2 was a key science program that started in 2008 January and concluded in 2011 July conducted with the Robert C. Byrd Green Bank Telescope (GBT) currently managed by the Green Bank Observatory (GBO). The PRIMOS project covers nearly all observable frequencies available to ground-based instrumentation from ~300 MHz to 48 GHz at high sensitivity (~3–9 mK rms) and spectral resolution (24.4 kHz). These observations were centered on the Sgr B2(N) Large Molecule Heimat (LMH) at (α, δ)J2000 = (17h47m19s.8, −28°22′17″.0).
Figure 3 shows the results of our attempt to detect the strongest transitions, including possible maser transitions, from C2H5CHNH between 8 and 43 GHz from the PRIMOS survey. Similar to the identification done in the laboratory spectra, we first searched for the more stable E -propanimine of C2H5CHNH. The calculated dipole moments of the E conformer (see Sect. 3) suggest that c-type transitions should be the strongest transitions and, as is typical for large asymmetric top molecules, R-branch transitions are also the strongest transitions observed except in those cases where maser action greatly increases the line intensity, as seen with molecules such as HNCNH (McGuire et al. 2012), CH3CONH2 (Remijan et al. 2022), CH3OCHO (Faure et al. 2014), and CH2NH (Faure et al. 2018). For the Z isomer the situation is quite different as the calculated a-dipole moment, for example, is more than twice as large as the E isomer (see Sect. 3). As such, for the Z isomer, a-type transitions should typically be the strongest transitions observed. However, for completeness, we searched for all R- and Q-branch, a-, b-, and c-type transitions over the entire PRIMOS observing range for any emission or absorption features from either the E or Z -propanimine of C2H5CHNH. Unfortunately, no transitions of C2H5CHNH were detected above a 3σ detection limit at any frequency covered by the PRIMOS survey.
We used the software MOLSIM (Lee et al. 2021) to perform the single excitation temperature modeling and to estimate the upper limit for the spectra analysis of the PRIMOS survey. Synthetic spectra are produced with a single excitation temperature assumption that all transitions are thermalized and corrected for optical depth, as discussed in Turner (1991) and Mangum & Shirley (2015). In addition, we assumed a non-thermal background source of emission with a (beam-diluted) continuum antenna temperature TC[K] = 102.3 × v[GHz]−1.06 (Hollis et al. 2007). Assuming the continuum emission has a source size of ~20″, the corresponding continuum brightness temperatures were obtained through dividing TC by the beam dilution factor. We simulated the spectrum of C2H5CHNH assuming an excitation temperature of 5.8 K, a source size of ~20″, and a line width (dV) of 10 km s−1. However, as Fig. 3 illustrates, no C2H5CHNH transitions (in magenta and cyan for the E and Z isomers, respectively) were detected. To set an upper limit of C2H5CHNH, we used the RMS noise level from the C2H5CHNH pass bands from the transition with the strongest predicted intensity in a pass band with the lowest RMS noise level. A 3σ upper limit of 1.5 × 1013 cm−2 was found for the E isomer from the strongest predicted transition at 19 555.99 MHz (predicted line intensity of 7.9 mK in a pass band with an RMS noise of 2.6 mK) and 1.0 × 1013 cm−2 was found for the Z isomer from the strongest predicted transition at 8390.19 MHz (predicted line intensity of 7.6 mK in a pass band with 5 mK RMS).
It is now possible to compare the upper limit column density determined for C2H5CHNH to other detected imines toward the Sgr B2(N-LMH) region from earlier PRIMOS observations. Ketenimine (CH2CNH) was first detected by Lovas et al. (2006). However, only three transitions were identified in that work, so a more complete analysis with additional transitions now detected from the PRIMOS survey is warranted. The measured dipole moments for CH2CNH are µa = 0.434(1) D and µc = 1.371(6) D (Rodler et al. 1984). As such, c-type transitions will be more prominent; however, an investigation including all P-branch transitions (∆J = −1) and R-branch transitions (∆J = 1) from both a-and c-type transitions in the detectable range of the PRIMOS survey was done.
All the transitions detected in Lovas et al. (2006) were ∆J = −1, c-type transitions. Fitting these transitions with MOLSIM, we find that the best fit to the 8(1,7)–9(0,9) and the 7(1,6)–8(0,8) transitions gives a total column density of CH2CNH of NT ~ 1.8 × 1016 cm−2 assuming a source size of 20″, δν = 10 km s−1, and Tex = 5.8 K. The fit (and all subsequent reported fits in this section) is the sum of all three velocity components at vLSR = +64, +73, and +82 km s−1 detected toward the Sgr B2(N-LMH) region in the PRIMOS survey. However, the 9(1,8)–10(0,10) transition at 4930.36 MHz contains material from a more extended area as the GBT beam at this frequency (153″) includes the Sgr B2(M) region. In this case, an additional contribution with a NT of 1.75 × 1017 cm−2 from the Sgr B2(M) region at its nominal vLSR is needed to accommodate the observed intensity. Furthermore, the 8(1,7)–9(0,9) transition shows contamination by an unidentified feature around 23173.42 MHz. In addition, the very low Tex is necessary to account for the absorption feature seen at 41 524.29 MHz given the very low continuum emission of this region around 41 GHz (see Fig. 4).
The situation is not as clear for the R-branch, ∆J= 1, a-and c-type transitions covered in the PRIMOS survey. In this case, because these transitions are detected mostly in emission, except in those cases where no feature is detected, it suggests that the emission is coming from a more compact and hot component of CH2CNH, as was originally suggested by Lovas et al. (2006). Assuming the following physical properties, a derived total column density of CH2CNH of NT ≈ 4.6 × 1016 cm−2, a source size of 5″, a line width δν = 10 km s−1, and an excitation temperature Tex = 150 K for all three velocity components, can account for the measured intensity of the 12( 0,12)–11( 1,10) transition at 31 251.20 MHz and the non detection of the 1( 0, 1)–0( 0, 0) and 2( 0, 2)–1( 0, 1) transitions at 19 133.25 MHz and 38 266.28 MHz, respectively. However, the 11( 0,11)–10( 1,9) transition at 13 212.59 MHz is still severely underpredicted, suggesting that this transition is either contaminated by an unknown feature or is somehow being pumped by maser action. In order to account for the measured intensity of this transition assuming a source size of 5″, δν = 10 km s−1, and Tex = 150 K, would require a total column density of CH2CNH greater than NT ≈ 2× 1018 cm−2. Finally, the very weak (or non-existent) 13( 0,13)–12( 1,11) transition at 49184.07 MHz also cannot be explained by the parameters determined from the 31 251.20 MHz transition. The measured noise level at frequencies around 49 GHz is almost as high as the measured intensity of the lines at 31 and 13 GHz. In addition, 49 GHz is near the edge of the tuning range of the GBT Q-band receiver so the sensitivity and the aperture efficiency of the Q-band receiver fall off quite rapidly, thus making the detection of any feature at the extreme edge of the GBT tuning range problematic.
Nonetheless, from this analysis, using the derived total column density of CH2CNH of NT ≈ 1.8 × 1016 cm−2 from the measured P-branch absorption features gives an upper limit to the column density ratio of C2H5CHNH/CH2CNH of <10−3. However, as can be seen from the descriptions above, this value is highly uncertain as only a very limited number of absorption features of CH2CNH were detected, and one of them contains the absorption from an additional source: Sgr B2(M). A more thorough analysis, which is beyond the scope of this work, of the low-frequency detection of CH2CNH is necessary to better constrain the column density and physical environments containing CH2CNH.
Methanimine (CH2NH) was first reported by Godfrey et al. (1973) toward Sgr B2(N). In a recent investigation by Faure et al. (2018), non-thermal excitation was investigated to try and determine the physical conditions leading to the measured intensities of the observed low-frequency maser emission features. A best fit was found for a H2 density range between 6 × 10² and 6 × 106 cm−3 and an excitation temperature of Tex = 30 K. From this fit the determined total column density of CH2NH for the low-velocity cloud is NT = 2.5 × 1014 cm−2 and for the high-velocity cloud is NT = 1 × 1014 cm−2. This gives an upper limit to the column density ratio of C2H5CHNH/CH2NH of 0.04 (and a CH2CNH/CH2NH ratio of ~57). Unfortunately, there is no accepted formation route that justifies the abundance of CH2CNH being so much higher than CH2NH, and further investigation of both species is warranted to further ascertain this apparent discrepancy.
Ethanimine (CH3CHNH) was first reported by Loomis et al. (2013). The derived total column density of the E and Z stereoisomers of CH3CHNH was determined to be NT ~ 2.3 × 1013 cm−2 assuming that the source of CH3CHNH fills the GBT beam and that Tex = 6 K. Zaleski et al. (2013) also detected transitions of CH3CHNH in both emission and absorption and speculated that, like other low-frequency transitions of other large molecules, these emission features could be due to maser activity. As such, the total derived CH3CHNH column density determined from just the features detected in absorption was found to be NT ~ 7 × 1013 cm−2 (over 20 transitions of CH3CHNH were detected). This then gives a range of upper limits to the column density ratio of C2H5CHNH/CH3CHNH between 0.7 and 0.2. Finally, E-cyanoethanimine (E-HNCHCN) was first reported by Zaleski et al. (2013) (nine transitions were detected all in absorption). By once again assuming that the source of E-HNCHCN fills the GBT beam and that Tex = 8 K, a total column density of NT ≈ 1, 5 × 1013 cm−2 was determined, nearly identical to the upper limit found for C2H5CHNH. It is likely that C2H5CHNH would be lower in abundance than these previously detected imines so the upper limit found for C2H5CHNH, which is actually comparable with the abundances of the other detected species, suggests that higher sensitivity observations reaching a lower noise limit is necessary for detecting this species in absorption as it does not appear that any transitions of C2H5CHNH are excited by maser action, which would otherwise ease in facilitating the detection.
Measured frequencies of the E-propanimine and residuals from the fit.
Measured frequencies of the Z-propanimine and residuals from the fit.
Rotational, vibrational, and total partition functions of E- and Z-propanimine at various temperatures.
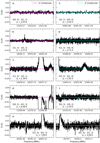 |
Fig. 3 Synthetic spectrum of C2H5CHNH. The E isomer transitions are presented in the first column in panels a–e (in magenta) and the Z isomer transitions are presented in the second column in panels ƒ–j (in cyan). The spectrum was generated from the physical conditions and observing parameters described in Sect. 4.1 (i.e., Tex = 5.8 K, source size of 20″, NT ~ 1.5 × 1013 cm−2 for the E isomer and NT ~ 1.0 × 1013 cm−2 for the Z isomer) overlaid on the GBT spectrum of Sgr B2(LMH) shown in black. Transition quantum numbers and upper state energy levels are at the bottom of each spectrum. No significant emission from C2H5CHNH transitions are detected beyond the 3σ upper limit. Panels g and j have an ordinate range between −0.1 and 0.1 K due to the noise level in the spectrum. |
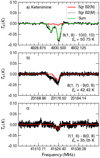 |
Fig. 4 Synthetic spectra of the P-branch (ΔJ = −1), c-type transitions of CH2CNH overlaid on the GBT spectrum of Sgr B2. Transition quantum numbers are at the bottom of each spectrum. The synthetic spectra for the Sgr B2(N) components (red curve) were generated from the physical conditions and observing parameters described in Sect. 4.1 (i.e., Tex = 5.8 K, source size= 20″, NT ~ 1.8 × 1016 cm−2). An additional contribution to the 4930 MHz absorption feature (gray curve) was modeled assuming the same Tex and source size as that of Sgr B2(N), a vLSR of +63 km s−1, dV of 17 km s−1, and NT of ~1.75 × 1017 cm−2. The sum of the synthetic absorption lines are shown by the green curve. |
4.2 Search for Propanimine and Related Species Toward Sgr B2(N1) with ALMA
4.2.1 ALMA Observations
We used the imaging spectral line survey ReMoCA carried out toward the high-mass star forming protocluster Sgr B2(N) with the Atacama Large Millimeter/submillimeter Array (ALMA) during its cycle 4. The details of the observations and data reduction were reported in Belloche et al. (2019). The main features of the survey are summarized here. The phase center is located at the equatorial position (α, δ)J2000 = (17h47m19.87, −28°22′16″.0), which is halfway between the two hot molecular cores Sgr B2(N1) and Sgr B2(N2). The survey used five frequency tunings to cover the frequency range from 84.1 to 114.4 GHz at a spectral resolution of 488 kHz (1.7−1.3 km s−1). The observations achieved a sensitivity per spectral channel that varies between 0.35 mJy beam−1 and 1.1 mJy beam−1 (rms), depending on the setup, with a median value of 0.8 mJy beam−1. The angular resolution (HPBW) ranges from ~0.3″ to ~0.8″ with a median value of 0.6″ that corresponds to ~4900 au at the distance of Sgr B2 (8.2 kpc, Reid et al. 2019). We used here an improved version of the data reduction, as described in Melosso et al. (2020a).
Following Belloche et al. (2019), we analyzed the spectrum obtained toward the position Sgr B2(N1S) at (α, δ)J2000 = (17h47m19s.870, −28°22′19″.48). The advantage of this position, which is offset by about 1″ to the south of the main hot core Sgr B2(N1), is its lower continuum opacity compared to the peak of the hot core. To analyze the spectrum, we produced synthetic spectra under the assumption of local thermodynamic equilibrium (LTE) with the astronomical software Weeds (Maret et al. 2011). This assumption is justified by the high densities of the regions where hot-core emission is detected in Sgr B2(N) (>1 × 107 cm−3, see Bonfand et al. 2019). A best-fit synthetic spectrum was derived for each molecule separately, and then the contributions of all identified molecules were added together. Each species was modeled with a set of five parameters: size of the emitting region (θs), column density (N), temperature (Trot), line width (∆V), and velocity offset (Voff) with respect to the assumed systemic velocity of the source, Vsys = 62 km s−1.
4.2.2 Nondetection of Propanimine
In order to search for propanimine, C2H5CHNH, toward Sgr B2(N1S), we relied on the LTE parameters derived for methanimine, CH2NH. The latter is clearly detected in its vibrational ground state (see Fig. B.1). We used the spectrocopic predictions of methanimine (tag 29518, version 2) available in the CDMS catalog (Müller et al. 2005), which are mainly based on the works of Krause & Sutter (1989), Dore et al. (2010, 2012), and Motoki et al. (2014). We selected the transitions of methanimine that are not too contaminated by emission or absorption from other species to build a population diagram (Fig. B.2). Despite the small number of transitions, a broad range of upper-level energy is covered and a rotational temperature of 220 ± 13 K could be derived (Table 5). This temperature is consistent with the temperature of 223 ± 6 K that we derived from the ReMoCA survey for methylamine CH3NH2 (Kisiel et al. 2022). This suggests that both species trace the same layer of the hot core. Like in Kisiel et al. (2022) for methylamine, we adopted a temperature of 230 K to compute the LTE synthetic spectra of methanimine shown in red in Fig. B.1. The LTE parameters derived for methanimine are reported in Table 6 along with those previously obtained for methylamine.
Figure B.1 shows a discrepancy between the LTE synthetic spectrum of methanimine and the observed spectrum for the hyperfine multiplet 40,4−31,3 at 105794 MHz with an upper level energy, Eup/k, of 31 K, while the hyperfine multiplet 81,7−72,6 at 109892 MHz with Eup/k = 128 K is well fitted. Given that extended emission in the former transition of methanimine was detected in Sgr B2 with the Mopra telescope (Jones et al. 2008) and that Halfen et al. (2013) obtained a low rotational temperature of 44 K for the emission of this molecule probed with the 10 m single-dish SubMillimeter Telescope and 12 m antenna of the Arizona Radio Observatory, we suspect that the transition detected with ALMA at this frequency is affected by spatial filtering of the cold extended component that may be somewhat optically thick and may partially mask the hot core emission at this frequency. This transition tends to bias the fit of the rotational temperature in Fig. B.2 toward lower values. This strengthens our choice of a slightly higher temperature of 230 K to model the spectrum of methanimine.
Assuming that the more complex molecule propanimine traces the same region as methanimine, we produced LTE synthetic spectra for the former species adopting the same parameters as for the latter with only the column density left as a free parameter. We employed the spectroscopic predictions derived for the E and Z stereoisomers of propanimine in Sect. 3. The LTE synthetic spectra of propanimine were used to search for emission of this molecule in the ReMoCA survey toward Sgr B2(N1S). Neither of its stereoisomers is detected, as illustrated in Figs. B.11 and B.12. The upper limits on their column densities, after accounting for the vibrational and conformational partition functions, are reported in Table 6.
To put the nondetection of propanimine toward Sgr B2(N1S) in a broader astrochemical context, we also report in Table 6 the column density upper limits that we obtained for four additional amines, ethylamine C2H5NH2 (Fig. B.3), vinylamine C2H3NH2 (Figs. B.4 and B.5), normal-propylamine C3H7NH2 (Fig. B.6), and its branched isomer iso-propylamine (Fig. B.7), as well as two other imines, ethanimine CH3CHNH (Figs. B.8 and B.9) and ketenimine CH2CNH (Fig. B.10). References of the spectroscopic works used to compute the LTE synthetic spectra of these species are given in Appendix B.
Table 6 indicates that propanimine is at least six times less abundant than methanimine in Sgr B2(N1S). The E and Z isomers of ethanimine, which has a degree of molecular complexity between these two molecules, are found to be at least six and ten times less abundant than methanimine, respectively. As it is unlikely that propanimine and ethanimine have similar column densities, this suggests that the upper limit derived for propan-imine is far from its true column density, maybe by as much as one order of magnitude. We note that the synthetic spectra of ethanimine shown in Figs. B.8 and B.9 may suggest the presence of this molecule in Sgr B2(N1S), but there are too few unblended transitions to claim a detection, even a tentative one. Loomis et al. (2013) detected ethanimine toward Sgr B2(N) on larger scales with a low excitation temperature of ~6 K (albeit with a complex mixture of lines in emission and absorption) in the frame of the PRIMOS survey2 with the GBT (see Sect. 4.1). The spectral confusion at the scales probed with the ReMoCA survey prevents us from detecting in a robust way the presence of ethanimine on smaller scales in the hot core.
Ethylamine C2H5NH2 and methylamine CH3NH2 share the same structural difference as ethanamine CH3CHNH and methanimine CH2NH (a CH2 group). Interestingly, we find similar lower limits for the abundance ratios CH3NH2/C2H5NH2 and CH2NH/CH3CHNH (5.4 and 5.8, respectively, if we take the E isomer of ethanimine as more representative). In contrast, the lower limits we obtain for the next stage in complexity is much more constraining for the imines (CH2NH/C2H5CHNH > 6) than for the amines (CH3NH2/C3H7NH2 > 1 for both the straight and branched forms of propylamine). Finally, we find that vinylamine C2H3NH2 is at least eight times less abundant than methylamine and ketenimine CH2CNH is at least 19 times less abundant than methanimine. We note, however, that the transition frequencies of vinylamine between the tunneling states are uncertain, with calculated uncertainties on the order of 3 MHz for the transitions shown in Fig. B.5; the true uncertainties could be even larger. Therefore, it could be useful to revisit the rotational spectrum of vinylamine, in particular the rotation-tunneling transitions between the states 0+ and 0−.
The lower limits to the ratios CH3NH2/C2H5NH2 and CH3NH2/C2H3NH2 obtained toward Sgr B2(N1S) (5.4 and 8, respectively) can be compared to the ratios obtained by Zeng et al. (2018, 2021) toward the nearby shocked region G+0.693− 0.027 (12 and 7, respectively, the former being only tentative). If their COM chemical composition is similar, despite the different physical processes that desorb the molecules from the grain surfaces in these two regions (thermal heating versus turbulent shocks), then we may be very close to a detection of vinylamine in Sgr B2(N1S), while the upper limit to the column density of ethylamine would still be at least twice as high as its actual column density. Finally, Zeng et al. (2018) derived a column density ratio CH2NH/CH3NH2 of 0.2, which is a factor three lower than the ratio we obtained for Sgr B1(N1S), suggesting differences in the chemistries of these two regions.
Rotational temperature of methanimine derived from its population diagram toward Sgr B2(N1S).
4.3 Searches in GOTHAM and ASAI Data
We also conducted searches toward the nine sources shown in Table 7 using data from the GOTHAM Project (GBT Observations of TMC-1: Hunting Aromatic Molecules) and the publicly available Astrochemical Surveys at IRAM (ASAI) Large Program data. The GOTHAM observations (McGuire et al. 2020) target the cyanopolyyne peak of the TMC-1 dark molecular cloud using the 100 m Robert C. Byrd Green Bank Telescope (GBT) and cover roughly 8–11.6 GHz and 18–29.5 GHz, with a few small gaps; the data used are from the DR2 reduction detailed in McGuire et al. (2021). The ASAI spectra cover spectra in the 2–3 mm wavelength region and include a range of source types from cold dark clouds (including TMC-1) to Class 0/1 protostars and shocked outflows, with observational details available in Lefloch et al. (2018).
Parameters of our best-fit LTE model of methylamine and methanimine toward Sgr B2(N1S), and upper limits for ethylamine, vinylamine, normal- and iso-propylamine, ethanimine, ketenimine, and propanimine.
Source parameters assumed and resulting upper limits for E-propanimine, Z-propanimine, and methanimine in each set of observations.
4.3.1 E- and Z-Propanimine
Searches for the E and Z stereoisomers of propanimine resulted in nondetections in all sources. We derived upper limits to the column density in each source using the MOLSIM software package (Lee et al. 2021) and the formalisms outlined in Turner (1991), which assume that the molecules are well described by a single excitation temperature and include corrections for optical depth. For each source, because these are nondetections, we had to make assumptions about the physical conditions used to derive the upper limits. The set of parameters given in Table 7 was chosen to be representative of typical molecular detections within each source (references given in the final column), and are those we commonly used for this data set in the past (see, e.g., Margulès et al. 2020a). In the case of NGC 1333 IRAS 4A (hereafter IRAS 4A), the values for the line width (ΔV) and excitation temperature (Tex) were set to those determined for methanimine (see below).
4.3.2 Methanimine
We also searched all of these sources for CH2NH, and found a solid detection in only one: IRAS 4A. Three lines, the 20,2−10,1, 40,4−30,3, and 41,3−31,2 at 127857, 254685, and 266270MHz, respectively, were seen above the noise level. A rotation diagram (Fig. 5) for these lines results in derived values of  K and
K and  . The observed emission features from the ASAI data, as well as a simulation of the CH2NH emission using the derived parameters, is shown in Fig. 6. The simulations agree with the observations within ~3σ. It is also possible that the source does not completely fill the beam, and thus some of the disagreement may be due to the substantially larger beam at 128 GHz versus near 260 GHz. For all other sources, 3σ upper limits are provided alongside those for E- and Z-propanimine in Table 7. We note that in the spectra for both L1157B1 and L1157mm there are features suggestive of methanimine emission just below the 3σ noise level for several of the brightest transitions, suggesting a deeper integration would likely result in a robust detection.
5 Discussion
We studied the rotational spectra of both stereoisomers (E and Z) of propanimine (C2H5CHNH). We analyzed some transitions with different selection rules up to high quantum numbers. The line catalog obtained from this analysis is very accurate up to at least 600 GHz. Only the ground vibrational state was investigated here. Because both isomers exhibit one low-lying vibrational mode below 100 cm−1 (143 K), these vibrational states should certainly be studied in the future if there is a detection of propanimine in the ISM.
We are currently working on analyzing the rotational spectra of ethanimine (CH3CHNH). Previous studies of this molecule (Lovas et al. 1980; Loomis et al. 2013; Melli et al. 2018) did not provide a secure prediction in the same range as propanimine up to 600 GHz. An accurate catalog could be generated only up to 150 GHz, and was limited to low Ka values (0 and 1) up to 300 GHz. We recorded the spectra up to 650 GHz; the analysis is in progress. Unlike for propanimine, the internal rotation of the methyl group of ethanimine must be treated because it produces observable splittings. In addition to this, the hyperfine structure is also observable. Finally, there is a Coriolis interaction between torsionally and vibrationally excited states. V.V. Ilyushin (Institut of Radio Astronomy, Kharkiv, Ukraine) is currently developing the code in order to handle this interaction.
Our search for propanimine in several interstellar sources using various radio and millimeter wavelength astronomical surveys was unfortunately not successful. Propanimine is not detected in Sgr B2(N1), the main hot core of Sgr B2(N), with ALMA (Sect. 4.2) or on larger scales around this hot core with the GBT (Sect. 4.1). The GBT upper limit to the abundance ratio of propanimine to methanimine on large scales around Sgr B2(N) is 0.04, four times more constraining than the upper limit obtained for the hot core with ALMA (0.17). This upper limit is comparable to the upper limit obtained with ALMA for the abundance ratio of ethanimine to methanimine (0.18, see Sect. 4.2). Ethanimine was detected with the GBT with an abundance of 0.07–0.2 with respect to methanimine (Sect. 4.1), a range that brackets the ALMA upper limit, and we actually reported in Sect. 4.2 hints of the presence of ethanimine in the ALMA spectra. Taken together, this suggests that ethanimine may well be present in the hot core at a similar level, with respect to methanimine, to that in the surrounding envelope. This could suggest that the formation of both imines occurs early on in the star formation process.
This similarity in the imine chemistry of the two environments may also suggest that the ALMA upper limit for propan-imine toward Sgr B2(N1) is more than a factor of four away from a detection. Given that the ReMoCA survey has nearly reached the spectral confusion limit on this hot core, there is little hope that propanimine can be detected in the future at 3 mm toward this source, unless even higher angular resolution observations manage to probe smaller regions with even narrower line widths. In addition, as stated in Sect. 4.1, given the scarcity of spectral features at centimeter wavelengths, and the overall sensitivity achievable at those wavelengths, it may be possible to detect propanimine in absorption with longer integration times on the GBT.
For the ASAI and GOTHAM samples of sources, most upper limits derived for the E -propanimine are higher than or similar to the upper limits obtained for methanimine. Given that we expect a priori propanimine to be much less abundant than methanimine, this indicates that much more sensitive observations would be required to continue the search for both imines toward these sources. For the only source with a methanimine detection, IRAS 4A, the upper limit obtained for propanimine is more than one order of magnitude higher than the column density of methanimine, which means that an improvement by much more than one order of magnitude in sensitivity would be required to continue the search for propanimine.
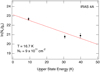 |
Fig. 5 Rotation diagram for CH2NH in the ASAI data toward IRAS 4A. The error bars are derived from the statistical uncertainties in the Gaussian fits to the line shape of the emission features for each transition. |
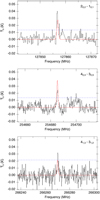 |
Fig. 6 Detected lines of CH2NH toward IRAS 4A. The ASAI spectra are shown in black, while a single-excitation temperature simulation of the CH2NH emission using the derived parameters is overlaid in red. Each panel is ~70 km s−1 in width. The 3σ local noise level is shown as a dashed blue line in each panel. |
6 Conclusion
Millimeter and submillimeter wave spectra of the E and Z stereoisomers of propanimine were assigned up to 470 GHz. This has permitted us to produce accurate predictions of the spectra of both isomers and made possible a search for this molecule in the ISM. Unfortunately, only nondetections could be reported in this work toward a sample of star forming regions targeted with various radio astronomical surveys. The most stringent constraint was obtained for the envelope of Sgr B2(N) where propan-imine is at least 20 times less abundant than methanimine. The spectroscopic predictions are now available to the astrophysical community, enabling future searches for propanimine as more sensitive surveys become available.
Acknowledgements
This work was supported by the Programme National “Physique et Chimie du Milieu Interstellaire” (PCMI) of CNRS/INSU with INC/INP co-funded by CEA and CNES. J.C.G. thanks the Centre National d’Etudes Spatiales (CNES) for a grant. This paper makes use of the following ALMA data: ADS/JAO.ALMA#2016.1.00074.S. ALMA is a partnership of ESO (representing its member states), NSF (USA), and NINS (Japan), together with NRC (Canada), NSC and ASIAA (Taiwan), and KASI (Republic of Korea), in cooperation with the Republic of Chile. The Joint ALMA Observatory is operated by ESO, AUI/NRAO, and NAOJ. The interferometric data are available in the ALMA archive at https://almascience.eso.org/aq/. Part of this work has been carried out within the Collaborative Research Centre 956, subproject B3, funded by the Deutsche Forschungsgemeinschaft (DFG) – project ID 184018867. A.B. thanks M. Melosso for providing spectroscopic predictions of propylamine and ethanimine in electronic format. RTG acknowledges support from the National Science Foundation (grant No. AST 19-06489).
Appendix A Vibrational modes of propanimine
Harmonic vibrational frequencies of the E and Z -propanimine determined at the B3LYP/6-311++G(3df,2pd) level of theory and basis set.
Table A.1 provides the harmonic vibrational frequencies of both isomers of propanimine.
Appendix B Complementary figures: Spectra and population diagram of Sgr B2(N1S)
Figure B.1 shows the transitions of methanimine CH2NH, ν=0 that are covered by the ReMoCA survey and contribute significantly to the signal detected toward Sgr B2(N1S). Figure B.2 shows the population diagram of CH2NH forSgrB2(N1S). Figure B.3 illustrates the nondetection of the anti conformer of ethylamine C2H5NH2; Figs. B.4 and B.5 the nondetection of vinylamine C2H3NH3; Fig. B.6 the nondetection of the Transtrans conformer of n-propylamine C3H7NH2; Fig. B.7 the non-detection of the trans conformer of iso-propylamine i-C3H7NH2; Figs. B.8 and B.9 the nondetection of the E and Z isomers of ethanimine CH3CHNH, respectively; Fig. B.10 the nondetection of ketenimine CH2CNH; and Figs. B.11 and B.12 the nondetection of the E and Z-propanimine C2H5CHNH, respectively. All these figures refer to Sgr B2(N1S).
To compute the LTE synthetic spectrum of the anti conformer of ethylamine, we used the CDMS entry (tag 45515, version 1) that is based on the works by Fischer & Botskor (1982) and Apponi et al. (2008). For vinylamine we used the CDMS entries (tags 43504 version 2 and 43508 version 1) that are mainly based on the works by Brown et al. (1990) and Mcnaughton & Robertson (1994). For the Trans-trans conformer of n-propylamine and the trans conformer of iso-propylamine we used the spectroscopic work of Melosso et al. (2020b). For the E and Z isomers of ethanimine we used the spectroscopic work of Melli et al. (2018). For ketenimine we used the CDMS entry (tag 41503 version 2) that is based on the works by Rodler et al. (1984, 1986) and Degli Esposti et al. (2014).
 |
Fig. B.1 Transitions of methanimine CH2NH, ν = 0 covered by the ReMoCA survey. The best-fit LTE synthetic spectrum of CH2NH, ν = 0 is displayed in red and overlaid on the observed spectrum of Sgr B2(N1S) shown in black. The blue synthetic spectrum contains the contributions of all molecules identified in our survey so far, including the species shown in red. The central frequency is indicated (in MHz) below each panel, the half-power beam width is on the left, the width of each panel (in MHz) is in parentheses, and the continuum level of the baseline-subtracted spectra in K is in brackets. The y-axis is labeled in brightness temperature units (K). The dotted line indicates the 3σ noise level. |
 |
Fig. B.2 Population diagram of methanimine CH2NH toward Sgr B2(N1S). The observed data points are shown in black, while the synthetic populations are shown in red. No correction is applied in panel a. In panel b the optical depth correction has been applied to both the observed and synthetic populations and the contamination by all other species included in the full model has been removed from the observed data points. The purple line is a linear fit to the observed populations (in linear-logarithmic space). The rotational temperature derived from this fit is reported in Table 5. |
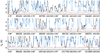 |
Fig. B.3 Same as Fig. B.1, but the red spectrum shows the synthetic spectrum of ethanamine anti-C2H5NH2, v=0 used to derive the upper limit on its column density reported in Table 6. The blue spectrum does not contain the contribution of the species shown in red. |
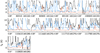 |
Fig. B.4 Same as Fig. B.3, but for transitions of vinylamine C2H3NH2 within the tunneling states 0+ and 0−. |
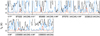 |
Fig. B.5 Same as Fig. B.3, but for transitions of vinylamine C2H3NH2 between the tunneling states 0− and 0+. |
References
- Agúndez, M., Cernicharo, J., De Vicente, P., et al. 2015, A&A, 579, L10 [NASA ADS] [CrossRef] [EDP Sciences] [Google Scholar]
- Anderson, J., & Ziurys, L. M. 2014, ApJ, 795, L1 [NASA ADS] [CrossRef] [Google Scholar]
- Apponi, A. J., Sun, M., Halfen, D. T., Ziurys, L. M., & Müller, H. S. P. 2008, ApJ, 673, 1240 [NASA ADS] [CrossRef] [Google Scholar]
- Araki, M., Takano, S., Sakai, N., et al. 2017, ApJ, 847, 0 [Google Scholar]
- Belloche, A., Müller, H. S. P., Garrod, R. T., & Menten, K. M. 2016, A&A, 587, A91 [NASA ADS] [CrossRef] [EDP Sciences] [Google Scholar]
- Belloche, A., Garrod, R. T., Müller, H. S. P., et al. 2019, A&A, 628, A10 [NASA ADS] [CrossRef] [EDP Sciences] [Google Scholar]
- Bizzocchi, L., Prudenzano, D., Rivilla, V. M., et al. 2020, A&A, 640, A98 [EDP Sciences] [Google Scholar]
- Bonfand, M., Belloche, A., Garrod, R. T., et al. 2019, A&A, 628, A27 [NASA ADS] [CrossRef] [EDP Sciences] [Google Scholar]
- Bossa, J., Theule, P., Duvernay, F., & Chiavassa, T. 2009, ApJ, 707, 1524 [Google Scholar]
- Bossa, J.-B., Borget, F., Duvernay, F., et al. 2012, Australian J. Chem., 65, 129 [CrossRef] [Google Scholar]
- Brown, R. D., Godfrey, P. D., Kleibomer, B., Pierlot, A. P., & McNaughton, D. 1990, J. Mol. Spectr., 142, 195 [NASA ADS] [CrossRef] [Google Scholar]
- Cernicharo, J., Kisiel, Z., Tercero, B., et al. 2016, A&A, 587, L4 [NASA ADS] [CrossRef] [EDP Sciences] [Google Scholar]
- Cernicharo, J., Lefloch, B., Agúndez, M., et al. 2018, ApJ, 853, L22 [CrossRef] [Google Scholar]
- Crapsi, A., Caselli, P., Walmsley, C. M., et al. 2005, ApJ, 619, 379 [Google Scholar]
- Degli Esposti, C., Dore, L., & Bizzocchi, L. 2014, A&A, 565, A66 [NASA ADS] [CrossRef] [EDP Sciences] [Google Scholar]
- Dore, L., Bizzocchi, L., Degli Esposti, C., & Gauss, J. 2010, J. Mol. Spectr., 263, 44 [NASA ADS] [CrossRef] [Google Scholar]
- Dore, L., Bizzocchi, L., & Degli Esposti, C. 2012, A&A, 544, A19 [NASA ADS] [CrossRef] [EDP Sciences] [Google Scholar]
- Faure, A., Remijan, A. J., Szalewicz, K., & Wiesenfeld, L. 2014, ApJ, 783, 72 [CrossRef] [Google Scholar]
- Faure, A., Lique, F., & Remijan, A. J. 2018, J. Phys. Chem. Lett., 9, 3199 [NASA ADS] [CrossRef] [Google Scholar]
- Fischer, E., & Botskor, I. 1982, J. Mol. Spectr., 91, 116 [NASA ADS] [CrossRef] [Google Scholar]
- Frisch, M., Trucks, G., Schlegel, H. B., et al. 2009, Gaussian, Inc., Wallingford, CT, 200 [Google Scholar]
- Godfrey, P., Brown, R., Robinson, B., & Sinclair, M. 1973, ApJ, 13, 119 [Google Scholar]
- Gordy, W., & Cook, R. L. 1984, Microwave Molecular Spectra, 3rd edn. (New York: Wiley) [Google Scholar]
- Gratier, P., Majumdar, L., Ohishi, M., et al. 2016, ApJS, 225, 25 [Google Scholar]
- Guélin, M., & Cernicharo, J. 1991, A&A, 244, L21 [NASA ADS] [Google Scholar]
- Guillemin, J.-C., & Denis, J.-M. 1988, Tetrahedron, 44, 4431 [CrossRef] [Google Scholar]
- Halfen, D. T., Ilyushin, V. V., & Ziurys, L. M. 2013, ApJ, 767, 66 [NASA ADS] [CrossRef] [Google Scholar]
- Higuchi, A. E., Sakai, N., Watanabe, Y., et al. 2018, ApJ, 236, 0 [Google Scholar]
- Hily-Blant, P., Faure, A., Vastel, C., et al. 2018, MNRAS, 480, 1174 [NASA ADS] [CrossRef] [Google Scholar]
- Hollis, J. M., Jewell, P. R., Remijan, A. J., & Lovas, F. J. 2007, ApJ, 660, L125 [NASA ADS] [CrossRef] [Google Scholar]
- Jones, P. A., Burton, M. G., Cunningham, M. R., et al. 2008, MNRAS, 386, 117 [Google Scholar]
- Jørgensen, J. K., Schöier, F. L., & van Dishoeck, E. F. 2002, A&A, 389, 908 [CrossRef] [EDP Sciences] [Google Scholar]
- Kawaguchi, K., Takano, S., Ohishi, M., et al. 1992, ApJ, 396, L49 [CrossRef] [Google Scholar]
- Kisiel, Z. 2001, in Spectroscopy from Space (Berlin: Springer), 91 [Google Scholar]
- Kisiel, Z., Kolesniková, L., Belloche, A., et al. 2022, A&A, 657, A99 [NASA ADS] [CrossRef] [EDP Sciences] [Google Scholar]
- Krause, H., & Sutter, D. H. 1989, Zeitschrift Naturforschung Teil A, 44, 1063 [NASA ADS] [CrossRef] [Google Scholar]
- Lee, K. L. K., Loomis, R. A., Xue, C., El-Abd, S., & McGuire, B. A. 2021, https://doi.org/1S.5281/zenodo.5497790 [Google Scholar]
- Lefloch, B., Bachiller, R., Ceccarelli, C., et al. 2018, MNRAS, 477, 4792 [Google Scholar]
- Loomis, R. A., Zaleski, D. P., Steber, A. L., et al. 2013, ApJ, 765, L9 [Google Scholar]
- Lovas, F. J., Suenram, R. D., Johnson, D. R., Clark, F. O., & Tiemann, E. 1980, J. Chem. Phys., 72, 4964 [NASA ADS] [CrossRef] [Google Scholar]
- Lovas, F. J., Hollis, J. M., Remijan, A. J., & Jewell, P. R. 2006, ApJ, 645, L137 [NASA ADS] [CrossRef] [Google Scholar]
- Lupi, J., Puzzarini, C., & Barone, V. 2020, ApJ, 903, L35 [NASA ADS] [CrossRef] [Google Scholar]
- Mangum, J. G., & Shirley, Y. L. 2015, PASP, 127, 266 [Google Scholar]
- Maret, S., Hily-Blant, P., Pety, J., Bardeau, S., & Reynier, E. 2011, A&A, 526, A47 [NASA ADS] [CrossRef] [EDP Sciences] [Google Scholar]
- Margulès, L., Ilyushin, V., McGuire, B. A., et al. 2020a, J. Mol. Spectr., 371, 111304 [CrossRef] [Google Scholar]
- Margulès, L., Motiyenko, R. A., & Demaison, J. 2020b, J. Quant. Spectr. Rad. Transf., 253, 107153 [Google Scholar]
- Margulès, L., McGuire, B. A., Evans, C. J., et al. 2020c, A&A, 642, A206 [EDP Sciences] [Google Scholar]
- McGuire, B. A., Loomis, R. A., Charness, C. M., et al. 2012, ApJ, 758, L33 [NASA ADS] [CrossRef] [Google Scholar]
- McGuire, B. A., Carroll, P. B., Dollhopf, N. M., et al. 2015, ApJ, 812, 1 [Google Scholar]
- McGuire, B. A., Burkhardt, A. M., Kalenskii, S. V., et al. 2018, Science, 359, 202 [NASA ADS] [CrossRef] [Google Scholar]
- McGuire, B. A., Burkhardt, A. M., Loomis, R. A., et al. 2020, ApJ, 900, L10 [Google Scholar]
- McGuire, B. A., Loomis, R. A., Burkhardt, A. M., et al. 2021, Science, 371, 1265 [Google Scholar]
- Mcnaughton, D., & Robertson, E. G. 1994, J. Mol. Spectr., 163, 80 [NASA ADS] [CrossRef] [Google Scholar]
- Melli, A., Melosso, M., Tasinato, N., et al. 2018, ApJ, 855, 123 [NASA ADS] [CrossRef] [Google Scholar]
- Melosso, M., Melli, A., Puzzarini, C., et al. 2018, A&A, 609, A121 [NASA ADS] [CrossRef] [EDP Sciences] [Google Scholar]
- Melosso, M., Belloche, A., Martin-Drumel, M. A., et al. 2020a, A&A, 641, A160 [NASA ADS] [CrossRef] [EDP Sciences] [Google Scholar]
- Melosso, M., Melli, A., Spada, L., et al. 2020b, J. Phys. Chem. A, 124, 1372 [NASA ADS] [CrossRef] [Google Scholar]
- Motoki, Y., Isobe, F., Ozeki, H., & Kobayashi, K. 2014, A&A, 566, A28 [NASA ADS] [CrossRef] [EDP Sciences] [Google Scholar]
- Müller, H. S. P., Schlöder, F., Stutzki, J., & Winnewisser, G. 2005, J. Mol. Struct., 742, 215 [Google Scholar]
- Nguyen, T., Fourré, I., Favre, C., et al. 2019, A&A, 628, A15 [NASA ADS] [CrossRef] [EDP Sciences] [Google Scholar]
- Ohishi, M., McGonagle, D., Irvine, W. M., Yamamoto, S., & Saito, S. 1994, ApJ, 427, L51 [NASA ADS] [CrossRef] [Google Scholar]
- Pickett, H. M. 1991, J. Mol. Spectr., 148, 371 [Google Scholar]
- Reid, M. J., Menten, K. M., Brunthaler, A., et al. 2019, ApJ, 885, 131 [Google Scholar]
- Remijan, A., Xue, C., Margulès, L., et al. 2022, A&A, 658, A85 [NASA ADS] [CrossRef] [EDP Sciences] [Google Scholar]
- Rivilla, V., Martín-Pintado, J., Jiménez-Serra, I., et al. 2019, MNRAS, 483, L114 [Google Scholar]
- Rodler, M., Brown, R. D., Godfrey, P. D., & Tack, L. M. 1984, Chem. Phys. Lett., 110, 447 [Google Scholar]
- Rodler, M., Brown, R. D., Godfrey, P. D., & Kleibömer, B. 1986, J. Mol. Spectr., 118, 267 [NASA ADS] [CrossRef] [Google Scholar]
- Rodríguez-Almeida, L., Rivilla, V., Jiménez-Serra, I., et al. 2021, A&A, 654, L1 [NASA ADS] [CrossRef] [EDP Sciences] [Google Scholar]
- Snyder, L. E., & Buhl, D. 1972, ApJ, 177, 619 [Google Scholar]
- Theulé, P., Borget, F., Mispelaer, F., et al. 2011, A&A, 534, A64 [Google Scholar]
- Turner, B. E. 1991, ApJS, 76, 617 [NASA ADS] [CrossRef] [Google Scholar]
- Vinogradoff, V., Rimola, A., Duvernay, F., et al. 2012, Phys. Chem. Chem. Phys., 14, 12309 [NASA ADS] [CrossRef] [Google Scholar]
- Zakharenko, O., Motiyenko, R. A., Margulès, L., & Huet, T. R. 2015, J. Mol. Spectr., 317, 41 [Google Scholar]
- Zaleski, D. P., Seifert, N. A., Steber, A. L., et al. 2013, ApJ, 765, L10 [Google Scholar]
- Zeng, S., Jiménez-Serra, I., Rivilla, V. M., et al. 2018, MNRAS, 478, 2962 [Google Scholar]
- Zeng, S., Jiménez-Serra, I., Rivilla, V. M., et al. 2021, ApJ, 920, L27 [NASA ADS] [CrossRef] [Google Scholar]
Access to the entire PRIMOS data set, specifics of the observing strategy, and overall frequency coverage information is available at http://archive.nrao.edu by searching for GBT Program ID: AGBT07A_051.
All Tables
Rotational, vibrational, and total partition functions of E- and Z-propanimine at various temperatures.
Rotational temperature of methanimine derived from its population diagram toward Sgr B2(N1S).
Parameters of our best-fit LTE model of methylamine and methanimine toward Sgr B2(N1S), and upper limits for ethylamine, vinylamine, normal- and iso-propylamine, ethanimine, ketenimine, and propanimine.
Source parameters assumed and resulting upper limits for E-propanimine, Z-propanimine, and methanimine in each set of observations.
Harmonic vibrational frequencies of the E and Z -propanimine determined at the B3LYP/6-311++G(3df,2pd) level of theory and basis set.
All Figures
|
Fig. 1 E and Z stereoisomers of propanimine. Isomer E, which is more stable than isomer Z, was calculated to be 3.16 kJ mol−1 lower in energy (zero-point correction included) via the B3LYP/6-311++g(3df,2pd) procedure using the Gaussian 09 suite of programs (Frisch et al. 2009). |
| In the text | |
|
Fig. 2 Comparison of the experimental spectrum recorded at room temperature and the theoretical spectrum between 167.4 and 170.0 GHz. Top: simulated spectrum at 300 K for both isomers of propanimine. Middle: part of the experimental spectrum. Bottom: predictions for isomers E (in red) and Z (in blue). |
| In the text | |
|
Fig. 3 Synthetic spectrum of C2H5CHNH. The E isomer transitions are presented in the first column in panels a–e (in magenta) and the Z isomer transitions are presented in the second column in panels ƒ–j (in cyan). The spectrum was generated from the physical conditions and observing parameters described in Sect. 4.1 (i.e., Tex = 5.8 K, source size of 20″, NT ~ 1.5 × 1013 cm−2 for the E isomer and NT ~ 1.0 × 1013 cm−2 for the Z isomer) overlaid on the GBT spectrum of Sgr B2(LMH) shown in black. Transition quantum numbers and upper state energy levels are at the bottom of each spectrum. No significant emission from C2H5CHNH transitions are detected beyond the 3σ upper limit. Panels g and j have an ordinate range between −0.1 and 0.1 K due to the noise level in the spectrum. |
| In the text | |
|
Fig. 4 Synthetic spectra of the P-branch (ΔJ = −1), c-type transitions of CH2CNH overlaid on the GBT spectrum of Sgr B2. Transition quantum numbers are at the bottom of each spectrum. The synthetic spectra for the Sgr B2(N) components (red curve) were generated from the physical conditions and observing parameters described in Sect. 4.1 (i.e., Tex = 5.8 K, source size= 20″, NT ~ 1.8 × 1016 cm−2). An additional contribution to the 4930 MHz absorption feature (gray curve) was modeled assuming the same Tex and source size as that of Sgr B2(N), a vLSR of +63 km s−1, dV of 17 km s−1, and NT of ~1.75 × 1017 cm−2. The sum of the synthetic absorption lines are shown by the green curve. |
| In the text | |
|
Fig. 5 Rotation diagram for CH2NH in the ASAI data toward IRAS 4A. The error bars are derived from the statistical uncertainties in the Gaussian fits to the line shape of the emission features for each transition. |
| In the text | |
|
Fig. 6 Detected lines of CH2NH toward IRAS 4A. The ASAI spectra are shown in black, while a single-excitation temperature simulation of the CH2NH emission using the derived parameters is overlaid in red. Each panel is ~70 km s−1 in width. The 3σ local noise level is shown as a dashed blue line in each panel. |
| In the text | |
|
Fig. B.1 Transitions of methanimine CH2NH, ν = 0 covered by the ReMoCA survey. The best-fit LTE synthetic spectrum of CH2NH, ν = 0 is displayed in red and overlaid on the observed spectrum of Sgr B2(N1S) shown in black. The blue synthetic spectrum contains the contributions of all molecules identified in our survey so far, including the species shown in red. The central frequency is indicated (in MHz) below each panel, the half-power beam width is on the left, the width of each panel (in MHz) is in parentheses, and the continuum level of the baseline-subtracted spectra in K is in brackets. The y-axis is labeled in brightness temperature units (K). The dotted line indicates the 3σ noise level. |
| In the text | |
|
Fig. B.2 Population diagram of methanimine CH2NH toward Sgr B2(N1S). The observed data points are shown in black, while the synthetic populations are shown in red. No correction is applied in panel a. In panel b the optical depth correction has been applied to both the observed and synthetic populations and the contamination by all other species included in the full model has been removed from the observed data points. The purple line is a linear fit to the observed populations (in linear-logarithmic space). The rotational temperature derived from this fit is reported in Table 5. |
| In the text | |
|
Fig. B.3 Same as Fig. B.1, but the red spectrum shows the synthetic spectrum of ethanamine anti-C2H5NH2, v=0 used to derive the upper limit on its column density reported in Table 6. The blue spectrum does not contain the contribution of the species shown in red. |
| In the text | |
|
Fig. B.4 Same as Fig. B.3, but for transitions of vinylamine C2H3NH2 within the tunneling states 0+ and 0−. |
| In the text | |
|
Fig. B.5 Same as Fig. B.3, but for transitions of vinylamine C2H3NH2 between the tunneling states 0− and 0+. |
| In the text | |
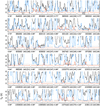 |
Fig. B.6 Same as Fig. B.3, but for n-propylamine Trans-trans-n-C3H7NH2, v=0. |
| In the text | |
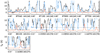 |
Fig. B.7 Same as Fig. B.3, but for iso-propylamine trans-i-C3H7NH2, v=0. |
| In the text | |
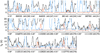 |
Fig. B.8 Same as Fig. B.3, but for ethanimine E-CH3CHNH, v=0. |
| In the text | |
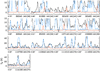 |
Fig. B.9 Same as Fig. B.3, but for ethanimine Z-CH3CHNH, v=0. |
| In the text | |
 |
Fig. B.10 Same as Fig. B.3, but for ketenimine CH2CNH, v=0. |
| In the text | |
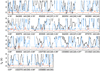 |
Fig. B.11 Same as Fig. B.3, but for propanimine E-C2H5CHNH, v=0. |
| In the text | |
 |
Fig. B.12 Same as Fig. B.3, but for propanimine Z-C2H5CHNH, v=0. |
| In the text | |
Current usage metrics show cumulative count of Article Views (full-text article views including HTML views, PDF and ePub downloads, according to the available data) and Abstracts Views on Vision4Press platform.
Data correspond to usage on the plateform after 2015. The current usage metrics is available 48-96 hours after online publication and is updated daily on week days.
Initial download of the metrics may take a while.