Fig. 4
Download original image
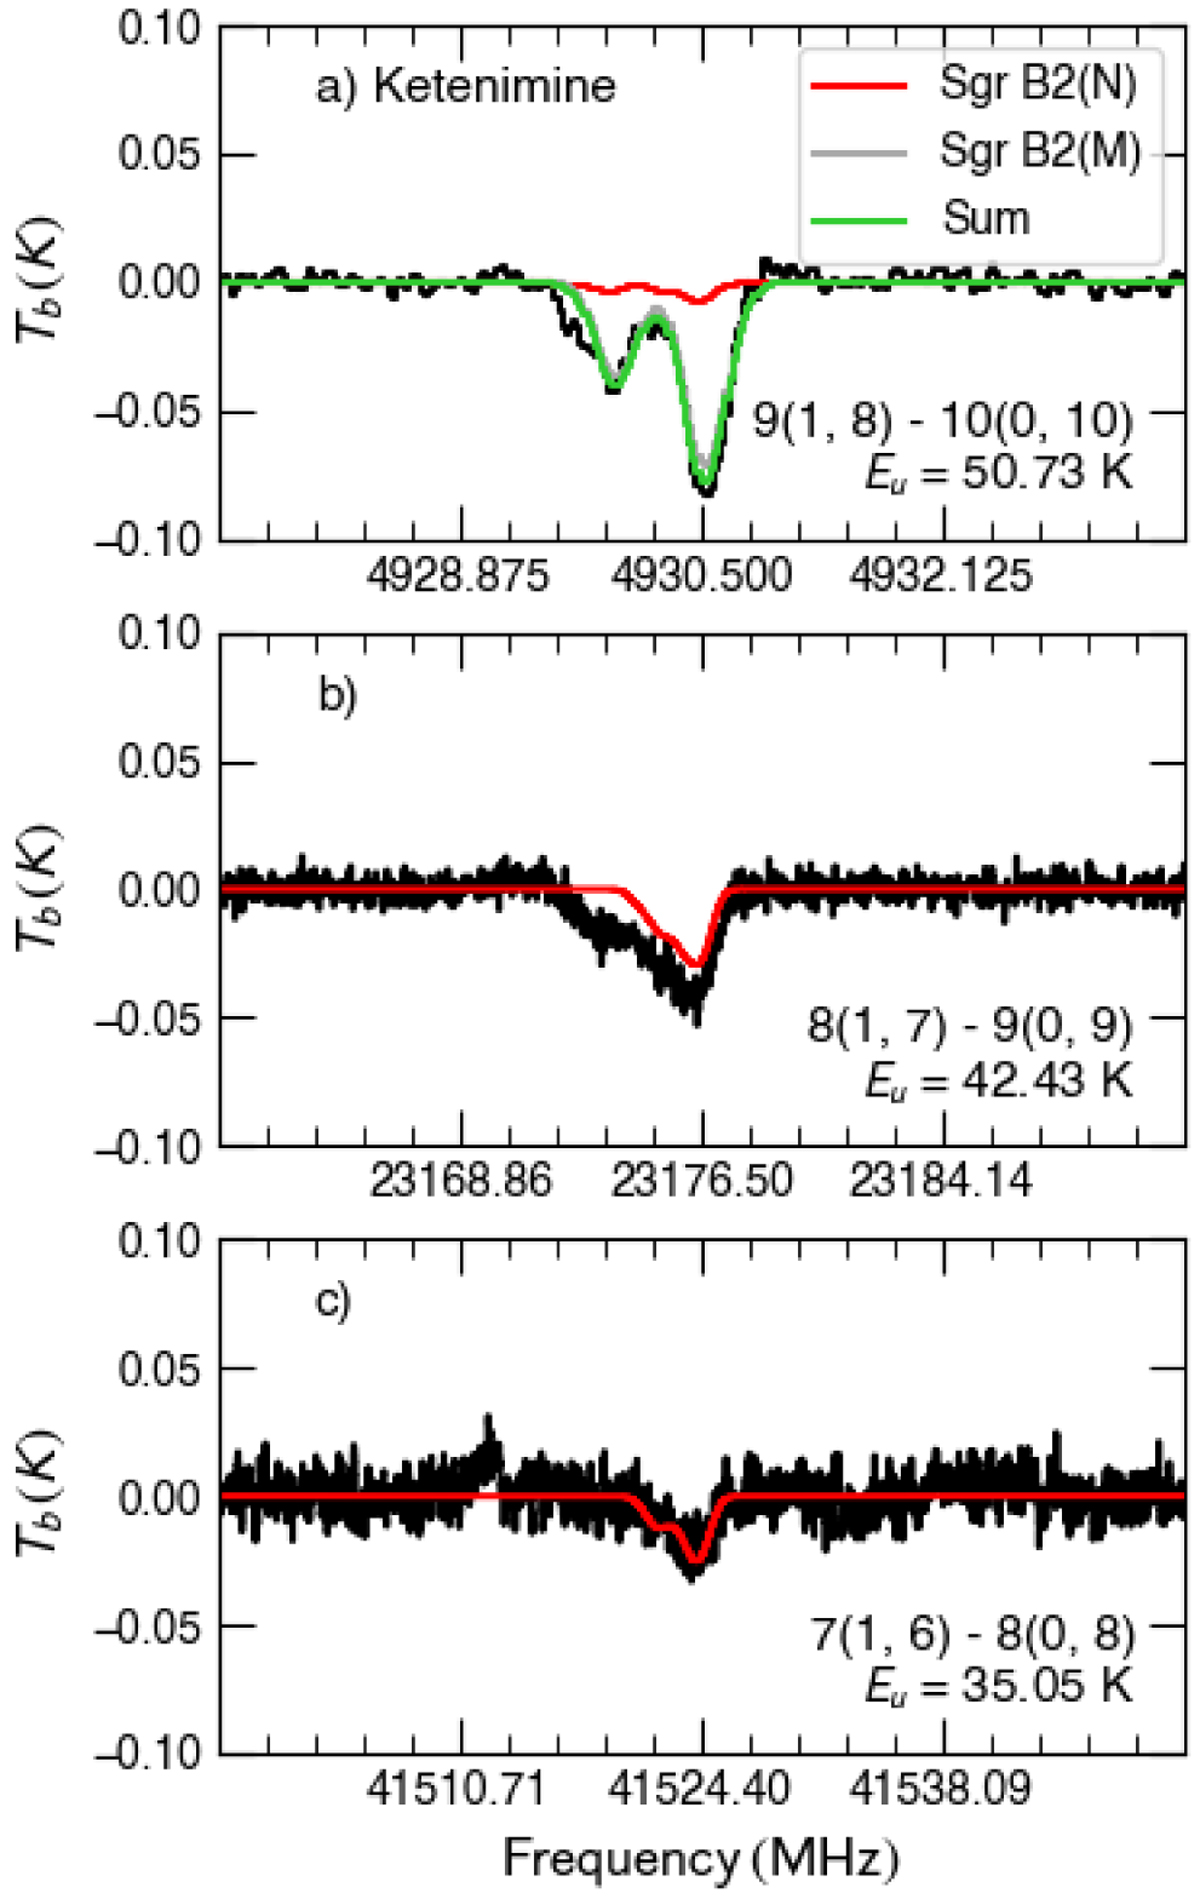
Synthetic spectra of the P-branch (ΔJ = −1), c-type transitions of CH2CNH overlaid on the GBT spectrum of Sgr B2. Transition quantum numbers are at the bottom of each spectrum. The synthetic spectra for the Sgr B2(N) components (red curve) were generated from the physical conditions and observing parameters described in Sect. 4.1 (i.e., Tex = 5.8 K, source size= 20″, NT ~ 1.8 × 1016 cm−2). An additional contribution to the 4930 MHz absorption feature (gray curve) was modeled assuming the same Tex and source size as that of Sgr B2(N), a vLSR of +63 km s−1, dV of 17 km s−1, and NT of ~1.75 × 1017 cm−2. The sum of the synthetic absorption lines are shown by the green curve.
Current usage metrics show cumulative count of Article Views (full-text article views including HTML views, PDF and ePub downloads, according to the available data) and Abstracts Views on Vision4Press platform.
Data correspond to usage on the plateform after 2015. The current usage metrics is available 48-96 hours after online publication and is updated daily on week days.
Initial download of the metrics may take a while.