Open Access
Fig. 2
Download original image
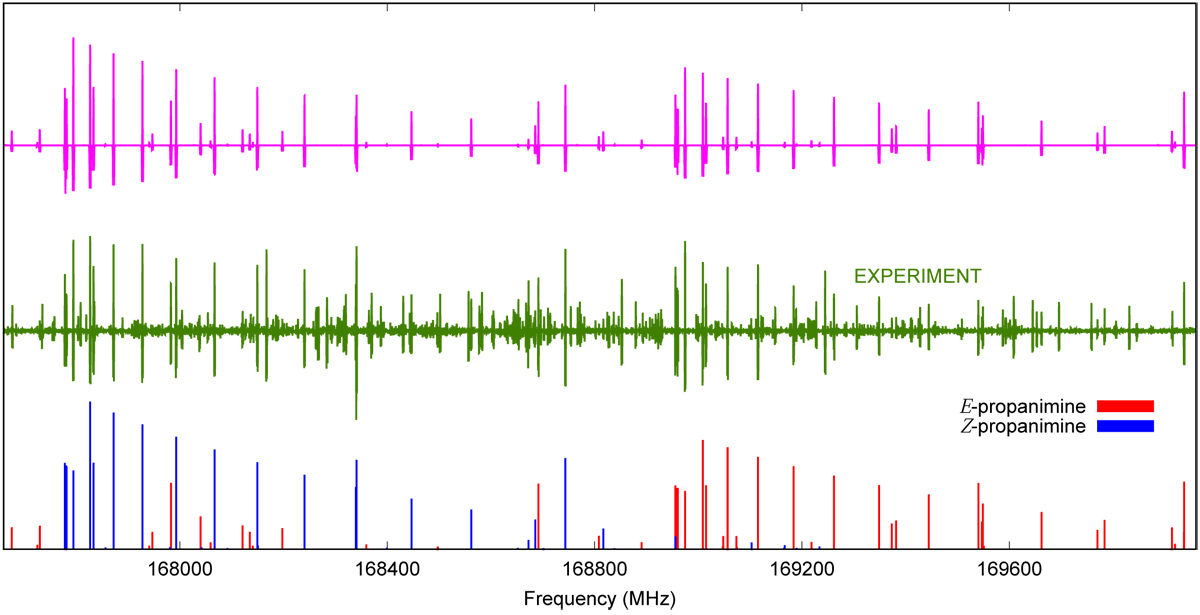
Comparison of the experimental spectrum recorded at room temperature and the theoretical spectrum between 167.4 and 170.0 GHz. Top: simulated spectrum at 300 K for both isomers of propanimine. Middle: part of the experimental spectrum. Bottom: predictions for isomers E (in red) and Z (in blue).
Current usage metrics show cumulative count of Article Views (full-text article views including HTML views, PDF and ePub downloads, according to the available data) and Abstracts Views on Vision4Press platform.
Data correspond to usage on the plateform after 2015. The current usage metrics is available 48-96 hours after online publication and is updated daily on week days.
Initial download of the metrics may take a while.