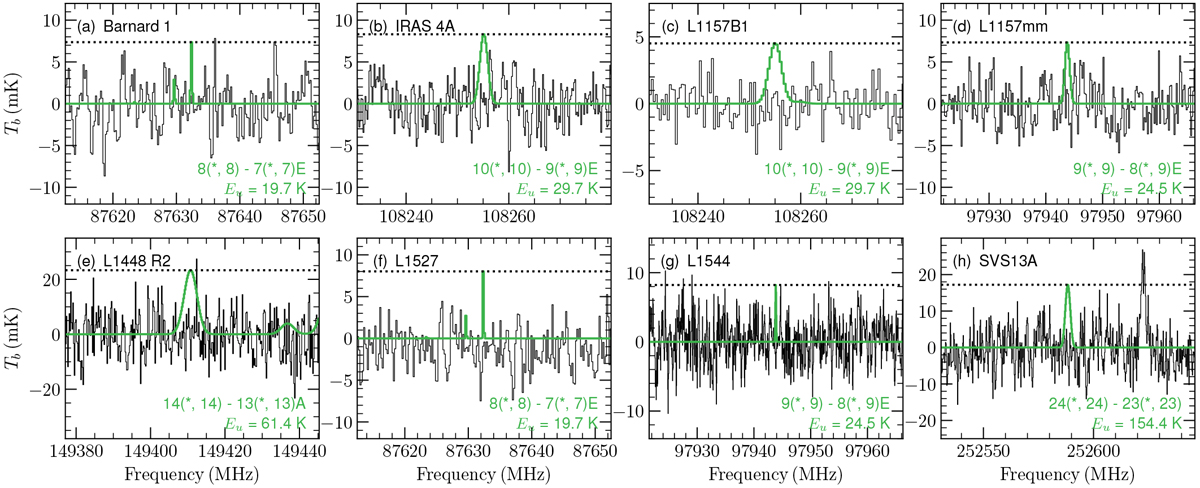
Fig. 7
Download original image
Transitions of CH3CONH2 used to calculate the 3σ upper limits given in Table 9. In each panel, the green trace shows the transition simulated using the derived upper limit column density and the physical parameters assumed for that source. The dotted line in each panel indicates the 3σ noise level. The quantum numbers and upper-level energies for each transition is shown in the lower right of each panel. The source name is given in the upper left of each panel. Due to the large variances between observations, the intensity and velocityaxes are not necessarily uniform between each panel.
Current usage metrics show cumulative count of Article Views (full-text article views including HTML views, PDF and ePub downloads, according to the available data) and Abstracts Views on Vision4Press platform.
Data correspond to usage on the plateform after 2015. The current usage metrics is available 48-96 hours after online publication and is updated daily on week days.
Initial download of the metrics may take a while.