Fig. 3
Download original image
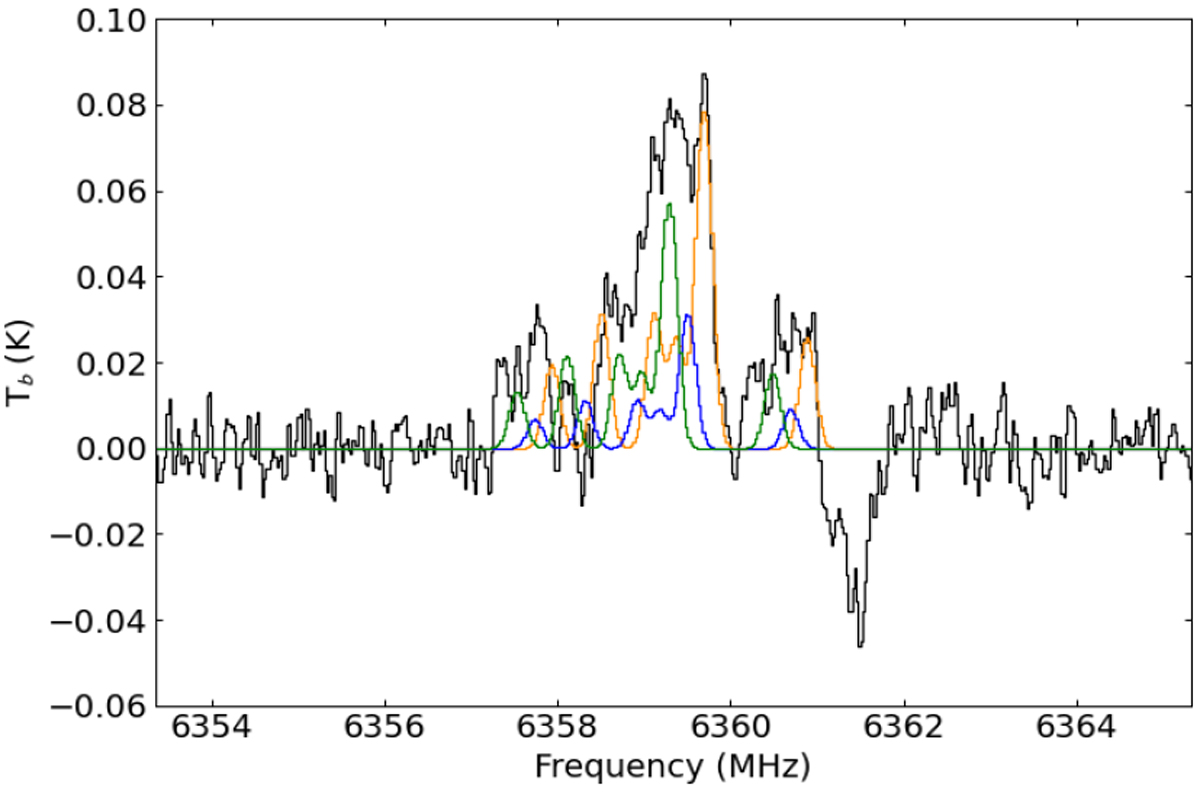
Illustrative spectrum of CH3CONH2 showing therelative intensities of all the HFS (Table 6) and multiple velocity components at +62 (in yellow), +71 (in blue) and + 81 km s−1 (in green) overlaid on the GBT spectrum of Sgr B2(LMH) (in black). The intensity of these emission features cannot be matched by the synthetic LTE model in this work.
Current usage metrics show cumulative count of Article Views (full-text article views including HTML views, PDF and ePub downloads, according to the available data) and Abstracts Views on Vision4Press platform.
Data correspond to usage on the plateform after 2015. The current usage metrics is available 48-96 hours after online publication and is updated daily on week days.
Initial download of the metrics may take a while.