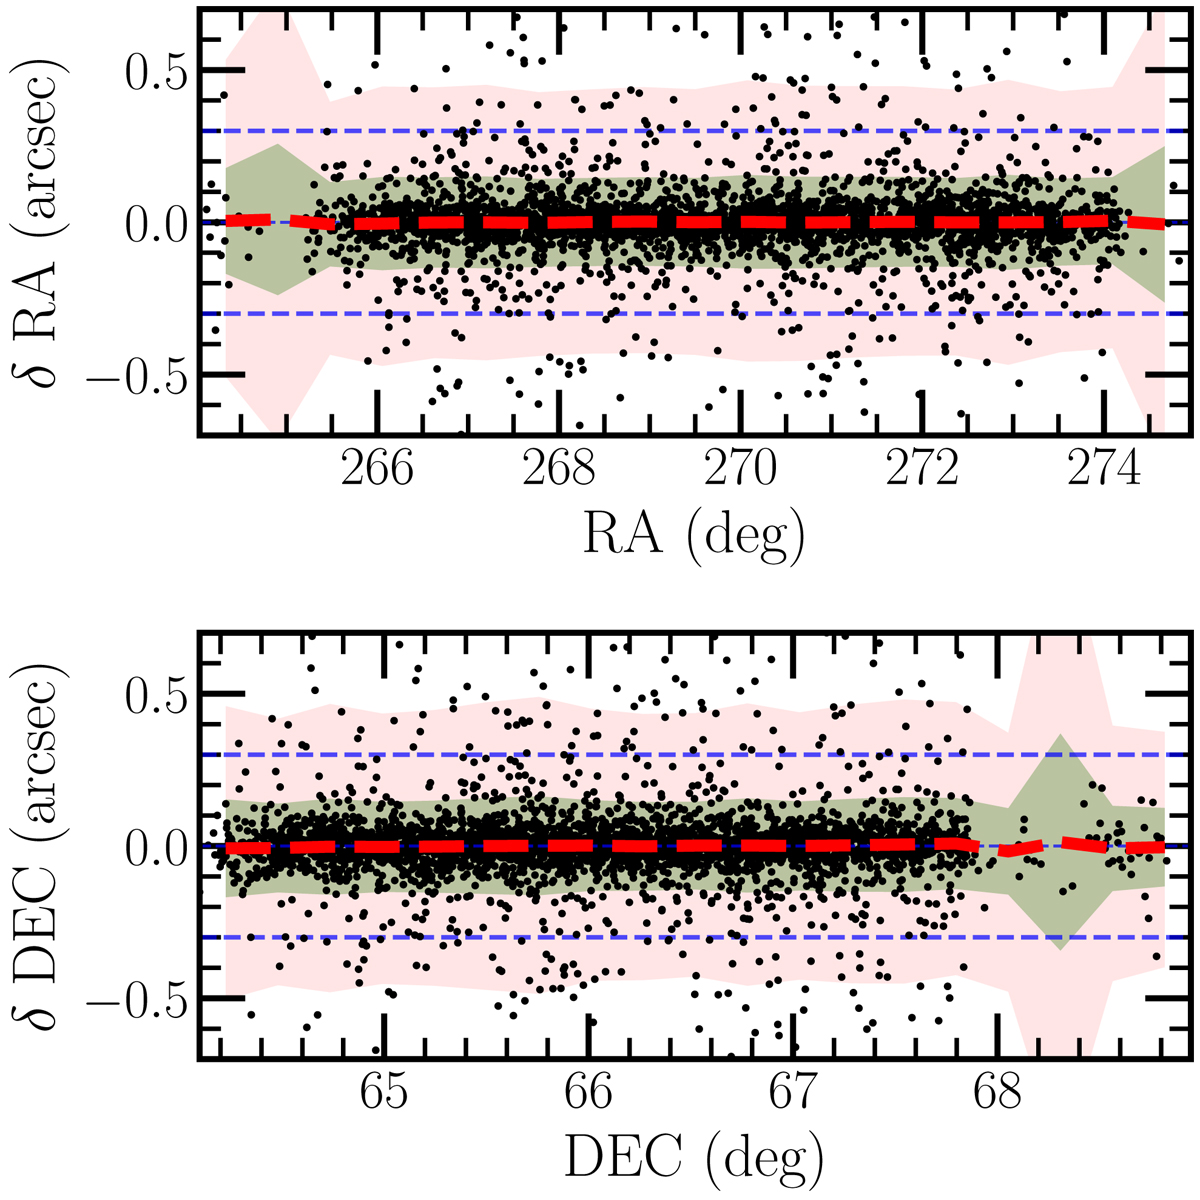
Fig. 6.
Download original image
Difference between the reference Gaia DR2 catalogue and the measured RA (top panel) and Dec (bottom panel) of sources in the EDF-N channel 1 mosaic with 16 < [3.6] < 19 total magnitudes as a function of the coordinate. The solid red line shows a running median computed in bins of 20 points, and the shaded areas indicate the regions containing 68% and 99% of all sources, respectively.
Current usage metrics show cumulative count of Article Views (full-text article views including HTML views, PDF and ePub downloads, according to the available data) and Abstracts Views on Vision4Press platform.
Data correspond to usage on the plateform after 2015. The current usage metrics is available 48-96 hours after online publication and is updated daily on week days.
Initial download of the metrics may take a while.