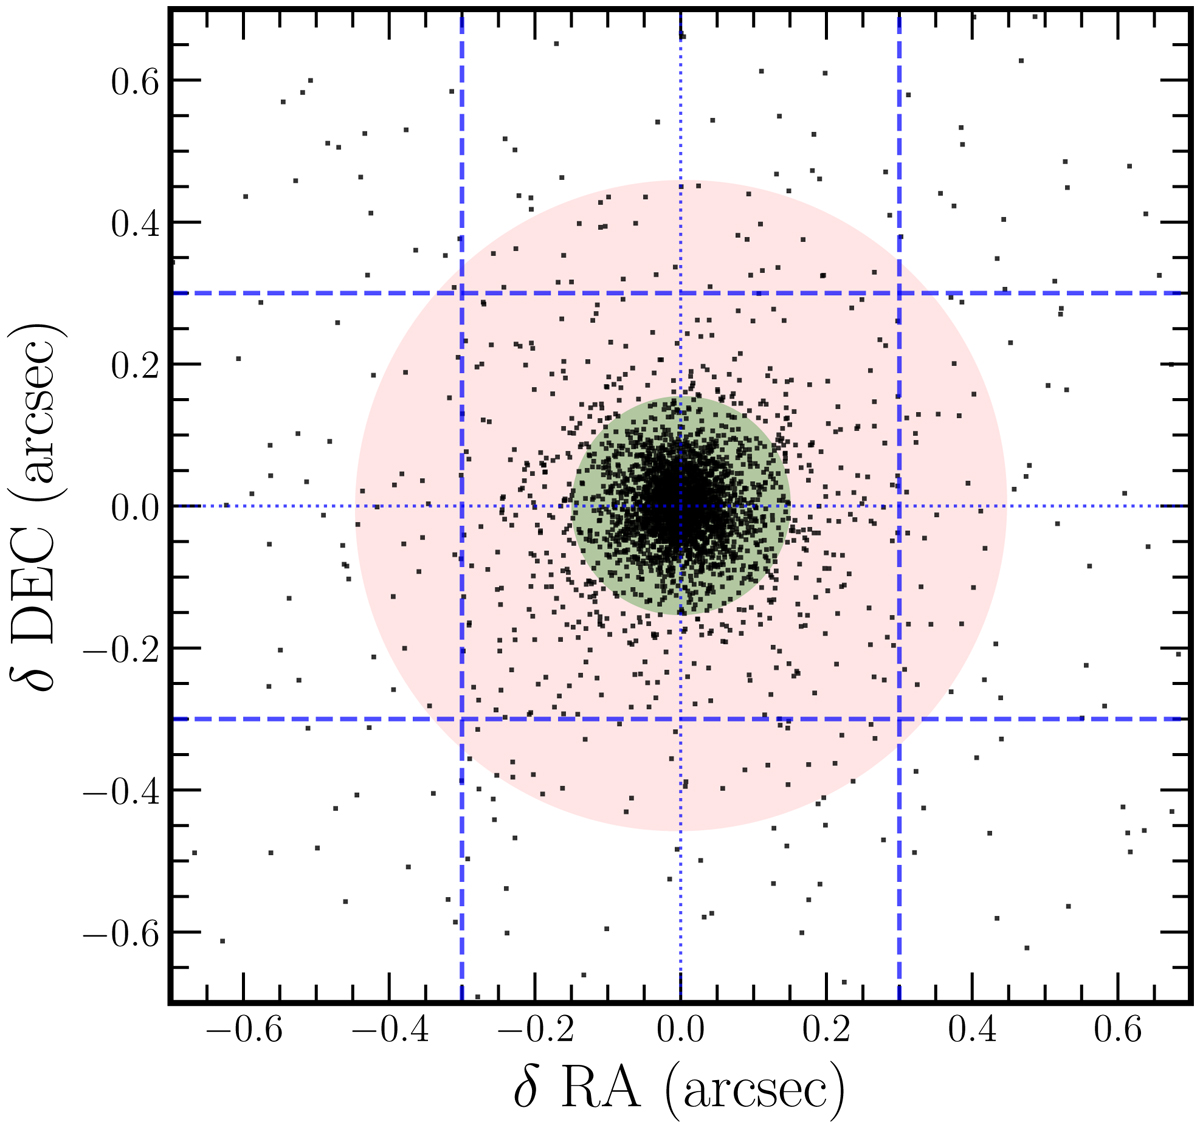
Fig. 5.
Download original image
Difference between the reference and the measured position, in arcseconds, of Gaia DR2 catalogue sources with 16 < [3.6] < 19 total magnitudes extracted from the EDF-N channel 1 mosaic. The blue dashed lines indicate the size of one mosaic pixel. The blue dotted lines go through the origin. The shaded regions are ellipses containing 68% and 99% of all sources, respectively. For clarity, only one in ten sources is plotted.
Current usage metrics show cumulative count of Article Views (full-text article views including HTML views, PDF and ePub downloads, according to the available data) and Abstracts Views on Vision4Press platform.
Data correspond to usage on the plateform after 2015. The current usage metrics is available 48-96 hours after online publication and is updated daily on week days.
Initial download of the metrics may take a while.