Fig. 4.
Download original image
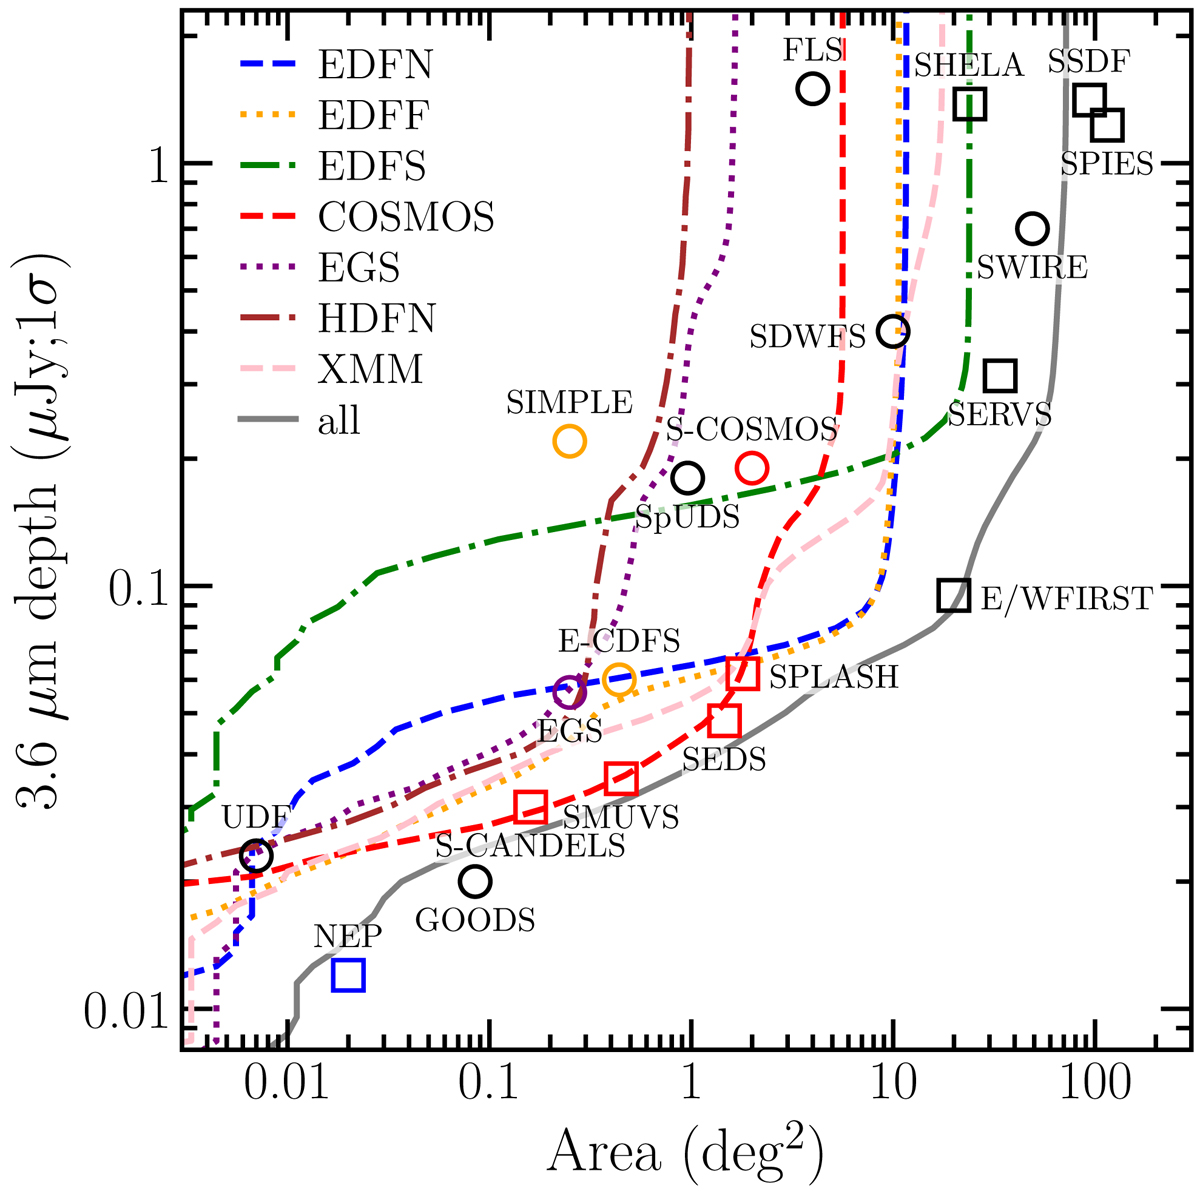
Sensitivity of Spitzer/IRAC channel 1 data as a function of cumulative area coverage. The coloured lines illustrate 1σ depths measured in empty ![]() diameter apertures in each field. The grey solid line is the total area observed to a given depth summed over different surveys. The data points indicate point-source sensitivities at 1σ compiled in Ashby et al. (2018) (we note that some of these data are included in our stacks). The circles and squares represent surveys executed during cryogenic and warm missions, respectively.
diameter apertures in each field. The grey solid line is the total area observed to a given depth summed over different surveys. The data points indicate point-source sensitivities at 1σ compiled in Ashby et al. (2018) (we note that some of these data are included in our stacks). The circles and squares represent surveys executed during cryogenic and warm missions, respectively.
Current usage metrics show cumulative count of Article Views (full-text article views including HTML views, PDF and ePub downloads, according to the available data) and Abstracts Views on Vision4Press platform.
Data correspond to usage on the plateform after 2015. The current usage metrics is available 48-96 hours after online publication and is updated daily on week days.
Initial download of the metrics may take a while.