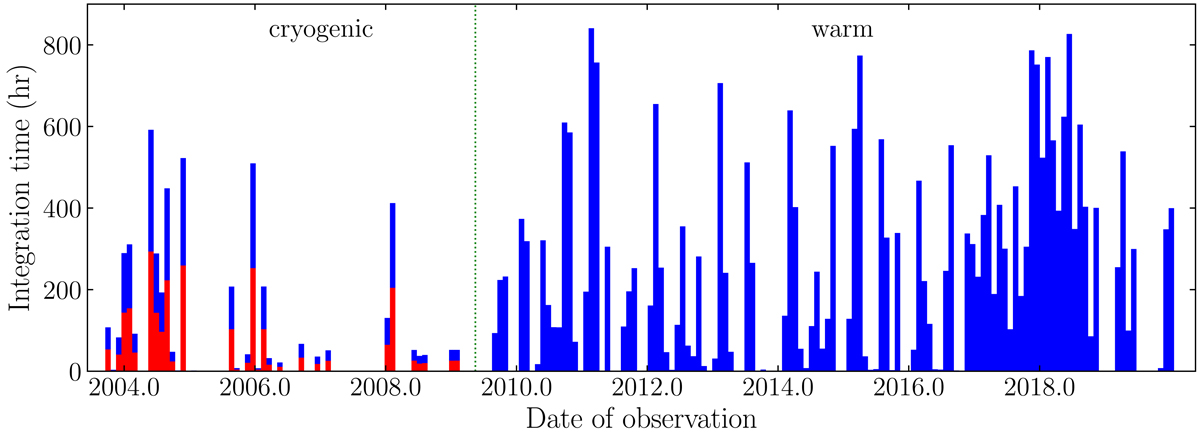
Fig. 1.
Download original image
Histogram of the exposure time of the data analysed here (including the few discarded observations) using bins of 30 days. Our dedicated observations began in November 2016 and comprise most of the data after that date. The red part of each bar accounts for observations in channels 3 and 4, and the blue part accounts for those in channels 1 and 2; the vertical dotted line at 2009.37 indicates the end of the cryogenic mission. No observations are made in channel 3 and 4 after the end of the cryogenic mission.
Current usage metrics show cumulative count of Article Views (full-text article views including HTML views, PDF and ePub downloads, according to the available data) and Abstracts Views on Vision4Press platform.
Data correspond to usage on the plateform after 2015. The current usage metrics is available 48-96 hours after online publication and is updated daily on week days.
Initial download of the metrics may take a while.