| Issue |
A&A
Volume 658, February 2022
|
|
|---|---|---|
| Article Number | A12 | |
| Number of page(s) | 77 | |
| Section | Extragalactic astronomy | |
| DOI | https://doi.org/10.1051/0004-6361/202141698 | |
| Published online | 25 January 2022 | |
Unravelling the origin of extended radio emission in narrow-line Seyfert 1 galaxies with the JVLA⋆
1
European Space Agency (ESA), European Space Astronomy Centre (ESAC), Camino Bajo del Castillo s/n, 28692 Villanueva de la Cañada, Madrid, Spain
e-mail: This email address is being protected from spambots. You need JavaScript enabled to view it.
2
Department of Physics, University of California, Santa Barbara, CA 93106, USA
3
Indian Institute of Science Education and Research Kolkata, Mohanpur, Nadia, West Bengal 741246, India
4
Dipartimento di Fisica e Astronomia “G. Galilei”, Università di Padova, Vicolo dell’Osservatorio 3, 35122 Padova, Italy
5
Finnish Centre for Astronomy with ESO – University of Turku, Vesilinnantie 5, 20500 Turku, Finland
6
Aalto University Metsähovi Radio Observatory, Metsähovintie 114, 02450 Kylmälä, Finland
7
Departamento de Astronomía, Universidad de Chile, Camino del Observatorio 1515, Las Condes, Santiago, Chile
8
European Southern Observatory, Alonso de Córdova 3107, Casilla 19, Santiago 19001, Chile
Received:
2
July
2021
Accepted:
15
September
2021
Abstract
Narrow-line Seyfert 1 galaxies (NLS1s) are believed to be active galactic nuclei (AGN) in the early stages of their evolution. Several dozen of them have been found to host relativistic jets, whilst the majority of NLS1s have not even been detected in radio, emphasising the heterogeneity of the class in this band. In this paper, our aim is to determine the predominant source of radio emission in a sample of 44 NLS1s, selected based on their extended kiloparsec-scale radio morphologies at 5.2 GHz. We accomplish this by analysing their spatially resolved radio spectral index maps, centred at 5.2 GHz, as the spectral index carries information about the production mechanisms of the emission. In addition, we utilise several diagnostics based on mid-infrared emission to estimate the star formation activity of their host galaxies. These data are complemented by archival data to draw a more complete picture of each source. We find an extraordinary diversity among our sample. Approximately equal fractions (∼10–12 sources) of our sources can be identified as AGN-dominated, composite, and host-dominated. Among the AGN-dominated sources are a few NLS1s with very extended jets, reaching distances of tens of kiloparsecs from the nucleus. One of these, J0814+5609, hosts the most extended jets found in an NLS1 so far. We also identify five NLS1s that could be classified as compact steep-spectrum sources. In addition, one source shows a possible kiloparsec-scale relic that reaches well outside the host galaxy as well as restarted nuclear activity, and one could belong to the sub-class of NLS1s that host relativistic jets that seem to be absorbed at lower radio frequencies (< 10 GHz). We further conclude that, due to the variety seen in NLS1s, simple proxies, such as the star formation diagnostics also employed in this paper and the radio loudness parameter, are not ideal tools for characterising NLS1s. We emphasise the necessity of examining NLS1s as individuals instead of making assumptions based on their classification. When these issues are properly taken into account, NLS1s offer an exceptional environment for studying the interplay between the host galaxy and several AGN-related phenomena, such as jets and outflows.
Key words: galaxies: active / galaxies: ISM / galaxies: jets / galaxies: star formation / radio continuum: galaxies
A copy of the reduced images is available at the CDS via anonymous ftp to cdsarc.u-strasbg.fr (130.79.128.5) or via http://cdsarc.u-strasbg.fr/viz-bin/cat/J/A+A/658/A12
© ESO 2022
1. Introduction
Among active galactic nuclei (AGN), the class of narrow-line Seyfert 1 galaxies (NLS1s) has been in the spotlight for the last decade. In the optical spectra of NLS1s, the emission lines originating from the high-density broad-line region (BLR) and the low-density narrow-line region (NLR) are of comparable widths, unlike in broad-line AGN. By definition, the full-width at half maximum (FWHM) of the broad Hβ is FWHM(Hβ) < 2000 km s−1 (Osterbrock & Pogge 1985), whereas the emission lines arising from the NLR usually have widths of a few hundred km s−1. However, we remark that this limit is used mostly for historical reasons since no real threshold is present in the FWHM(Hβ) distribution, at least up to 4000 km s−1 (e.g., see Marziani et al. 2018a). To ensure that they are Type 1 AGN, and that we have a direct view of the BLR, an additional criterion for an NLS1 classification requires the flux ratio of [O III] to total (broad plus narrow) Hβ to be < 3. This threshold has been found to be determinative in separating Type 1 and 2 AGN (e.g., Shuder & Osterbrock 1981). Narrow-line Seyfert 1 galaxies also often exhibit strong Fe II multiplets (Goodrich 1989), confirming the unobstructed view of the central engine.
In the quasar main sequence (MS; Fig. 2 in Marziani et al. 2018a), originally derived by means of principal component analysis (e.g. Boroson & Green 1992) and believed to be mainly driven by the Eddington ratio and orientation, NLS1s are population A sources (FWHM(Hβ) < 4000 km s−1). The horizontal branch in the MS is driven by the Eddington ratio, and R45701, which also anti-correlates with the [O III] line strength, is used as its proxy. The spread on the vertical branch (FWHM(Hβ)) is thought to be mainly dominated by orientation if R4570 is kept fixed (Shen & Ho 2014, but see Panda et al. 2018). Narrow-line Seyfert 1 galaxies show very diverse values of R4570, and since it correlates with the Eddington ratio, this implies that a considerable fraction of NLS1s are accreting close to or even above the Eddington limit (Boroson & Green 1992). Naturally, due to their classification, NLS1s do not show considerable spread in the FWHM(Hβ) values, but, interestingly, they and other population A sources do show different emission line profiles (Lorentzian) compared to the population B sources (FWHM(Hβ) > 4000 km s−1 and Gaussian) (Sulentic et al. 2000a; Marziani et al. 2003; Berton et al. 2020a). Lorentzian profiles are believed to be dominated by turbulent motion in the BLR (Kollatschny & Zetzl 2011; Goad et al. 2012), rather than rotation, and thus orientation might not play a crucial role in most of the population A sources. If this is the case, the narrowness2 of the broad emission lines in NLS1s would be caused by a relatively low-mass black hole, typically < 108 M⊙ (Peterson 2011), compared to, for example, broad-line Seyfert 1 galaxies (BLS1s), which usually have MBH > 108 M⊙. This seems to be confirmed by reverberation mapping campaigns that focus on NLS1s (Wang et al. 2016; Du et al. 2018; Du & Wang 2019). Interestingly, it has been found that the Hβ lags compared to changes in the continuum in high Eddington ratio sources are shorter than expected, suggesting that this quality affects the distance of the BLR clouds from the continuum (Du et al. 2018; Dalla Bontà et al. 2020).
Assuming that the black hole masses in NLS1s are < 108 M⊙, and since the mass can only increase with time, NLS1s may constitute an early stage of the AGN life cycle and may eventually grow into fully developed BLS1s (Mathur 2000; Sulentic et al. 2000b; Fraix-Burnet et al. 2017). However, an alternative hypothesis is that the narrowness of permitted lines originates from the BLR geometry. If the BLR is flattened, when observed pole-on we only observe the part of the velocity vector directed towards us; since the rotation happens on a plane misaligned with our line of sight, we do not observe considerable Doppler broadening of the lines, and the emission lines appear narrow. In this scenario, the black hole mass of NLS1s can be significantly higher than 108 M⊙, and NLS1s would be no different from BLS1s and other broad-line AGN (Decarli et al. 2008). However, the abovementioned reverberation mapping studies, and other observational properties of NLS1s, such as their host galaxy morphologies (e.g., Krongold et al. 2001; Deo et al. 2006; Antón et al. 2008; Kotilainen et al. 2016; Järvelä et al. 2018; Berton et al. 2019; Olguín-Iglesias et al. 2020; Hamilton et al. 2021, but see D’Ammando et al. 2017; D’Ammando et al. 2018), seem to indicate that the black hole mass is genuinely low when compared to BLS1s and other broad-line AGN.
The central engine of an AGN can launch a host of different effluxes, spanning from highly collimated powerful relativistic jets, through lower-power non-relativistic jets, to wide-angle outflows generated by nuclear winds. Traditionally, the most powerful relativistic jets have been associated with the most massive supermassive black holes that reside in old elliptical galaxies (Laor 2000), whereas low-power jets and outflows can be seen in a wider variety of AGN. Interestingly, some NLS1s (∼7%; Komossa et al. 2006) show prominent radio emission and several blazar-like properties, such as high brightness temperature, prominent variability, and a double-humped spectral energy distribution (SED; Yuan et al. 2008). The discovery of gamma-ray emission from a handful of them (∼20; Romano et al. 2018; Järvelä et al. 2020; Rakshit et al. 2021) proved that, just like blazars and radio galaxies, NLS1s can harbour powerful relativistic jets. As the NLS1s that do not host relativistic jets may be the progenitors of BLS1s, it has been suggested that NLS1s with relativistic jets are an early stage of the life cycle of flat-spectrum radio quasars (FSRQs; Berton et al. 2017; Foschini 2020). Furthermore, several authors have hypothesised that, when seen at a larger angle, relativistic jetted NLS1s may appear as kinematically young radio galaxies, such as compact steep-spectrum (CSS) sources (Oshlack et al. 2001; Gallo et al. 2006; Komossa et al. 2006; Caccianiga et al. 2014, 2017; Berton et al. 2016a, 2017; Foschini 2017; Yao & Komossa 2021). At radio frequencies, when their relativistic jet axis is close to the line of sight, these NLS1s typically show a flat spectrum and a compact morphology on kiloparsec scales (Berton et al. 2018, from now on B18). When instead the relativistic jet has a larger inclination, they tend to become fainter due to the decreasing impact of boosting effects, to become more extended, and to show, at least in a few cases, radio lobes (B18; Vietri et al., in prep.).
However, the vast majority of NLS1s are radio-quiet or radio-silent3. The origin of the radio emission in these NLS1s is still debated. The presence of jets, even relativistic ones, in them cannot be ruled out. Because of the non-linear scaling between jet power and black hole mass (Heinz & Sunyaev 2003), and the still widely unexplored impact of the magnetic flux density (Chamani et al. 2021), jets, even relativistic ones, in NLS1s can be weak and just barely dominate the total radio emission produced by the galaxy. In some extreme cases, they may even be completely invisible at low radio frequencies due to absorption by a screen of ionised gas, making the AGN appear as radio-quiet or radio-silent (Lähteenmäki et al. 2018; Berton et al. 2020b; Järvelä et al. 2021). Alternative sources of radio emission on scales smaller than ∼0.1 kpc can be the accretion disk corona or weakly collimated disk winds. Wide-angle outflows due to nuclear winds (Proga 2007) are also common in these sources. In radio frequencies, these outflows are characterised by non-collimated morphologies and steep spectral indices (Faucher-Giguère & Quataert 2012; Panessa et al. 2019) that can show steepening towards high frequencies (Jiang et al. 2010). At the host galaxy scale, instead, the radio emission from star formation activity typically dominates, in the form of synchrotron emission from supernova remnants and free-free emission from H II regions (Lister 2018; Panessa et al. 2019). All of these components are often present at the same time, and distinguishing between them is not an easy task. B18 found that, on average, radio-quiet objects show an extended morphology with a spectral index steeper than what is found in NLS1s with known relativistic jets, but they could not draw many conclusions on the sample as a whole. When the radio morphology is extended, a detailed analysis of each source is the preferred way to understand exactly the mechanisms at play in each individual source.
The goal of this paper is to accurately analyse the sources in B18 with an extended morphology to understand the nature and the origins of their radio emission. A possible way to do this, and to tell the different sources of radio emission apart, is by studying spatially resolved spectral index maps. Such a technique can provide some indications on the nature of the extended emission in sources without jets, while in jetted NLS1s it can reveal the presence of an interaction between the relativistic jets and the interstellar medium. Furthermore, we carried out a detailed search in the literature for each source to obtain as much useful information as possible and paint a complete picture of all of our targets.
This paper is organised as follows: In Sect. 2 we briefly overview the sample, in Sect. 3 we describe the data reduction and the production of the radio and spectral index maps, and in Sect. 4 we overview star formation mechanisms that produce radio emission. We also introduce some diagnostic tools we can use to estimate its contribution in our sources and discuss the possible issues with these tools. Then, in Sect. 5 we summarise the star formation results for the whole sample and discuss each source individually. Finally, in Sect. 6 we discuss our results and their implications, and we conclude with a brief summary in Sect. 7. Throughout the paper, we use the standard Λ cold dark matter cosmology, with H0 = 70 km s−1 Mpc−1 and ΩΛ = 0.73 (Komatsu et al. 2011). For spectral indices, we adopt the convention of Sν ∝ να at frequency ν.
2. Sample
This paper is continuation of B18, where the original sample selection is explained. Our sources were selected from their sample based on the radio morphology. B18 presents Karl G. Jansky Very Large Array (JVLA) A-configuration observations of 74 NLS1s obtained in project 15A-283 (P.I. J. Richards). The observations are centred at 5.2 GHz, with a bandwidth of 2 GHz. From the original sample we selected for further analysis all sources whose radio morphology was classified either as extended (E) or intermediate (I) (see Table A.1. in B18). In extended sources the ratio between the peak flux density and the integrated flux density is < 0.75, and in intermediate sources the ratio is between 0.75 and 0.95. Sources with a ratio > 0.95 were classified as compact (C). We decided to leave out the compact sources in this study since most of them show a flat radio spectrum, and they lack the extended radio emission we are especially interested in. This selection criterion resulted in a sample of 20 extended and 26 intermediate sources. Two extended sources were left out due to bad data quality, so our final sample size is 44 sources. The compact sources will be a subject of a future study.
Basic information of the sample, including name, coordinates, redshift, scale, and radio morphological type, is listed in Table A.1. The redshift, black hole mass, Eddington ratio, and radio luminosity distributions of our sample, taken from B18 and Berton et al. (2020b), divided to intermediate and extended source sample, are shown in Figs. 1–4.
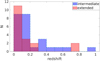 |
Fig. 1. Redshift distribution of our sample, divided based on the radio morphology classification. Sources with intermediate radio morphology are marked in blue with a dashed edge line, and sources with extended radio morphology are marked in red with a dotted edge line. |
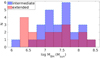 |
Fig. 2. Logarithmic black hole mass distribution of our sample. The division into sub-samples as well as the colours and edge styles are the same as in Fig. 1. |
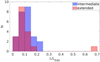 |
Fig. 3. Eddington ratio distribution of our sample. The division into sub-samples as well as the colours and edge styles are the same as in Fig. 1. |
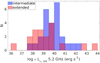 |
Fig. 4. Distribution of the 5.2 GHz integrated radio luminosities of our sources. The division into sub-samples as well as the colours and edge styles are the same as in Fig. 1. |
3. Data analysis
3.1. Radio data calibration
We reduced the radio data again, and used the standard Extended Very Large Array (EVLA) pipeline 5.0.0 for the calibration. Each dataset had its own flux calibrator. After running the pipeline we split the individual measurement sets of each source from the main datasets, averaging the data over the 64 channels of each of the 16 spectral windows and over ten seconds of exposure time. For further data reduction and analysis after splitting we used the Common Astronomy Software Applications (CASA) package version 5.6.2-3 due to its enhanced data reduction capabilities, for example, in producing spectral index maps.
3.2. Spectral index maps
We constructed the spectral index maps and their respective error maps following the procedure described in Wiegert et al. (2015), which we also summarise here. The procedure includes the actual cleaning of the data as well as several post-imaging corrections.
3.2.1. Cleaning
The clean algorithm in CASA (tclean) enables multi-term (multi-scale) multi-frequency synthesis, mt-mfs (Rau & Cornwell 2011). The multi-term feature allows a simultaneous fitting of a spectral index over the whole band-width and as a function of the position within the image using a simple power-law. The multi-scale algorithm enables an enhanced modelling of flux components at different scales by using both delta functions and circular Gaussians in the deconvolution, instead of just delta functions as in the other clean algorithms. We experimented with the multi-scale feature using some of the most extended sources in our sample, but concluded that using different scales does not significantly alter the resulting spectral index or error maps in comparison to ‘traditional clean’ with scales = 0, and thus we decided to use only the multi-term option. We used a natural weighting scheme for the majority of our sources, with a few exceptions: for J0347+0105, J1209+3217, and J1317+6010 we used Briggs weighting with robust = 0.0, and for J1047+4725 we used uniform weighting. These four sources suffered from strong sidelobes whose effects we suppressed by using an alternative weighting scheme.
The mt-mfs algorithm performs the fitting by modelling the spectrum of each flux component (pixel) by a Taylor series expansion about the reference frequency, ν0. A specific intensity at frequency ν, Iν, can be fit with:
 (1)
(1)
where α is the spectral index and β is the curvature of the power-law. Expanding Eq. (3.2.1) in a Taylor series about ν0 results in Taylor terms, or maps, equal to the number of terms in the Taylor polynomial used. The first map, TT0, corresponds to the specific intensities at ν0 and is thus equal to the normal radio map. The second map, TT1, is defined so that α = TT1/TT0. The third term, TT2, describes the spectral curvature and is defined so that β = TT2/TT0 − α(α − 1)/2.
The number of Taylor terms is not limited, but in practice using more than two or three terms is usually not needed. Furthermore, the data quality does not usually allow it, since the more terms used, the higher the required S/N of the data is. Most of our sources are quite faint, and the extended parts, where some curvature could be seen are usually regions of low S/N (∼3–6), and thus not of adequate quality to fit the β term. Therefore, we chose to use two Taylor terms to maximise the quality of the α maps. The end products of the cleaning procedure are a TT0 map, centred in the middle of the observing bandwidth at ∼5.2 GHz, a corresponding TT1 map, and α, and Δα maps. The Δα map is an error map describing the empirical error estimate based on the errors of the TT0 and TT1 residual images.
In the mt-mfs method the fit is performed on the flux component, resulting in a uniform resolution and S/N over the whole band. This is clearly superior to the traditional way of forming a spectral index map by splitting the observed bandwidth to two and then estimating the spectral index based on these two maps that intrinsically have different resolutions and S/N. However, mt-mfs is not perfect either, and α and Δα maps require some post-processing steps, which are described in the next sections.
3.2.2. Wide-band primary beam correction and 5σ cutoff
The primary beam varies with frequency and thus imposes its own spectral index onto the Taylor-coefficient images, TT0 and TT1, and the α map. This can be corrected with the CASA task widebandpbcor, which computes a set of primary beams at given frequencies, calculates the Taylor-coefficient images representing the primary beam spectrum, performs the primary beam correction of the Taylor-coefficient images, and finally computes the primary beam corrected α map using the corrected Taylor-coefficient images.
However, this correction cannot account for any variations during a specific observation, including, for example, the slightly changing shape of each telescope, and the rotation of the primary beam on the sky when tracking a source. The primary beam errors also increase with distance from the pointing centre, and it is necessary to understand the impact of these effects on the final α maps to determine their accuracy. Bhatnagar et al. (2013) showed that the effects are insignificant up to the half-power beam width (HPBW), after which they cause considerable errors in total intensity as well as spectral index maps. The HPBW of the JVLA at 5.2 GHz is ∼8 arcmin, giving a radius of ∼4 arcmin. All of our sources are clearly less extended than this – the most extended ones being < 6 arcsec – and the total intensity, as well as the spectral index maps, should be accurate.
Unfortunately we could not perform any further tests on the correctness of the α maps since our data are limited; we did not have any observations with multiple pointing, or observations carried out in more than one observing sessions. What we could do, however, is compare the α maps to the spectral index values obtained in B18 where the traditional way of estimating the spectral indices was used. This comparison is made in Sect. 3.3.
In addition to wide-band primary beam correction, we masked pixels with a S/N < 5σ, where σ is the rms of the corresponding TT0 image of the source. We chose 5σ instead of a more traditional 3σ threshold since the α maps consistently show extreme or clearly erroneous values when the S/N is low, and thus these peripheral regions in general do not hold valuable information.
3.2.3. Δα cutoff
The primary beam corrected α maps can still show considerable variations, especially near the edges. Also, the Δα map correspondingly shows very high errors in these regions, implying that the data quality might not have been adequate to accurately estimate the spectral index. We removed the most extreme values by creating an additional mask based on the values of the Δα map, and then applying it onto the α map. Following Wiegert et al. (2015) we decided to cut off all the data that has Δα > 1. We also experimented with lower values, but the cutoff of the data would have been too drastic, so we decided to use the threshold of Δα > 1, even if some less accurate values might remain.
3.2.4. Smoothing of the α and Δα maps
The Taylor coefficient maps are convolved with the clean beam, but as the α and Δα maps are derived from them using mathematical operations their final resolution is not the same as that of the Taylor coefficient maps. We thus smoothed the α and Δα maps using the parameters of the clean beam of each source. This considerably decreases the small-scale variance of the α maps and the errors of the Δα maps.
3.2.5. Remaining issues and additional tests
In summary, the post-imaging correction steps performed to achieve the final α and Δα maps were: (i) wide-band primary beam correction, (ii) 5σ cutoff, (iii) Δα > 1 cutoff, and (iv) convolution with the clean beam.
The final α and Δα maps, overlaid with the normal radio contours, are shown in Appendix B. Individual sources are discussed in Sect. 5. The rms of the maps and the peak and integrated flux densities are listed in Table A.3. We obtained the peak flux density by fitting a 2D Gaussian to the data, and the integrated flux density by summing up all the emission within the 3σ contour. The peak flux density error is the one given by CASA when fitting a 2D Gaussian to the data, the errors of the integrated flux densities were estimated with rms per beam × the square root of the area of emission expressed in beams. In addition, for each source we calculated an average spectral index over the whole region that the α map covers weighted with the surface brightness, and in the core in a region with a radius of 2 px. For some interesting sources we also calculated a spectral index in a region of interest outside the core. Also, these regions had a radius of 2 px. The total, core, and region of interest spectral indices, as well as the coordinates of the regions of interest are listed in Table A.4.
Even after these passages, some issues remained with the maps. The peripheral regions of some α maps exhibit extreme values, which are usually accompanied by higher-than-average errors in the Δα maps. Thus any seemingly drastic changes in the spectral index in the edge regions of the maps should be taken with a grain of salt. In case of some of the faintest and smallest sources these effects seem to dominate the whole α map.
Even though the resolution over the whole band is uniform when using the mt-mfs method, it is in principle possible that a source might have some structures that are resolved-out at higher frequencies, thus artificially steepening the spectral index. In practice, these structures would have to be on a scale of several kiloparsecs, and generally such extended emission is diffuse and faint, so we considered their contribution negligible. Furthermore, it is also worth noting that in NLS1s extended emission at scales much larger than a few kiloparsecs is very rarely observed (Chen et al. 2020).
Finally, the frequency-dependent changes in the uv range might have an impact on the α maps, especially in very extended sources. We examined its effects by selecting a few of the most extended sources and doing a comparison α map where the uv range was selected to span only the range where all spectral windows had data. Examples of an α and a Δα map produced with a common uv range for J1302+1624 are shown in Figs. B.157 and B.158. The α and Δα maps of the same source without limiting the uv range are shows in Figs. B.152 and B.153. It is clear that the differences between the α maps are marginal, and it thus seems safe to assume that the effect of the uv range to the α maps is insignificant.
3.3. Comparison to classical spectral indices
Since our sources are a sub-sample of the NLS1 sample studied in B18, where also their spectral indices were estimated, we can compare our α maps and weighted average spectral indices with their results. They used the traditional way of estimating the spectral index by splitting the 2 GHz band to two 1 GHz wide windows, cleaning them using a common uv range, and then measuring their emission properties separately. Effectively this gives an in-band two-point spectral index with the central frequencies of 4.7 and 5.7 GHz. In most cases the spectral indices in B18 agree with our results, but there are a few curious cases in B18 where the in-band spectral index is very close to zero, but these sources look steep with α closer to −1 in our new maps. The in-band spectral indices of these sources also do not correlate with the 1.4–5 GHz spectral index derived in B18 (recalculated and shown also here in Table A.4), whereas the majority of their sources show a correlation of these two spectral indices. This raised our suspicion and we decided to estimate again the traditional spectral indices of some of these rogue sources using a newer CASA version (5.6.2-3), since an older version (4.7.2) was used in B18. We did the cleaning and the estimation of the spectral indices exactly as in B18, and the new results we obtained are in agreement with the α maps (i.e., these sources do also show steep indices when derived the classical way). We thus believe that our α maps are reliable and that the spectral index estimation of the few peculiar sources in B18 is influenced by some undetermined issue.
3.4. Tapered maps
In addition to normal maps, we produced tapered maps of our sources to enhance the sensitivity to extended structures. In this procedure, in addition to the selected weighting scheme, a Gaussian taper, which decreases the weights of the outermost baselines in the uv plane, is applied to the data. We produced the tapered maps using two different tapers, 60kλ and 90kλ, to examine the extended structures with a bit more detail (90kλ), and to try to bring out even the faintest extended emission (60kλ). Tapered maps are shown in Appendix B. The rms and the integrated flux densities of the tapered maps are listed in Table A.3. The errors of the integrated flux densities were estimated with rms per beam × the square root of the area of emission expressed in beams.
4. Radio emission from star formation
In addition to the processes connected to the nuclear activity, also star formation activity, via free-free emission and synchrotron emission from supernova remnants, can significantly contribute to the radio emission of galaxies (Condon 1992; Panessa et al. 2019). In some cases, the radio emission produced this way is even strong enough to make a source appear radio-loud4 (Ganci et al. 2019), which is usually considered a sign of strong nuclear activity, or even of the presence of jets. Especially NLS1s are known to often show enhanced star formation (Sani et al. 2010). Indeed, Caccianiga et al. (2015) claim that the mid-infrared colours of some sources in a sample of flat-spectrum NLS1s suggest that star formation is actually the predominant source of their radio emission. The combination of the almost flat spectral index of the free-free emission and the steep spectral index of the supernova remnant synchrotron emission results in a total spectral index of ∼ − 0.7, close to what is observed in several of our sources. We thus wanted to estimate the star-formation-related radio emission in our sources, to better understand their nature and to aid the interpretation of our results. The best way to do this is to use mid- or far-infrared observations, since star formation manifests strongly in these bands. Only a few NLS1s have far-infrared data; therefore, we are limited to the mid-infrared data from the Wide-Field Infrared Survey Explorer (WISE, Wright et al. 2010) AllWISE data release. WISE performed observations in four bands: W1, W2, W3, and W4, with respective wavelengths of 3.4, 4.6, 12, and 22 μm. In particular, the longer wavelength bands, W3 and W4, are relevant to star formation studies in AGN. To achieve a comprehensive picture we decided to use several different methods, described below.
First, investigating a sample of flat-spectrum NLS1s, Caccianiga et al. (2015) conclude that WISE colours can be used as a proxy of their star formation activity, because they are sensitive to the comparable strengths of different mid-infrared emitting components in active galaxies. Especially the W3–W4 colour is sensitive to the strength of star formation because increasing star formation gets stronger towards longer wavelengths thus it especially affects the W4 band emission, making the colour redder. They determine that colours redder than W3–W4 > 2.5 cannot be explained by AGN SED templates, but they require a strong star formation component (see Figs. 2 and 3 in their paper). We calculated the W3–W4 colour of our sources, and it is shown in Table A.5, as well as the W3 and W4 magnitudes, and the W3 flux density.
Second, another parameter Caccianiga et al. (2015) use is a variant of the widely used q24 parameter, which reflects the strength of the 24 μm emission relative to the 1.4 GHz emission. Caccianiga et al. (2015) use a q22 parameter instead, defined as
 (2)
(2)
where S22 μm is the W4 band flux density and S1.4 GHz is the 1.4 GHz flux density. We only have 5.2 GHz flux densities from our observations, so we extrapolate the 1.4 GHz flux densities from the 5.2 GHz values using the weighted total spectral index from the α maps of the sources. Caccianiga et al. (2015) define that a major star formation contribution to the radio emission can be expected in sources with q22 > 1, especially when combined with a red W3–W4 colour.
Third, another method we used is the estimation of the star-formation-related radio emission using mid-infrared observations. In Boyle et al. (2007) the authors derive relations between the 20 cm (1.5 GHz) and the 24 μm flux densities using two different datasets. The WISE W4 band observations are at 22 μm but the 2 μm difference is most probably negligible in this case since the variation in the rest-frame wavelengths due to redshifts is considerably larger, and the observed bands largely overlap. Moreover, Boyle et al. (2007) do not take redshift into account either, and their redshift range is comparable to ours, so their data are influenced by the same redshift bias. Thus we decided not to correct the 22 μm flux densities for redshifts. The relations used are
 (3)
(3)
and
 (4)
(4)
where S20 cm is the estimated flux density at 20 cm, or 1.5 GHz, and S24 μm is the observed 24 μm flux density.
The star-formation-related radio emission estimates calculated using the above equations are shown in Table A.5. Equation 3 was derived using the observations of the Chandra Deep Field South (CDFS) region, and we thus call it the S20 cm CDFS estimate, whereas the observations of the European Large Area ISO Survey (ELAIS) field was used to derive Eq. (4), and we correspondingly call it the S20 cm ELAIS estimate. It should be noted that the aforementioned Equations give the flux density estimate at 1.5 GHz, whereas our observations are centred at 5.2 GHz. If we assume for star-formation-related emission the characteristic spectral index of −0.7, the flux density at 5.2 GHz, S5.2 GHz, is 0.42 × S20 cm.
The fourth method we implemented is the direct comparison of the radio and mid-infrared flux densities. Kozieł-Wierzbowska et al. (2021) study the radio – mid-infrared connection in a large sample of radio AGN and pure star forming galaxies, and conclude that a simple separation based on SW3 = S1.4 GHz correctly classifies 98–99% of galaxies, with the star forming galaxies lying above the line, and the radio AGN below. Choosing W3 instead of W4 is based on the fact that the polycyclic aromatic hydrocarbon (PAH) features, which manifest the strongest around ∼11 μm, for sources with z < 0.6 fall in the W3 band (Jarrett et al. 2011), which covers 7–17 μm. The PAH emission is often associated with the presence of massive young stars, and it can thus be used as a proxy for the star formation in the galaxy (da Cunha et al. 2008). In our case we do not expect the division to be so straightforward since it is expected that in many of our sources the radio emission is produced by both, the AGN and star formation. Furthermore, according to some studies (e.g. LaMassa et al. 2012) the PAH features are considerably suppressed in AGN-dominated systems, which might affect the usefulness of this proxy in some of our sources. On the other hand, Esquej et al. (2014) do not find proof of PAH suppression in the vicinity of low-luminosity AGN, which most of the sources in our sample are. The feasibility of this method is further supported by the study in Sani et al. (2010) where they successfully use the PAH features to investigate star formation in NLS1s. In Kozieł-Wierzbowska et al. (2021) the radio flux density at 1.4 GHz is used so we extrapolated it for our sources from our 5.2 GHz observations the weighted total spectral index measured from their α maps.
4.1. Remarks on mid-infrared emission
However, some caveats should be kept in mind when using the aforementioned methods. They have been formulated using large samples of AGN and reflect their general properties but are not necessarily as accurate for smaller samples with peculiar properties, such as NLS1s. Naturally, the most important question to ask is how certain we are of the origin of the mid-infrared emission in AGN, and especially in NLS1s. The above-mentioned diagnostics assume that enhanced mid-infrared emission and certain colours are associated with star formation, which necessarily is not always the case. Indeed, in some cases features similar to those caused by star formation can be caused by the AGN itself heating the surrounding dust.
4.1.1. Polar dust
One significant phenomenon causing possible deviation from these relations is the presence of polar dust in AGN (e.g., Burtscher et al. 2009; Asmus et al. 2016; Leftley et al. 2019). Polar dust comprises warm (approximately a few hundred degrees Kelvin) dust that is situated along the polar direction of an AGN (i.e., perpendicular to the conventional dusty torus) and usually spans some tens of parsecs. It is believed to be maintained by a nuclear wind driven by radiation pressure (Leftley et al. 2019). Its SED (νFν vs. λ) peaks in mid-infrared, around 10–30μm (Lyu & Rieke 2018), depending on the temperature, and in some cases its contribution to mid- to far-infrared emission is significantly stronger than the contribution of the AGN, or star formation, reaching even a dominance of 90% (Hönig et al. 2013; Asmus 2019). Its spectral shape is somewhat similar to the shape caused by strong star formation at mid-infrared wavelengths (see Fig. 9 in Lyu & Rieke 2018). This is relevant in our case since polar dust emission can significantly enhance the emission in both W3 and W4 bands, and due to its properties it enhances the W4 band emission more than the W3, mimicking mid-infrared properties conventionally associated with star formation activity. An example is NGC 3782, a Seyfert 1 galaxy that does not show significant star formation, but has a W3 flux density 600 mJy higher than its 1.4 GHz flux density, and its W3–W4 > 2.5. Indeed, its mid-infrared emission was found to be dominated by dust in the polar region (Hönig et al. 2013). Such sources are plenty (see e.g., Zhang et al. 2013; Lyu & Rieke 2018), and unfortunately we have no way of estimating the polar dust contribution without careful SED modelling or direct high-resolution mid-infrared observations of the emitting region, since such data are not available. Moreover, there are indications that high Eddington ratio sources, such as NLS1s, have a tendency to show more polar dust (Leftley et al. 2019).
However, Zhang et al. (2013) find that the ratio of the [O III] wing and the bolometric luminosity is correlated with the mid-infrared covering factor. The wing is believed to rise from turbulent polar outflows in the inner NLR (Peng et al. 2014), and thus they propose that this indicates that a considerable fraction of the warm dust producing mid-infrared emission in AGN is likely embedded in polar outflows. The [O III] lines of all of our objects are analysed in Berton & Järvelä (2021), which reports their core and wing properties, including velocity and width of both components. The [O III]λ5007 was fitted with two Gaussians, one for the core component, and one to reproduce the blue wing. The same Gaussians, rescaled, were used to fit the [O III]λ4959 simultaneously. The errors were calculated via a Monte Carlo method, by randomly varying the noise on the line and fitting them 1000 times. Unfortunately we do not have the information about the luminosity of the wing, but the presence of a wind alone already indicates the presence of nuclear outflows, and increases the probability those sources might host a prominent polar dust component.
4.1.2. Dusty torus
Another emission source whose contribution to the infrared emission is not totally clear is the more conventional AGN structure, the dusty torus. It is known that the hot (1000–1500 K) dust, in the inner parts of the torus manifests as a bump in near-infrared bands, around 2–4 μm (in νFν vs. λ), and in general seems to dominate the infrared spectrum between 1 and 10 μm (e.g. Edelson & Malkan 1986; Rodríguez-Ardila & Mazzalay 2006). The overall torus emission instead peaks at mid- to far-infrared wavelengths (Fritz et al. 2006; Zhuang et al. 2018), and as demonstrated by Zhuang et al. (2018) contribution from different AGN- and host-related elements significantly changes when modelling the same SED with different models (see also González-Martín et al. 2019), leaving a lot of space for interpretation. The implications of this are two-fold: the torus emission can result in enhanced mid-infrared emission, without any contribution from star formation, and, if the mid-infrared emission is dominated by the AGN, it means that W3 and W4 might not reflect the properties of the host galaxy, but of the AGN itself, which would render some of the diagnostic tools we are using unreliable.
In the literature, the results regarding the AGN and host galaxy contributions differ considerably, from 90% AGN domination to only ∼15% AGN contribution (Dicken et al. 2009; Rosario et al. 2013; Zhuang et al. 2018; González-Martín et al. 2019). However, a trend of decreasing AGN contribution from brighter quasars to more moderate Seyfert galaxies can be observed. Rosario et al. (2013) studies a sample of 13 000 Type 2 AGN using the W3 and W4 bands, and 1.4 GHz radio luminosities. They found that Seyfert galaxies almost exclusively lie in the mid-infrared-bright region, and conclude that their mid-infrared emission is mainly related to star formation activity, and that only ∼15% of the W4 band emission has an origin in the AGN-heated dust. Interestingly, they find that the W3 band emission in Seyfert galaxies is suppressed compared to pure star-forming galaxies, possibly due to the PAH destruction due to the AGN emission (LaMassa et al. 2012).
4.1.3. Summary of mid-infrared issues
All these components – the torus, polar dust, and star formation – can, and often do, co-exist (see Fig. 13 in Lyu & Rieke 2018), complicating the situation even more. Before moving forwards, we summarise how these four different mid-infrared emission production scenarios can affect our diagnostics, and what we can do to mitigate their effects.
First, regarding W3–W4 mid-infrared colour, polar dust emission can show properties similar to star formation. The presence of an [O III] wing can be used to estimate whether polar winds are present and might contribute to the mid-infrared emission and colours. Furthermore, PAH features can be suppressed, which will redden the W3–W4 colour; this, however, will not have an effect on the diagnostic value.
Second, the q22 parameter cannot account for additional mechanisms that produce 22 μm emission, for example, polar dust; therefore, other diagnostics need to be used to estimate the probability of contamination. It also cannot account for strong AGN radio emission, and therefore q22 values below 1 should not be used for diagnostic purposes.
Third, regarding the SW3 − S1.4 GHz relation, the W3 emission can be enhanced by AGN-heated dust emission that can make the source look star-forming. Also in this case, the presence of an [O III] wing can be used to estimate if polar dust is present. Furthermore, AGN can suppress the 11.3 μm PAH feature, and therefore other diagnostics must be used.
Finally, the SCDFS − Sint relation has been calibrated using star forming galaxies and does not take into account the contribution of the AGN in the W4 band, but this should not be a large issue since the AGN contribution in Seyferts seems to be small.
Since the contribution of the AGN to the mid-infrared emission of Seyferts, and thus also NLS1s, seems to be small (Rosario et al. 2013), and NLS1s are known to be strongly star-forming galaxies, we can assume that in most cases the diagnostics we are using are pointing in the right direction. However, all the sources will be analysed individually, and all diagnostic tools, supplemented by any other information we have about these sources, will be used to draw a more complete picture of the situation.
5. Results
5.1. Significance of star formation
We implemented several diagnostics to study the contribution of the radio emission produced by star-formation-related processes in our sources, as described in Sect. 4. For the radio data we used the total intensity measured from the 60kλ map to include also possible faint extended emission, not visible in the normal or the 90kλ map. Keeping in mind the remarks in the previous section, we summarise the results here.
First, 25 out of 44 sources in our sample have W3–W4 > 2.5, indicating mid-infrared colours so red that they might be hard to explain only by AGN activity. If the red colour is indeed caused by star formation, it is probable that in these sources its contribution to the radio emission is significant as well. The result that more than half of our sources seem to have considerable star formation is well in agreement with the previous study by Sani et al. (2010). This result on its own does not mean that there is no strong AGN activity in these sources.
The second method was to use the q22 parameter to estimate whether the star formation can significantly contribute to the observed radio emission. We found that 26 out of 44 sources have q22 > 1. Most of the sources with W3–W4 > 2.5 also have q22 > 1, but there are some curious sources where this is not the case (see Table A.5). These sources on average have high radio flux densities; whereas the W3–W4 colour indicates star formation in these sources, the strong radio emission distorts the q22 value, which remains low or even negative. Indeed, the more widely used q24 is expected to be very low for radio-loud AGN (Ibar et al. 2008), and it cannot account for the effects of both AGN and star formation activity in a source. Thus, especially for NLS1s, where often a star forming host galaxy and jets can co-exist, no conclusions should be drawn from q22 values < 1.
The third method we used was to estimate the radio emission produced by star formation using mid-infrared data (Boyle et al. 2007). We used the WISE W3 flux density to estimate the radio emission from star formation at 1.5 GHz. We used a spectral index characteristic for star formation (α = −0.7) to extrapolate the 1.5 GHz estimate to 5.2 GHz. The comparison of the measured 5.2 GHz flux densities and the estimated 5.2 GHz flux densities is shown in Fig. 5. We decided to use only the CDFS estimate, since both estimates, CDFS and ELAIS, are very close to each other. It can be seen that a majority of our sources are clustered around the S5.2 GHz, CDFS = S5.2 GHz, JVLA line. This suggests that, assuming that the predominant source of the W3 band emission is star formation, in most of our sources these processes are enough to explain the bulk of the observed radio emission. Only in the sources clearly below the black line the CDFS estimate underestimates the radio emission, and these sources should have a major contribution from the AGN to explain the observed flux density. Interestingly, the mid-infrared colour W3–W4 does not seem to correlate with the position of a source in Fig. 5, indicating that there are some discrepancies between the diagnostics.
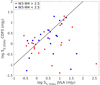 |
Fig. 5. 5.2 GHz flux densities estimated from the 22μm flux densities, and extrapolated from 1.5 GHz using α = −0.7 vs. measured JVLA 5.2 GHz flux densities. The error bars of the flux densities are smaller than the size of the markers and not shown. Sources with the WISE W3–W4 colour > 2.5, that is, sources that are unusually red and most likely to have enhanced star formation, are shown with filled red squares, and sources with the WISE W3–W4 colour < 2.5, that is, sources that are not unusually red, as filled blue circles. The black line denotes equal flux densities. S5.2 GHz CDFS and S5.2 GHz JVLA values close to each other means that the bulk of the radio emission can be explained by star formation processes, whereas the sources lying below the black line have excess radio emission. |
The fourth and final diagnostic is based on the direct comparison of the W3 and 1.4 GHz flux densities (Kozieł-Wierzbowska et al. 2021). Since our observations are at 5.2 GHz we extrapolated them to 1.4 GHz using the weighted total spectral index from the α map of each source. The comparison of the 1.4 GHz and the W3 flux densities is shown in Fig. 6. The sources above the black line ought to have strong star formation contribution, whereas only the sources below the line are expected to be dominated by the AGN radio emission. Also in this case, the mid-infrared colour does not seem to play a determinative role. This result is also in agreement with the other diagnostics, implying that a majority of NLS1s show enhanced star formation, even at levels where it can be the predominant source of the radio emission in the galaxy. However, it must be taken into account that the W3 flux density can be enhanced also due to excess mid-infrared emission from the torus or the polar dust.
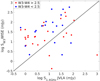 |
Fig. 6. WISE W3 flux densities vs. JVLA 1.4 GHz flux densities extrapolated from the 5.2 GHz flux densities using the total spectral indices from the α maps. The error bars of the flux densities are smaller than the size of the markers and are not shown. Sources with the WISE W3–W4 colour > 2.5, that is, sources that are unusually red and most likely to have enhanced star formation, are shown with filled red squares, and sources with the WISE W3–W4 colour < 2.5, that is, sources that are not unusually red, as filled blue circles. The black line denotes equal flux densities. Sources above the black line should have more contribution from star formation, whereas the sources below the black line should be dominated by AGN activity. |
Furthermore, methods 3 and 4 are in agreement with each other since all sources that are below the threshold shown by the black line in Fig. 6 are below the threshold also in Fig. 5. So, whereas it might be hard to tell the exact origin of the mid-infrared and the radio emission in sources with high W3 and W4 flux densities, the two diagnostics agree on the sources that are AGN-dominated. The properties of individual sources will be discussed in the next sections.
5.2. Notes on individual sources
The results for all sources in this study will be individually discussed in this section. Their general radio emission and radio morphological properties were extensively discussed in B18, and thus in this paper we concentrate on their spectral properties and investigating the origin of their radio emission. We note that throughout the rest of the paper we use the term ‘jet’ to refer to collimated outflows in general, since in most cases we have no way of estimating whether the jets are relativistic or not. We use ‘outflow’ to refer to non-collimated efflux. The luminosities of the sources are taken from B18 (their Table A.5). In addition we obtained the Pan-STARRS-1 i band optical images (Flewelling et al. 2020) of the host galaxies of our sources. We overlaid them with the 90kλ tapered radio map, and in some cases also the normal radio map, to give a better sense of the extent of their radio morphologies, and to investigate if there are some optical structures that match with the radio structures. For the sources with the highest redshifts this does not significantly add new information because the scales we are probing at high redshift are several kiloparsecs, and the host galaxies are usually not resolved either, but for consistency we decided to include them.
We use the radio loudness parameter to make our results comparable with the literature. However, in general we do not encourage its usage since it is an arbitrarily chosen threshold, and ambiguous for most of the sources (Padovani 2017; Järvelä et al. 2017). Whereas very radio-loud sources are more likely to host relativistic jet, there are examples of sources with no previous radio detection at low frequencies, but that were found to have relativistic jets (Lähteenmäki et al. 2018; Berton et al. 2020b; Järvelä et al. 2021), and also of sources whose star formation activity is so enhanced they appear radio-loud (Caccianiga et al. 2015). Thus, as convenient as it might be, we cannot use the radio loudness to deduce the properties of sources, but have to treat and study all of them individually.
Before going into the detailed discussion, a few remarks should be made. First, it turned out that the star formation diagnostics are not very reliable when it comes to NLS1s, unless the source is clearly dominated by the AGN. Thus we do not use these tools alone to draw any conclusions. This is further discussed in Sect. 6. In general, star forming galaxies, even starbursts, do not exceed a radio luminosity of log νLν, int = 40.0 erg s−1 (Sargsyan & Weedman 2009), which can thus be used as an additional proxy for the AGN dominance. Second, we use log νLν, int = 40.60 erg s−1 at 5.2 GHz as a threshold for ‘traditional’ CSS sources (O’Dea 1998). Low-luminosity CSS sources do not have a defined lower luminosity limit but we remark that, for example, the low-luminosity CSS sources in Kunert et al. (2002) were chosen to have a 5 GHz flux density > 150 mJy. Only one of our sources exceeds this, which makes the comparison between the low-luminosity CSS sources and NLS1s in this paper uncertain.
We list all the flux density and luminosity variables we use in Table 1. We give a summary of the radio morphology properties and the mid-infrared diagnostics in Table A.6. We remark that the data in this table is based only on this paper, for example, if a jet has been detected in previous observations, we do not list it in the table unless we detect it also at 5.2 GHz. We tentatively classify sources based on RCDFS = (S5.2 GHz, CDFS − Sint)/S5.2 GHz, CDFS), and RW3 = (SW3 − S1.4 GHz, JVLA)/SW3. Large negative values of RCDFS indicate that there is more radio emission in the source than what can be explained by star formation, while positive values suggest that the radio emission could be explained by star formation only. Large positive values of RW3 possibly indicate star formation as the predominant source of radio emission, while large negative values suggest that the AGN is the main radio emission source. The thresholds are given in Table 2.
Variables used in this paper.
Threshold for classifying the predominant source of the radio emission.
5.2.1. J0347+0105
J0347+0105 is a radio-quiet NLS1 at z = 0.031, previously studied with the JVLA in A configuration at 8.4 GHz by Thean et al. (2000). They found only a marginally resolved core with a flux density of 6.8 mJy. It was not detected at 22 GHz with very-long-baseline interferometry (VLBI; Doi et al. 2016), but the sensitivity of those observations was poor with a detection limit around 7 mJy. J0347+0105 has also been found to exhibit water maser emission (Tarchi et al. 2011), though its origin remains unclear.
Our radio map in Fig. B.1 does not show any significant structure. The integrated flux density is 11.65 mJy. Using the 8.4 GHz flux density by Thean et al. (2000), we derive a spectral index of −1.12. Our α map shows a consistently steep, but not quite that extreme, total spectral index of −0.73. The observations are almost 20 years apart, and the beam sizes are different, which probably causes the difference in the spectral indices. The tapered maps (Figs. B.3 and B.4) show a slightly elongated north-east/south-west structure, but the integrated flux density is only ∼0.5 mJy higher than in the normal map, so any extended emission is very faint. The host galaxy does not show any clear features either, and the radio emission is confined inside the host (Fig. B.5).
The W3 flux density (SW3) of this source is 203.5 mJy higher than the extrapolated 1.4 GHz flux density (S1.4 GHz, JVLA = 31.3 mJy) while the extrapolated CDFS 5.2 GHz flux density (S5.2 GHz, CDFS = 8.8 mJy) is slightly lower than the JVLA 5.2 GHz flux density (Sint). The q22 parameter is 1.22, and the W3–W4 is 2.29, not indicating extreme colours, although W3–W4 might be underestimated since the W3 emission is unusually high. The α map, with a spectral index characteristic of star formation, the high W3 flux density, and q22 > 1 imply that the contribution of star formation is very strong in this source. Since the star formation rate in this source has not been studied, an alternative explanation for the high mid-infrared flux densities can be equatorial or polar dust, since this source shows a prominent and turbulent [O III] wing with a velocity of −371 km s−1 and FWHM of 1074 km s−1. A CSS-like nature cannot be ruled out either without higher-resolution observations, but considering its luminosity, log νLν, int = 39.17 erg s−1, which is clearly below the usual CSS threshold, star formation seems the more plausible explanation.
5.2.2. J0629-0545
J0629-0545 (IRAS 06269-0543) is a radio-quiet NLS1 at z = 0.117 that has been identified as an ultra-luminous infrared galaxy (ULIRG; Zheng et al. 2002). Its integrated flux density is 14.58 mJy, with the flux density of the tapered maps approximately similar. It exhibits starburst level star formation at a rate of 183 M⊙ yr−1 derived from the CO(1-0) luminosity (Tan et al. 2019). This is evident also in our star formation diagnostics, as the W3–W4 colour is 2.88, q22 = 1.23, SW3 is 153.7 mJy higher than S1.4 GHz, JVLA (45.3 mJy). S5.2 GHz, CDFS and Sint are quite similar, 13.2 and 14.6 mJy, respectively, indicating that the radio emission might be dominated by star formation activity. It also shows a strong [O III] wing, with a velocity of −464 km s−1 and a FWHM of 1623 km s−1, so a contribution of AGN-heated dust to the mid-infrared brightness cannot be ruled out either. However, its radio luminosity, log νLν, int = 40.43 erg s−1, would be high even for a starburst galaxy, and thus it is plausible that radio emission is a combination of nuclear and star-formation-related processes. Tan et al. (2019) in ALMA observations find a rotating gas disk with ordered velocity gradient, indicating that the host (Figs. B.10 and B.11) is a disk galaxy that has not undergone any recent merger. They estimate the inclination of the disk to be 51 ± 10°.
The radio map of J0629-0545 (Fig. B.6) clearly shows two distinct components with a separation of 2.7 kpc. We assume that the brighter component is the core, since the north-eastern one is close to the edge of the host galaxy, as seen in Fig. B.11. These same features were also detected at 8.4 GHz in Moran (2000), but interestingly the north-eastern component is brighter in their observations. Unfortunately they do not give the flux densities of the single components so we cannot do any comparison. J0629-0545 was also detected in the National Radio Astronomy Observatory (NRAO) VLA Sky Survey (NVSS) with a flux density of 32.7 mJy, which gives a 1.4–5.2 GHz spectral index of −0.62. The α map in Fig. B.6 indicates steeper spectral indices: both the total and the core spectral indices are −0.92. We cannot say anything definitive about the spectral index of the north-eastern component, because the S/N of the data was not high enough to model it reliably. Moran (2000) reported an extremely steep spectral index of −2.2 between 1.4 and 8.4 GHz. They also found the source to exhibit variability, which might partly account for the discrepancy between their and our results. The nature of the north-eastern component is unclear but a strong blueshift of −550 km s−1 of the [O III] lines found in Zheng et al. (2002) suggests that the source has a jet, and, indeed, the asymmetry of the radio morphology might indicate an AGN origin for the north-east region, rather than a star-formation-related origin.
5.2.3. J0632+6340
J0632+6340 (UGC 3478) is a radio-quiet, nearby (z = 0.013) NLS1 with a modest integrated flux density of 2.83 mJy, and a low luminosity of log νLν, int = 37.76 erg s−1. The peak flux density is only 1.69 mJy beam−1, so a considerable fraction of the radio emission comes from the regions of extended emission. The radio map (Fig. B.12) shows a two-sided extended morphology, approximately at a PA of 40°. The extent of the whole emitting region is ∼1 kpc end-to-end, it is well confined within the bulge of its spiral host galaxy (Figs. B.16 and B.17), and seems to be aligned with its major axis. The tapered maps do not reveal any additional structures. The total spectral index of the source is −0.51 and the core spectral index is −0.63 (Fig. B.12).
J0632+6340 has a few archival detections, 22 mJy at 325 MHz in Westerbork Northern Sky Survey (WENSS), 12.8 mJy at 1.4 GHz in NVSS, and 1.4 mJy at 8.4 GHz in Very Large Array (VLA) observations (Kinney et al. 2000), based on which they also report seeing only an unresolved core, with an extent < 25 pc (Schmitt et al. 2001a). The spectral index seems to be steepening towards higher frequencies: Based on these archival observations, the spectral indices are −0.37 between 325 MHz and 1.4 GHz, −1.15 between 1.4 and 5.2 GHz, and −1.47 between 5.2 and 8.4 GHz. The 8.4 GHz observations were performed in the same configuration as ours, but their rms was higher (10 vs. 32 μJy beam−1), so they might have lost some of the extended emission seen in our map, which might steepen the spectral index. In addition, the beam difference might affect the measurements, making the higher-frequency flux densities appear lower. None of these observations are simultaneous either, so variability might affect the indices.
Schmitt et al. (2003) studied the extent of [O III] emission in this source, and found a morphology resembling ionisation cones (their Fig. 8). The PA of the [O III] emission is 55 degrees, roughly in agreement with the extended radio emission in our map. No blueshift is detected in the [O III] line profiles. The star formation rate of the host galaxy was found to be ∼1.9 ± 1 M⊙ yr−1 (Jackson et al. 2020). Our diagnostics support that there is ongoing star formation in the galaxy: the W3–W4 colour is 2.52, q22 = 1.65, SW3 is ∼91.5 mJy higher than S1.4 GHz, JVLA, and S5.2 GHz, CDFS is 1.49 mJy higher than Sint. J0632+6340 exhibits an [O III] wing with a shift of −290 km s−1 and a FWHM of 1000 km s−1, and thus polar, or otherwise AGN-heated, dust can be responsible for a fraction of the observed mid-infrared emission. Due to the low redshift of the source, we are able to examine only the centremost region in our observations. Because of the array configuration used for our observations, any radio emission originating further out in the galaxy may be resolved out, and thus the flux density might be underestimated. Moreover, the peculiar radio morphology is not compatible with the circumnuclear star formation usually seen in NLS1s. Since it does not seem probable that this source hosts relativistic jets, the radio morphology can be explained by either non-relativistic jets or outflows produced by nuclear winds. The non-collimated morphology and the spectral index steepening towards higher frequencies would point to the presence of an outflow in J0632+6340. The presence of an [O III] wing also supports the existence of nuclear outflows in this source.
5.2.4. J0706+3901
J0706+3901 (FBQS J0706+3901) is a radio-quiet NLS1 at z = 0.086 with a modest Sint of 2.14 mJy. The flux densities of the tapered maps are approximately the same, and the luminosity is moderate with log νLν, int = 39.33 erg s−1. It does not show any resolved structure in any of the maps (Figs. B.18, B.20, and B.21). Its total and core spectral indices are around −0.8, consistent with either optically thin synchrotron emission or star formation. The W3–W4 colour is 2.55, suggesting star formation activity. SW3 is ∼5.1 mJy higher than S1.4 GHz, JVLA, which is a considerable difference, taking into account the modest flux density values of the source, but it does not necessarily imply very strong star formation. Also, q22 is only 0.70. S5.2 GHz, CDFS is only 0.55 mJy and is thus somewhat lower than Sint. The [O III] of J0706+3901 does not have a wing component at all, so polar dust might not be present, but equatorial dust still can be. The radio emission is confined within a seemingly featureless host galaxy, as seen in Fig. B.22, consistent with the star formation explanation. However, with these data it is impossible to distinguish the AGN and star-formation-related components from each other; higher-resolution observations will be needed to achieve that.
5.2.5. J0713+3820
J0713+3820 (FBQS J0713+3820) is a radio-quiet NLS1 at z = 0.123 with a peak flux density of 2.32 mJy, integrated flux density of 3.39 mJy, and 60kλ tapered map flux density of 3.80 mJy, and thus a considerable amount of the emission originates from extended regions. The radio luminosity is moderate with log νLν, int = 39.82 erg s−1. The α map (Fig. B.23) shows a steep spectral index around ∼ − 1.0 throughout the emitting region. This source has been detected in WENSS (25 mJy) and FIRST (10.78 mJy), yielding spectral indices of −0.57 between 325 MHz and 1.4 GHz, and −0.88 between 1.4 and 5.2 GHz. Therefore, based on these spectral indexes, it seems as if the spectrum steepens towards higher frequencies, but the effect of different beam sizes is unknown. J0713+3820 was not detected at 22 GHz in VLBI observations (Doi et al. 2016).
Mid-infrared data indicate that there is star formation going on in the host as the W3 flux density is 85.2 mJy higher than the extrapolated 1.4 GHz flux density, and the q22 parameter is 1.19. S5.2 GHz, CDFS and Sint are about the same (3.7 vs. 3.8 mJy), so based on this diagnostic there is no need for other sources of radio emission beyond star formation. The W3-W4 colour though is only 2.28. The extended, somewhat patchy, morphology of the radio emission, covering the whole host galaxy (Fig. B.27), supports the presence of star formation in the host. The source shows an [O III] wing component shifted by −742 km s−1 with respect to the line core, and thus the contribution of polar dust to the mid-infrared flux densities is a possibility. It is worth noting that the FWHM of the wing component is 1495 km s−1, indicating strong turbulence in the gas where the line originates.
Interestingly, this source exhibits a considerable redshift of 300 km s−1 in its [O III] lines (Berton & Järvelä 2021). Like mentioned before, the [O III] wing is blueshifted relative to the [O III] line core. It is known that [O III] wings often arise due to nuclear winds, but they are usually accompanied by blueshifted [O III] lines, which is not the case with J0713+3820. It might be that the redshifted [O III] core and the blueshifted [O III] wing arise from kinematically separate regions. Unfortunately, our data are not enough to pinpoint and resolve the [O III] emitting regions, and further observations, especially by means of integral field spectroscopy, will be necessary to unravel the nature of this source.
5.2.6. J0804+3853
J0804+3853 (FBQS J0804+3853) is a radio-quiet NLS1 at z = 0.212 with a low peak flux density of 0.37 mJy beam−1, and an integrated flux density of 0.81 mJy, so more than half of the radio emission comes from extended regions. This is evident also in the radio map in Fig. B.28, where an asymmetric emitting region with an extent of 4.1 kpc towards the east-south-east is seen. The host galaxy does not have any distinct features, and the radio emission is confined within it (Fig. B.32). J0804+3853 was detected in FIRST with a flux density of 2.68 mJy, giving a 1.4–5.2 GHz spectral index of −0.91, which is consistent with the α map of the source in Fig. B.28: the total spectral index of the source is −0.98. J0804+3853 has a moderate luminosity of log νLν, int = 39.69 erg s−1.
Caccianiga et al. (2015) estimate the star formation rate in this galaxy to be as high as 89 M⊙ yr−1, and our star formation proxies are in good agreement with this. The W3–W4 colour is 2.70, q22 is 1.36, SW3 is 16.0 mJy higher than S1.4 GHz, JVLA, and S5.2 GHz, CDFS and Sint are roughly the same. It seems as if the star formation activity can account for most of the radio emission in this source, but the asymmetric radio morphology seems unusual for a star forming galaxy and instead resembles a morphology seen in sources with nuclear winds. Indeed, this source shows an [O III] wing with a velocity of −388 km s−1 and a FWHM of 760 km s−1, which supports the presence of nuclear winds. If the mid-infrared emission is enhanced by the AGN-heated dust, the star formation might not be that strong after all. More observations will be needed to determine the components that contribute to the radio emission in this source.
5.2.7. J0806+7248
J0806+7248 (RGB J0806+728) is a moderately radio-loud NLS1 at z = 0.098 with a rather steep total spectral index of −0.96, as seen in its α map in Fig. B.33. Its integrated flux density of 11.46 mJy is similar to the flux density in the tapered maps (Figs. B.35 and B.36). J0806+7248 does not show any resolved structure in any of the maps. Its host galaxy does not show any resolved features, and the radio emission is constrained within the host (Fig. B.37).
This source has been extensively studied in the past. Gregory & Condon (1991) performed observations with the 91 m Green Bank radio Telescope (GBT) at 4.85 GHz and reported that J0806+7248 had a flux density of 31 mJy. The observations were done in 1987. A few years later, Becker et al. (1991) reported a flux density of 29 mJy at 4.85 GHz with the GBT. In the early and mid-1990s J0806+7248 was observed in the NVSS at 1.4 GHz with a flux density of 50 mJy (Condon et al. 1998), and at 5 GHz with the VLA showing a flux density of 20 mJy (Laurent-Muehleisen et al. 1997). We can estimate that the spectral index of J0806+7248 in the early 1990s was ∼ − 0.7.
Doi et al. (2007) observed J0806+7248 with the Japanese VLBI Network (JVN) at 8.4 GHz. They obtained a flux density of 6.9 mJy, and a brightness temperature, TB, of > 107 K, indicating a non-thermal origin of the radio emission. The source shows a slightly extended structure at the milliarcsecond scale of the observations, but no clear morphology is seen. J0806+7248 was later observed with the Very Long Baseline Array (VLBA) at 1.7 GHz (Doi et al. 2011), obtaining a flux density of 23 mJy, and TB of > 108.7, unquestionably confirming the non-thermal origin of the radio emission. It exhibits a remarkable elongated structure (100 pc) with regions that have TB > 108 K, allowing this structure to be identified as a jet. Some signs of a possible counter-jet are also seen. What is interesting is that Doi et al. (2011) estimate its spectral index using JVN and VLBA observations to be −0.94 ± 0.42, which is well in agreement with our core spectral index of −0.99, and with what is seen in its α map. Furthermore, J0806+7248 is found to be a blue outlier by Berton & Järvelä (2021) with the [O III] lines blueshifted −300 km s−1, which is consistent with the presence of a relativistic jet. A wing is also present, with a velocity of −426 km s−1and a FWHM of 733 km s−1.
It is striking that it looks like the flux density of J0806+7248 has been decreasing since the first observations, whereas its spectral index seems to have remained consistently very steep. Combined with the non-thermal origin of its radio emission and a rather high luminosity (log νLν, int = 40.17 erg s−1), it seems safe to assume that it really is a CSS-like source. The star formation indicators also support this conclusion. The W3–W4 colour is at the threshold with 2.57, but q22 is very low (0.11) and Sint is some tens of mJy higher than SW3 or S5.2 GHz, CDFS, confirming that the radio emission cannot be explained only by star formation.
5.2.8. J0814+5609
J0814+5609 (SDSS J081432.11+560956.6) is a radio-loud NLS1 galaxy (z = 0.510) that shows an impressive core-jet morphology as seen in Fig. B.38. The peak flux density is 25.85 mJy, the integrated flux density is 29.27 mJy, and the flux densities of the tapered maps (Figs. B.40 and B.41) are less than 1 mJy more. It is one of the most luminous sources in our sample with log νLν, int = 42.19 erg s−1. The core shows a flat spectral index, very close to zero (Fig. B.38), and the jet shows throughout spectral indices in agreement with optically thin synchrotron emission, or slightly steeper. The spectral index of the brightening in the middle of the jet (RA 08:14:32.48, Dec 56:09:55.07) is −0.45. This region seems to be slightly flatter than the jet in general, possibly due to interaction or shocks that are also responsible for the increased radio emission. Interestingly, there seems to be a hotspot with an inverted spectral index near the unresolved core, but taking into account the edge effects and that it is within only a 6σ contour its presence needs to be verified with further observations. Most of the extended emission is clearly outside the seemingly featureless host galaxy, as seen in Figs. B.42 and B.43. The Sloan Digital Sky Survey (SDSS) r band 25.0 mag arcsec−2 isophotal semi-major axis of the host is 8.6 kpc, whereas the maximum extent of the jet towards the south-east is ∼34 kpc. The jet exhibits a considerably bent structure outside the host, but without a proper characterisation of the morphology of both the jet and the counter-jet, it is impossible to say whether the bend is due to jet precession, or dissipation of the jet when it fails to be fed enough to maintain its direction. The [O III] lines of J0814+5609 show a significant blueshift of −590 km s−1, but no wing component is present (Berton & Järvelä 2021).
In the tapered maps in Figs. B.40 and B.41, a counter-jet is also seen, but, due to the decreased resolution caused by tapering, nothing can be said about its morphology. However, since both jets are detected, we can estimate the inclination of the system by using their flux density ratio (Scheuer & Readhead 1979):
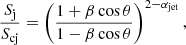 (5)
(5)
where Sj and Scj are the flux density of the jet and the counter-jet, respectively, β = v/c (i.e., the speed of the jet relative to the speed of light), θ is the viewing angle, and αjet is the spectral index of the jet, which we assume to be −1. We fitted the core of the 60kλ tapered map with a Gaussian component using the imfit task in CASA, and measured the flux densities of the jet and the counter-jet from the residual map. The flux density ratio we obtain is ∼5.34. Even if a jet would be relativistic when launched, it usually decelerates to non-relativistic velocities at kiloparsec scales. Unfortunately we do not have a way to estimate its velocity, but based on its morphology that does not stay properly collimated for long, we can assume that the jet is not relativistic at kiloparsec scales. Estimating the PA using reasonable velocities can still give us information about the inclination of the source and the range of the possible de-projected extents of the jets. Assuming a very moderate β = 0.3 c the viewing angle is 24.9°, and assuming β = 0.5 c gives θ = 57.0°. Without more exact measurements of the jet speed, for example, with higher-resolution monitoring closer to the nucleus, we cannot determine the inclination accurately. However, these approximate results show that J0814+5609 cannot be a very low inclination source, whose permitted emission lines would be narrow due to orientation effects, but is a real NLS1. The projected length of the south-east jet in the 60kλ tapered map is 41 kpc, and of the western counter-jet 61 kpc. It is interesting that the counter-jet seems more extended than the approaching jet. This might happen due to the bend that shortens the maximum extent of the approaching jet, whereas it might be that the counter-jet is straighter. Assuming a viewing angle of 24.9°, the de-projected sizes of the jet and the counter-jet would be 97.4 and 144.9 kpc, respectively, and with θ = 57.0° the de-projected sizes would be 48.9 and 72.7 kpc. With a somewhat unrealistically high β of 0.8 c θ would be 70.1°, and the de-projected sizes still 43.6 and 64.9 kpc, making J0814+5609 the most extended NLS1s known to date (Rakshit et al. 2018).
As expected from a jetted source, the mid-infrared emission is swamped by the radio emission in this source: The W3–W4 is 1.98, q22 is −0.99, and Sint and S1.4 GHz, JVLA are both considerably higher than the respective S5.2 GHz, CDFS and SW3.
In previous studies J0814+5609 has been found to show a flat spectral index all the way from 325 MHz to at least 8.4 GHz. Gu et al. (2015) observed J0814+5609 with the VLBA at 5 GHz, and also analysed archival data at 2.3, 5.0, 8.4 GHz. The source exhibits at all frequencies an elongated structure towards the east, consistent with our map, but in their observations any larger-scale extended emission was probably resolved out. Furthermore, they detect considerable variability at 5 GHz, which, assuming a flat spectral index above 8.4 GHz, seems to also be present at higher frequencies since Doi et al. (2016) detected the source with the JVN at 22 GHz with a flux density of 117 mJy.
5.2.9. J0913+3658
J0913+3658 (RX J0913.2+3658) is a radio-quiet NLS1 at z = 0.107 with sub-mJy radio emission: Sint is only 0.30 mJy, and S90kλ, int is 0.41 mJy. The total spectral index of the source is −0.77 and of the core −0.99 (Fig. B.44). The source has been earlier observed at 1.4 GHz in FIRST with a flux density of 1.08 mJy (Becker et al. 1995). This gives a spectral index of −0.78 between 1.4 and 5.2 GHz, in agreement with our α map. The tapered maps in Figs. B.46 and B.47 show diffuse emission, more extended than what is seen in the normal map (Fig. B.44). The source has a low luminosity (log νLν, int = 38.66 erg s−1), a reddish W3–W4 colour (2.55), and quite high q22 (1.67). Its S5.2 GHz, CDFS is about double of its Sint, whereas its W3 flux density is 15.7 mJy higher than its S1.4 GHz, JVLA. This is indicative of strong star formation, which is probably the predominant source of radio emission in this source. Nonetheless, an [O III] wing is present with a velocity of −307 km s−1 and a FWHM of 800 km s−1, possibly indicating also the presence of polar dust in this source. Its host galaxy, seen in Fig. B.48, appears to be a barred spiral galaxy. The radio emission is concentrated around the centre, possibly the bulge, and partly along the bar to the south from the bulge. The overlapping optical and radio features are in agreement with the star formation scenario. The host galaxy might be accompanied by a small companion on its south side, but this should be confirmed by means of spectroscopic observations.
5.2.10. J0925+5217
J0925+5217 (Mrk 110) is a radio-quiet NLS1 at z = 0.035 with quite a low luminosity of log νLν, int = 38.72 erg s−1. At 5.2 GHz we detected a peak flux density of 1.70 mJy beam−1, an integrated flux density of 2.25 mJy for the central emitting region, and of 0.17 mJy for the northern emitting region (Fig. B.49). The flux density of the tapered maps is 3.10 mJy. J0925+5217 shows considerable extended emission in the radio maps. In the normal map (Fig. B.49) a separate emitting region is seen towards the north, and in the tapered maps (Figs. B.51 and B.52) the radio emission is especially extended towards the south. The projected separation of the northern region is 1.7 kpc, and it corresponds to the structures seen already in Miller et al. (1993) at 4.86 GHz with the VLA. They detect a total flux density of 3.8 mJy, slightly higher than ours, and propose that the radio morphology is consistent with circumnuclear star formation. Kellermann et al. (1994) also detected the same structure at 5 GHz with the VLA and discuss its nature as ‘a highly curved jet or ringlike structure’. The extended northern emission is also seen at 1.4 GHz with the VLA, but only the central source is seen at 8.4 GHz (Kukula et al. 1998), indicating it might have a steep spectral index. At 1.7 GHz with VLBA only an unresolved core with a flux density of 1.2 mJy was detected (Doi et al. 2013). They derived the brightness temperature to be at least 107.8 K, indicating an origin of non-thermal nature.
In the 60kλ tapered map the extent of the radio emission towards the north is 2.8 kpc, and towards the south 4.7 kpc. Also possible emission towards the west at a separation of 3.3 kpc is seen. It is hard to say whether it is real, but it is also seen in the normal map, at a 5σ level. The SDSS r band 25 mag arcsec−1 isophotal semi-major and semi-minor axes of the host galaxy are 8.9 kpc and 4.9 kpc, and the major axis of the galaxy is almost perpendicular to the radio emission. Towards the south, the radio emission is reaching the very outskirts of the host, even though it looks like the emission is more extended in radio than in optical. This is because the outskirts of the galaxy are faint, and higher contrast image would be needed to see it clearly. The host itself does not seem to exhibit any clear features (Fig. B.53), although in some higher contrast images a disturbed morphology with apparent tidal features can be seen, possibly indicating a recent merger. The other bright source seen in the optical image is a foreground star (Hutchings & Craven 1988).
In our α map, the northern region has an inverted spectral index, which may not be real but possibly caused by a low S/N ratio in such a small emitting region. The core is flat with a spectral index of −0.33, consistent with the non-thermal origin of the radio emission. J0925+5217 was detected in FIRST with a flux density of 8.19 mJy, yielding a very steep spectral index of −0.93 between 1.4 and 5.2 GHz. Thus, whereas the core is flat, the overall spectral index of the source seems to be rather steep. Although, if the radio emission is dominated by the central AGN, variability can explain the spectral index since the observations are not simultaneous.
Miller et al. (1993) identified the extended radio emission towards the north as possible circumnuclear star formation and there is indeed an excess of mid-infrared emission compared to radio emission, W3 flux density is 59.8 mJy higher than S1.4 GHz, JVLA, q22 is 1.35, and S5.2 GHz, CDFS and Sint are roughly the same. However, the colour W3–W4 is not very red with a value of 2.01. The radio emission probably has contribution from both, the star formation and the AGN, since also a non-thermal core was detected and the spectral index of the central region is flat, uncharacteristically for a star-forming region. However, based on these data it is impossible to determine the origin of the large-scale radio emission seen in the tapered maps. Its radio morphology is not common for star-forming regions, unless it is somehow related to the possible recent merger of the host galaxy. Furthermore, an accretion disk wind causing an outflow of the BLR has been detected (Kollatschny 2003), though [O III] lines are not shifted nor show a wing, suggesting that the wind has not affected the NLR, at least yet, or it is not energetic enough to cause bulk motion of the NLR. Further observations of J0925+5217 are needed to determine the origins of the radio emission at different scales.
5.2.11. J0926+1244
J0926+1244 (Mrk 705) is a radio-quiet NLS1 (z = 0.029) with a low luminosity of log νLν, int = 38.52 erg s−1. The peak flux density is 2.81 mJy beam−1, the integrated flux density 3.36 mJy, and the flux densities of the tapered maps minimally higher. The radio morphology seen in Fig. B.54 looks peculiar: the central component seems to be surrounded by patches of radio emission on all sides. The spectral index of the core is −0.75, and the total spectral index is −0.59. The FIRST flux density for J0926+1244 is 8.52 mJy, giving a 1.4–5.2 GHz spectral index of −0.71, well in agreement with our result. The spectral indices of the surrounding patchy emitting regions seem flat, but most likely are not reliable due to edge effects and low S/N ratio. The extended emission seen in the map is approximately within 1 kpc of the centre, except the south-west emission, better seen in the tapered maps in Figs. B.56 and B.57, which is more extended.
VLBA observations at 1.7 GHz show a core-jet structure, with the jet extending 26 pc east from the core (Doi et al. 2013). The total flux density detected was 3.3 mJy, so a significant fraction of the flux was resolved-out or is seen only at larger scales. They derived a brightness temperature of at least 107.9 K, confirming the non-thermal nature of the emission. In archival Multi-Element Radio Linked Interferometer Network (MERLIN) observations at 1.7 GHz at 150 mas resolution, only single component with a flux density of 5.7 mJy beam−1 was seen. Also, 8.46 GHz VLA observations yield only an unresolved core with a flux density of 2 mJy (Schmitt et al. 2001b). This gives a 5.2–8.46 GHz spectral index of −1.07, steeper than what we observe. Although it should be noted that the observations are more than a decade apart, and since the source hosts a jet, variability is likely to affect the flux densities. Interestingly, the source does not show shift of [O III] lines (Berton & Järvelä 2021), possibly due to the small scale or low power of the jet.
The host galaxy of J0926+1244 (Fig. B.58) was indeed classified as (R)SA(r)0+ in the Comprehensive de Vaucouleurs revised Hubble-Sandage (CVRHS) classification scheme in Buta (2017). This classification indicates that it is a SA type spiral galaxy that has an outer as well as an inner ring. The 5.2 GHz radio emission is concentrated within the innermost part of the host, probably a bulge. The star formation rate of the host galaxy based on 11.3 μm PAH features was estimated to be as low as 0.6 ± 0.2 M⊙ yr−1 (Martínez-Paredes et al. 2019). On the other hand, based on the relation between the star formation rate and the luminosity of the [C II] line (Sargsyan et al. 2012, 2014) it can be estimated to be much higher, 6.6 M⊙ yr−1. Our star formation diagnostics support the presence of star formation as the W3 flux density is ∼101.6 mJy higher than S1.4 GHz, JVLA, q22 is 1.54, a nd S5.2 GHz, CDFS and Sint are almost the same. However, the mid-infrared colour with W3–W4 = 2.36 does not necessarily indicate strong star formation. The [O III] shows a low-velocity, −79 km s−1, but turbulent, FWHM = 846 km s−1, wing component, and thus the contribution of polar, or equatorial, dust cannot be ruled out either.
In conclusion, despite the presence of a small-scale jet, the star formation seems to be the predominant source of radio emission in this source. However, further observations are needed to disentangle the contribution of different components.
5.2.12. J0937+3615
J0937+3615 (SDSS J093703.03+361537.2) is a radio-quiet NLS1 at z = 0.180 with a moderate integrated flux density of 1.03 mJy, and the flux densities of the tapered maps (Figs. B.61 and B.62) slightly lower. It is a moderate luminosity source with log νLν, int = 39.71 erg s−1 and does not show any distinct morphology in any of the maps. The radio emission is constrained within its host galaxy, which does not show distinguishable features either. J0937+3615 was detected in FIRST with a flux density of 3.21 mJy, yielding a 1.4–5.2 GHz spectral index of −0.87. This is in agreement with our α map in Fig. B.59: the total spectral index is −0.77, and the core spectral index is −0.95. Caccianiga et al. (2015) estimate that the star formation rate in J0937+3615 is extremely high (83 M⊙ yr−1), and possibly the predominant source of its radio emission. Other star formation diagnostics support this conclusion: its W3–W4 colour is 2.66, q22 is 1.34, S5.2 GHz, CDFS and Sint are roughly the same, but SW3 is 15.2 mJy higher than S1.4 GHz, JVLA. However, it also might exhibit nuclear winds and polar dust, since it has an [O III] wing with a velocity of −250 km s−1, and with a FWHM of 1000 km s−1.
5.2.13. J0952-0136
J0952-0136 (Mrk 1239) is a radio-quiet NLS1 at z = 0.020 that has been widely studied in the past. It has one of the highest flux densities in our sample, the peak flux density is 17.49 mJy beam−1, the integrated flux density is 18.54 mJy, and the flux densities of the tapered maps about 0.5 mJy higher. Due to its low redshift this translates to a moderate luminosity of log νLν, int = 39.04 erg s−1. Our radio map (Fig. B.64) shows a compact component and almost symmetrical extended emission towards the north-east and south-west at a position angle of 32°. The extended emission is particularly pronounced in the tapered maps in Figs. B.66 and B.67. The whole extent of the emission in the 60kλ tapered map is 4.2 kpc. The spectral index of the source is very steep, the total spectral index is −0.98, and the core spectral index is −1.07.
J0952-0136 was detected at 2.25 GHz with the Parkes-Tidbinbilla Interferometer (PTI) with a flux density of 32 mJy (Norris et al. 1990), and with the VLA in A configuration at frequencies of 1.5, 5, and 8.4 GHz with flux densities of 56.5, 19.5, and 7.9 mJy, respectively (Ulvestad et al. 1995). The source remained unresolved in all these observations. These observations point to a spectral index steepening towards higher frequencies, a feature that was explained to be possibly due to the combination of different resolution at each frequency, and the dominance of diffuse components in this source (Doi et al. 2013). Our 5.2 GHz flux density is in agreement with the 5 GHz observation in Ulvestad et al. (1995), and the FIRST detection of the source (59.84 mJy) at 1.4 GHz is roughly in agreement with their 1.5 GHz result.
Orienti & Prieto (2010) reduced archival VLA data of J0952-0136 at 8.4 and 14.9 GHz, and found an unresolved morphology at both frequencies. Further, they produced a VLBA map at 1.6 GHz and were able to see two separate components with a separation of ∼30 pc at a position angle of 40 deg. The total flux density they obtained is only 10.2 mJy, meaning that most of the flux is missing at the VLBA scale.
Later, also Doi et al. (2013) observed the source with the VLBA at 1.7 GHz obtaining a core flux density of 4.8 mJy, and a total flux density of 20 mJy. Their map shows an elongated 40 pc long structure consisting of several components at a position angle of 47°. They estimated the brightness temperature to be 107.9 K, proving the non-thermal origin of the emission. They also claimed to have found a corresponding structure at 8.5 GHz using archival VLA observations. They further studied the source in Doi et al. (2015) where they report that it shows a two-sided jet-like morphology, extended ∼34 pc to both directions. They also re-analyse archival 1.6 and 8.5 GHz VLA data and find an elongation on one side of 1.4 kpc and 85 pc, respectively, with a position angle matching the pc-scale jet. Since most of the radiated power is concentrated within the innermost 100 pc, they conclude it is alike to Fanaroff-Riley I radio galaxies (i.e., edge-darkened)5. They suggest that the edge-darkened morphology may be caused by the subsonic speed of advancing radio lobes, and the origin of the diffuse radio emission might be a dissipated jet, not powerful enough to penetrate the dense circumnuclear matter. J0952-0136 was not detected at 22 GHz with the JVN (Doi et al. 2016), which could have been expected taking into account its steep spectral index.
It seems plausible that we are seeing the same structure that was detected in previous observations, in which case the main origin of the radio emission would be a low-power two-sided jet. However, also the presence of star formation in this galaxy has been studied quite extensively. The host galaxy (Fig. B.68) was originally classified as compact (Whittle 1992), and later as S0/E (Heisler & Vader 1994). Its SDSS r band 25 mag arcsec−2 isophotal semi-major axis is 2.9 kpc, and its almost perpendicular to the radio axis. Rodríguez-Ardila & Viegas (2003) studied the near-infrared spectrum of J0952-0136 and detected a 3.43 μm feature whose origin remained unclear. They re-observed the 0.8–4.5 μm near-infrared spectrum and did not detect the 3.43 μm line, or any PAH features (Rodríguez-Ardila & Mazzalay 2006). Based on the 11.3 μm PAH feature Ruschel-Dutra et al. (2017) estimate the star formation rate to be less than 7.5 M⊙ yr−1. Consistent with this its star formation rate was estimated to be 3.47 M⊙ yr−1 based on SED modelling (Gruppioni et al. 2016). Buhariwalla et al. (2020) model the X-ray spectrum of J0952-0136 with alternative models and find that the < 3 keV emission cannot be modelled without a starburst component, whose extent they estimate to be less than 400 pc from the nucleus. This is interesting since the other star formation proxies do not predict starburst level star formation. However, the PAH emission can be suppressed in presence of an AGN (LaMassa et al. 2012). The presence of star formation seems to be supported by the W3 flux density that is 520.2 mJy higher than the S1.4 GHz, JVLA, and q22 of 1.16, while the S5.2 GHz, CDFS and Sint are roughly the same. On the other hand, the W3–W4 colour is not very red (2.02), and the presence of an [O III] wing with a velocity of −686 km s−1 and a FWHM of 1586 km s−1 indicates that AGN-heated dust could be partly responsible for the very high mid-infrared flux densities. In Mulchaey et al. (1996) the [O III] emission was found to be clearly elongated in the north-east to south-west direction, matching the position angle of the radio emission.
5.2.14. J1034+3938
J1034+3938 (KUG 1031+398) is a radio-quiet NLS1 at z = 0.042 with a peak flux density of 7.05 mJy beam−1, integrated flux density of 7.37 mJy, and the tapered map flux densities only slightly higher. It has a moderate luminosity of log νLν, int = 39.24 erg s−1. Its FIRST flux density is 25.94 mJy, yielding quite a steep 1.4–5.2 GHz spectral index of −0.96. However, it is consistent with the α map (Fig. B.69) of the source: the total spectral index of the source is −1.17, and the core spectral index is −1.13. The VLBA the flux density at 1.4 GHz was found to be 8.34 mJy (Deller & Middelberg 2014), indicating that most of the emission was resolved out and thus comes from larger scales. The normal map (Fig. B.69) shows a morphology only slightly extended towards the south-east. In the tapered maps (Figs. B.71 and B.72) an asymmetric east-west structure is seen. Especially the eastern extended emission seems to trace the morphology of the spiral host galaxy, seen in Fig. B.73, as it seems to overlap with a spiral arm. The most obvious explanation for the extended emission seems to be star formation, even though using simple stellar population synthesis the star formation rate of J1034+3938 was found to be as low as 0.23 M⊙ yr−1 (Bian & Huang 2010). The W3 flux density is indeed 33.7 mJy higher than S1.4 GHz, JVLA, but could be also explained by the dust heated by the AGN. Smethurst et al. (2019) detect an [O III] outflow in this source, and estimate the outflow rate to be > 0.07 M⊙ yr−1. Berton & Järvelä (2021) does not detect a blueshift of the [O III] lines but an [O III] wing is present with a velocity of −253 km s−1, and a FWHM of 901 km s−1. Other star formation proxies do not indicate strong activity, W3 − W4 is 2.14, q22 is 0.57, and S5.2 GHz, CDFS is 5.4 mJy lower than Sint. Thus, the radio emission seems to be dominated by the AGN, with star formation – based on the morphology – having a small contribution.
J1034+3938 is one of the NLS1s showing the most prominent soft excess in X-rays (Pounds et al. 1995), and interestingly, it is one of the rare AGN where a quasi-periodic oscillation (QPO) has been reported in X-rays, and, in fact, the only source showing the QPO with high significance and repeatability (Jin et al. 2021, and references therein).
5.2.15. J1038+4227
J1038+4227 (SDSS J103859.58+422742.3) is a radio-loud source at z = 0.220 with very pronounced diffuse extended emission (Fig. B.74). Its integrated flux density is 3.75 mJy, and S90kλ, int is 5.36 mJy, showing that a large fraction of the emission is very low surface brightness. Its central region exhibits a steep spectral index with α = −0.77, and the total spectral index is −0.89. Unfortunately, the extended emission does not have a high enough S/N to estimate the spectral index outside the centre. J1038+4227 was detected at 1.4 GHz in the FIRST and in the NVSS with flux densities of 2.44 mJy and 7 mJy, respectively. The FIRST measurement underestimates the flux density because it might not have had high enough sensitivity to detect the faint extended emission.
The star formation diagnostics do not indicate strong activity: the W3–W4 colour is 2.29, q22 is 0.57, and both SW3 (9.0 mJy) and S5.2 GHz, CDFS (0.4 mJy) are lower than the respective JVLA values. However, this might be partly due to the sensitivity limit of WISE, whose 5σ point source sensitivity is estimated to be 0.86 and 5.4 mJy in W3 and W4 bands, respectively (Wright et al. 2010). Considering the diffuse nature of the emission seen in J1038+4227, a significant fraction of the mid-infrared emission could have gone undetected, leading to underestimated mid-infrared flux densities.
The spatial extent of the emission is huge, its most extended diameter in the normal map (Fig. B.74) is 9.4 arcsec, which corresponds to 33.4 kpc, and in the 60kλ tapered map 12.5 arcsec, corresponding to 44.4 kpc. An SDSS r band 25 mag arcsec−2 isophotal major axis estimate for its host galaxy is only ∼4 arcsec, or 14.2 kpc, clearly smaller than the extent of the radio emission. In the image of the host galaxy, overlaid with the 90kλ tapered radio map (Fig. B.78) it can be seen that the radio emission seems to reach well outside the host, forming a halo-like structure.
The source is bright, with log νLν, int = 40.67 erg s−1. In the normal map, most of the emission comes from the core, and thus its luminosity is at the CSS threshold. The steep spectral index of the core would also agree with this classification. The origin of the extended emission remains unknown, and this source certainly needs to be studied further to reveal its nature.
5.2.16. J1047+4725
J1047+4725 (SDSS J104732.68+472532.0) was cleaned using the uniform weighting to suppress the very strong sidelobes, but the normal radio map (Fig. B.79) still suffers from some artefacts around its peripheries. J1047+4725 at z = 0.799 is very radio-loud and the most luminous source in our sample with log νLν, int = 43.77 erg s−1. Its peak flux density is 190.90 mJy beam−1, and the integrated flux density is 381.75 mJy, with the integrated flux densities of the tapered maps being approximately the same; thus, about half of its radio emission comes from the unresolved core. Its W3–W4 colour is red (2.69) but clearly the AGN is the main origin of the radio emission since the q22 is −2.18, and the Sint and S1.4 GHz, JVLA are both several hundred mJy higher than the corresponding S5.2 GHz, CDFS and SW3 values. Its host galaxy does not exhibit any clear structures, and the radio emission seems to be confined within it (Fig. B.83).
Several radio measurements of J1047+4725 exist in the literature. Gu et al. (2015) observed it at 5 GHz with the VLBA, but were not able to resolve it. However, they also analysed archival VLBA data where a clear core-jet structure can be seen (see their Fig. 6). Furthermore, at 8.4 GHz observed with the JVLA the source exhibits a two-sided jet structure, implying a large viewing angle. However, the [O III] lines are not shifted, so the jets have not been powerful enough to cause bulk motion in the NLR. At 22.4 GHz only an unresolved core is seen. Gu et al. (2015) also note that based on archival data, which extends all the way down to 74 MHz (Cohen et al. 2007), it looks like the break frequency of the radio spectrum lies in the MHz regime, as often seen in CSS sources (see Fig. 17 in Gu et al. 2015). Above 1.4 GHz, the spectrum steepens to −0.5/−0.6; this is consistent with our α map in Fig. B.79, which has a core spectral index of −0.63 and a total spectral index of −0.75, as well as with the CSS characteristics (O’Dea 1998). It thus seems evident that J1047+4725 is a jetted NLS1 seen at quite a large angle and that it can also be classified as a CSS.
5.2.17. J1048+2222
J1048+2222 (SDSS J104816.57+222238.9) is a radio-quiet NLS1 at z = 0.330 with a very low integrated flux density of 0.24 mJy. The flux density of the 60kλ tapered map is 0.47 mJy, almost double compared to the normal map. Due to its redshift the low flux density corresponds to a moderate luminosity of log νLν, int = 39.75 erg s−1. It was detected in FIRST with a flux density of 1.49 mJy. This gives a very steep spectral index of −1.39 between 1.4 and 5.2 GHz. Our α map (Fig. B.84) does not suggest this steep an index, as the total spectral index is −0.56 and the core spectral index is −0.71. The map shows flattening towards the north, but in such a faint source it can be artificial. The normal map does not show considerable extended structure, but the tapered maps (Figs. B.86 and B.87) show an extensive, though very faint, region of emission towards the south-west. The maximum extent of the emission is 42.8 kpc, which places it clearly outside the host galaxy (see Fig. B.88) whose SDSS r band 25 mag arcsec−2 isophotal semi-major axis is 7.5 kpc. The bulk of the radio emission is confined within the host. What is the origin of the extended emission remains unclear based on the currently available data.
The star formation diagnostics of this source are not conclusive either. The q22 parameter is 1.09, the W3 flux density is 5.1 mJy higher than S1.4 GHz, JVLA, and S5.2 GHz, CDFS and Sint are about the same, but the W3–W4 colour is only 2.2. J1048+2222 is a blue outlier with the [O III] lines shifted by −209 km s−1, indicating that it might host a jet or a powerful nuclear outflow. The existence of an [O III] wing with a velocity of −531 km s−1, and a FWHM of 1239 km s−1 indicates that a nuclear wind is present in this source. The blueshifted [O III] lines, inconclusive star formation diagnostics, and the morphology of the radio emission indicate that the AGN is responsible for the most of the radio emission seen in this source.
5.2.18. J1102+2239
J1102+2239 (SDSS J110223.38+223920.7) is a radio-quiet NLS1 with a low integrated flux density of 0.70 mJy, and a slightly higher 60kλ tapered map flux density of 1.22 mJy. Owing to its redshift of 0.453 its luminosity is quite high, with log νLν, int = 40.47 erg s−1. It was considered as a possible gamma-ray emitting NLS1 in Foschini (2011), but the detection has not been confirmed. Its only archival radio detection is 1.80 mJy in FIRST. This gives a 1.4–5.2 GHz spectral index of −0.72, in agreement with the α map of the source (Fig. B.89) that has a total spectral index of −0.76. The α map is actually indicating even steeper spectral indices, flattening towards the north, but these might be edge effects combined with a low S/N ratio. However, it does exhibit blueshifted [O III] lines with a velocity of −565 km s−1, and a FWHM of 880 km s−1, as well as an [O III] wing with a velocity and FWHM of −750 and 1320 km s−1, respectively. So the NLR experiences bulk motions, probably induced by a jet or a wind.
The normal map in Fig. B.89 is mostly featureless. The tapered maps (Figs. B.91 and B.92) show extended, but faint, radio emission towards the west-south-west, but the emission is so weak that we cannot be certain it is real. The host is a late-type galaxy, significantly perturbed by merging with another disk galaxy (Olguín-Iglesias et al. 2020). Olguín-Iglesias et al. (2020) also detect an H II region that based on its spectrum belongs to the interacting system. Indeed, Caccianiga et al. (2015) find the star formation rate of this source to be at a starburst level with 302 M⊙ yr−1. This is somewhat supported by the star formation diagnostics: the W3–W4 colour is 2.66, SW3 is 3.6 mJy higher than S1.4 GHz, JVLA, and S5.2 GHz, CDFS and Sint are comparable, but q22 is only 0.81.
Based on these data, with the exception of the high luminosity and the outflow, it seems as if star formation has a major contribution to the radio emission of J1102+2239. In principle, the [O III] outflow could have been triggered by enhanced star formation that causes stellar winds resulting in outflows, or be a feature resulting from the interaction. However, usually the velocities and FWHMs of outflows induced by these processes are more moderate – from a few hundred to ∼500 km s−1 – than what is seen in the AGN-induced outflows (Harrison et al. 2012). It thus seems likely that the outflow is of AGN origin. This does not mean that a jet needs to be present, but taking into account the luminosity that is higher than usually seen in pure starburst galaxies, it seems that also the AGN is required to explain the observed radio emission.
5.2.19. J1110+3653
J1110+3653 (SDSS J111005.03+365336.3) is a radio-loud NLS1 at z = 0.629 with a peak flux density of 8.12 mJy beam−1, integrated flux density of 9.34 mJy, and the flux densities of the tapered maps about 0.5 mJy higher. It is one of the most luminous sources in our sample with log νLν, int = 41.89 erg s−1. Its radio map exhibits considerably extended emission towards the south-south-east (Fig. B.94), and the tapered maps (Figs. B.96 and B.92) show that the source is also extended towards the north, but the emission does not seem to be exactly axisymmetric, but lopsided to east. The extent of the southern emission in the normal map is 21.2 kpc, and the north-south extent of the whole emitting region in the 60kλ tapered map is 61.5 kpc. The SDSS r band 25.0 mag arcsec−2 isophotal semi-major axis of the host is 7.0 kpc, so the radio emission is reaching way outside the host (Fig. B.98).
J1110+3653 has been previously observed in the WENNS at 325 MHz and in FIRST at 1.4 GHz with flux densities of 45 and 20.83 mJy, respectively. This gives a spectral index of −0.53 between 325 MHz and 1.4 GHz, and −0.61 between 1.4 and 5.2 GHz, so the source seems to have an overall steep radio spectral index. In our α map (Fig. B.94) the core of the source is flat, with a spectral index of −0.10. The extended emission is steeper, with spectral indices around −0.5, or steeper.
In 5 GHz observations with the VLBA the extended emission is resolved-out and the source shows only an unresolved core with a flux density of 8.8 mJy (Gu et al. 2015). The brightness temperature was found to be at least 1010 K, suggesting non-thermal processes being responsible for the emission, but no extreme Doppler boosting. The source was not detected at 22 GHz with the JVN with a detection limit of 7 mJy (Doi et al. 2016).
J1110+3653 was not detected in W3 or W4 bands so we cannot say anything about the star formation activity in the host galaxy, as it has not been studied in the past either. However, all things considered, it seems rather evident that the AGN is responsible for the bulk of the observed radio emission. The extended emission resembles a jet that has propagated through the host and is possibly dissipating as it reaches the edge of the host. However, the possibility that the morphology could instead be caused by an outflow cannot be ruled out with these data. Interestingly, J1110+3653 does not show a blueshift in its [O III] lines, nor an [O III] wing component.
5.2.20. J1121+5351
J1121+5351 (SBS 1118+541) is a radio-quiet NLS1 at z = 0.103 with a moderate luminosity of log νLν, int = 39.25 erg s−1. Its peak flux density is 1.02 mJy beam−1, and the integrated flux density is 1.22 mJy, with the values for the tapered maps being only marginally higher. It was detected in the international Low-Frequency Array (LOFAR) survey at 144 MHz with a flux density of 11.49 mJy (Gürkan et al. 2019), and in FIRST with a flux density of 2.14 mJy. These yield a spectral index of −0.74 between 144 MHz and 1.4 GHz, and of −0.43 between 1.4 and 5.2 GHz. The α map of the source in Fig. B.100 shows a generally steep spectral index: the total spectral index is −0.61, and the core spectral index is −0.76. The normal radio map shows a slightly extended structure, but due to its triangular shape it is hard to say whether it could be artificial and caused by sidelobes. There is no hint of it in the tapered maps (Figs. B.102 and B.103), which instead show a faint extended structure towards the east-south-east. The bulk of the radio emission is confined within the featureless host galaxy (Fig. B.104).
The mid-infrared emission of J1121+5351 is enhanced, the W3 band flux density is 34.6 mJy higher than S1.4 GHz, JVLA, and q22 is 1.43. Also, S5.2 GHz, CDFS and Sint are comparable, but the W3–W4 colour is only 2.33. According to the conventional Baldwin-Phillips-Terlevich (BPT) diagnostic diagram (Baldwin et al. 1981), this source would be classified as a star forming galaxy (Stern & Laor 2013), but in a revised classification scheme by Shirazi & Brinchmann (2012) it is classified as an AGN-dominated galaxy. However, even in the latter scheme it is very close to the threshold of composite galaxies, and taking into account the earlier classification it seems safe to assume that both the AGN and star formation contribute to the ionising continuum. The mid-infrared emission can be further enhanced by the AGN-heated dust emission, since an [O III] wing, with a velocity of −208 km s−1 and a FWHM of 735 km s−1, can be seen in its optical spectrum. It seems as if star formation could also be the predominant source of the radio emission, but without further studies the possible AGN contribution cannot be ruled out.
5.2.21. J1138+3653
J1138+3653 (SDSS J113824.54+365327.1) is a radio-loud NLS1 at z = 0.356 with a peak flux density of 4.37 mJy beam−1, an integrated flux density of 4.64 mJy, with similar integrated flux densities of the tapered maps. Its luminosity is quite high with log νLν, int = 41.02 erg s−1. The radio map in Fig. B.105 does not show any resolved structures, and the radio emission is contained within the host galaxy (Fig. B.109). The total spectral index is −0.59 and the core spectral index is −0.68. J1138+3653 was detected in FIRST with a flux density of 12.64 mJy, which gives a spectral index of −0.76 between 1.4 and 5.2 GHz, consistent with what we find.
J1138+3653 shows considerable variability, since its flux density at 5 GHz in VLBA observations, a few years prior to our observations, was found to be 9.5 mJy (Gu et al. 2015). The source was not resolved in these observations. The brightness temperature was found to be at least 109.5 K, indicative of non-thermal processes being responsible for the radio emission, but with only mild beaming, possibly due to a slow jet speed or a large viewing angle. Were the latter true, it would mean that the spatial extent of J1138+3653 must have been very small at the time of the VLBA observations, since the resolution of their observations was ∼20 pc. Thus, the former explanation seems more plausible. J1138+3653 does not show a shift in its [O III] lines either, indicating that powerful, large-scale jet action is not present.
Interestingly, J1138+3653 was found to exhibit a significant amount of star formation (14 M⊙ yr−1, Caccianiga et al. 2015), though the star formation diagnostics employed in this paper do not reflect this. The W3–W4 colour is red (2.52), but the q22 is −0.28, and Sint is ∼4.5 mJy higher than S5.2 GHz, CDFS, and S1.4 GHz, JVLA ∼ 8.0 mJy higher than SW3, indicating that the radio emission is dominated by the AGN. According to its properties this source seems to be CSS-like.
5.2.22. J1159+2838
J1159+2838 (SDSS J115917.32+283814.5) is a radio-quiet NLS1 at z = 0.210 with a peak flux density of 0.79 mJy beam−1, and an integrated flux density of 0.84 mJy, with the tapered map showing approximately the same flux densities. Its radio maps (Fig. B.110) show a slightly elongated structure towards the south-west, but only at a 3σ significance level. No structures in the featureless host galaxy overlap with these radio contours (Fig. B.114). According to the α map (Fig. B.110) the spectral index is steep: the total spectral index is −0.71, and the core spectral index is −0.93. Calculating the spectral index between 1.4 and 5.2 GHz using the archival FIRST detection (2.01 mJy) gives −0.66, roughly in agreement with our α map.
Caccianiga et al. (2015) find that the star formation rate in J1159+2838 is 128 M⊙ yr−1, suggestive of starburst activity. The very red W3–W4 colour (3.03) supports this, as does the q22 of 1.22 and the W3 flux density, which is ∼5.8 mJy higher than the S1.4 GHz, JVLA. The Sint and S5.2 GHz, CDFS are roughly the same, indicating that significant contribution from the AGN is not needed to explain the radio emission. The luminosity of J1159+2838 is moderate with log νLν, int = 39.76 erg s−1. Starburst-level star formation activity seems to be the predominant source of radio emission is this galaxy.
5.2.23. J1203+4431
J1203+4431 (NGC 4051) is one of the most studied sources in our sample due to its proximity (z = 0.002), and also one of the six original Seyfert galaxies studied in Seyfert (1943). It is a radio-quiet NLS1 hosted by a spiral galaxy (Fig. B.119). In our observations, its peak flux density is 0.78 mJy beam−1, the integrated flux density is 5.47 mJy, and the flux densities of the tapered maps slightly higher. Due to its low redshift this translates to a very low luminosity of log νLν, int = 36.46 erg s−1. Most of the emission originates from the extended regions, seen in Fig. B.115. The emission is elongated in the north-east to south-west direction and exhibits an S-shaped curve. The core also seems to be elongated with the same position angle. The morphologies seen in the tapered maps in Figs. B.117 and B.118 are similar to the normal map. The maximum extent of the emission in the normal map is 0.42 kpc, and in the 60kλ tapered map 0.44 kpc, and thus the radio emission we see is confined within the very centre of the galaxy, as can be seen in Figs. B.119 and B.120. In the α map (Fig. B.115) the spectral index of the core is −0.85, steepening to ∼ − 1 towards the south-west. Interestingly, it looks like the spectral index of the south-west extended emission is on average flat, with spectral indices around −0.5.
J1203+4431 was observed with the VLA at 1.5 and 5 GHz already in Ulvestad & Wilson (1984). At 5 GHz they observed an east-west-oriented structure that resembles the central region seen in our radio map. At 1.4 GHz they also see the south-west extended region, with a morphology similar to what is seen in our map. Baum et al. (1993) observed J1203+4431 with the Westerbork Synthesis Radio Telescope (WSRT) at 5 GHz and with the VLA in D configuration at 1.5 and 5 GHz. In the WSRT observations they see a north-east to south-west structure, which is about twice larger in size compared to what is seen in our maps. In their 5 GHz VLA map they clearly see the radio emission originating in the spiral arms of the galaxy, and in the 1.5 GHz map they also see the radio emission of the disk.
At higher resolution, at least from ∼1.5 to 15 GHz, the core component splits into three separate components with sub-millijansky flux densities, which correspond to the structures seen at lower resolution (Giroletti & Panessa 2009; King et al. 2011; Baldi et al. 2018; Saikia et al. 2018). Very high-resolution observations with the VLBA at 1.7 GHz (Doi et al. 2013) and with the JVN at 22 GHz (Doi et al. 2015) do not detect the source. Several studies have suggested that the origin of the inner structure is the AGN activity (e.g., Gallimore et al. 2006; Maitra et al. 2011; Jones et al. 2017). Based on broadband SED modelling Maitra et al. (2011) conclude that the source hosts a mildly relativistic jet/outflow. Studying a sample of Seyfert galaxies with kiloparsec-scale radio structures, including J1203+4431, Gallimore et al. (2006) argue that in general these structures originate when jet plasma interacts with the interstellar medium and gets decelerated. They argue that in most cases the jet loses most of its power within the innermost kiloparsec. Jones et al. (2017) study the radio variability of J1203+4431 but find no significant signs of it. They hypothesise that the jet-like structure results from an earlier period of higher activity, and that at the moment the source is at a low-activity state. This could be supported by a study by Esparza-Arredondo et al. (2020) where they classify J1203+4431 as a possible early fading candidate, meaning that it looks like its nuclear activity is currently decreasing. These properties match what we observe well: Very close to the nucleus, the morphology towards the south-west appears somewhat collimated but dissipates at a radius of < 0.1 kpc. We assume that the north-east part is receding and that a similar nuclear jet cannot be seen due to Doppler de-boosting. Interestingly, the source was also detected by the Planck satellite at 353, 545, and 857 GHz with flux densities of 0.74, 3.04, 10.50 Jy, respectively (Planck Collaboration VII 2013). This emission most probably originates from the dust in the host galaxy (Popescu et al. 2011).
A water maser is detected in this source by Hagiwara et al. (2018). Ultra-fast outflows (UFOs) are also detected in J1203+4431 in X-rays in several studies (Tombesi et al. 2010; Pounds & King 2013; Igo et al. 2020) with velocities up to 0.12 c. Pounds & King (2013) suggest that the outflow gets terminated at a rather small radius, losing much of its energy when interacting with the interstellar medium. However, the outflow is momentum-conserving, and thus enables momentum-driven AGN feedback in the galaxy. Outflows have been detected also in the optical spectrum. Christopoulou et al. (1997) detected an [O III] outflow with two blueshifted components, originating from opposite sides of the outflow cone. They model the outflow and determine its velocity to be 245 km s−1. The outflow was later confirmed by Fischer et al. (2013), who found a maximum velocity of 550 km s−1. These models were further improved in Meena et al. (2021), where they claim that the outflow is biconical, launched within 0.5 pc from the nucleus, and is driven by radiation. At a distance of 350 pc the outflow has a velocity of 680 km s−1, and they argue that based on the gas kinematics and the host galaxy properties it can travel up to a distance of ∼1 kpc from the nucleus. The [O III] outflow somewhat traces the north-east morphology seen in the radio maps, which is natural since it can be expected that the jet and the outflow are launched into the same direction. However, in the outflow model the north-east part is approaching and the south-west receding, which does not seem to be the case based on the radio morphology.
It is clear that the radio emission is of nuclear origin, and in any case the star formation diagnostics for J1203+44231 are unreliable since we see only a fraction of the whole radio emission of the source. However, the star formation rate of the host has been estimated to be a few M⊙ yr−1 (Lianou et al. 2019; Lamperti et al. 2020), and in the 5 GHz VLA radio map of Baum et al. (1993) the spiral arms are clearly seen, proving that across the host some of the radio emission does have an origin related to star formation.
5.2.24. J1209+3217
J1209+3217 (RX J1209.7+3217) is another radio-quiet NLS1 galaxy (z = 0.144) whose radio emission seems to be dominated by star formation. The radio map does not show significant structure, and the radio emission is confined inside the host galaxy (Fig. B.125). The 5.2 GHz peak flux density is 0.60 mJy beam−1, the integrated flux density is 0.72 mJy. The total spectral index is −0.55 and the core spectral index is −0.62 (Fig. B.121). This is consistent with the 1.4–5.2 GHz spectral index of −0.76, estimated using archival 1.4 GHz FIRST data. The source has a moderate luminosity of log νLν, int= 39.31 erg s−1. The W3–W4 colour is 2.88, the q22 value is 1.75, and the W3 flux density is significantly, ∼15.6 mJy, higher than S1.4 GHz, JVLA, indicative of strong star formation. S5.2 GHz, CDFS is ∼0.5 mJy higher than Sint, suggesting that the radio emission can be explained by star formation. The [O III] lines are not shifted, but a turbulent wing component with a velocity of −222 km s−1 and a FWHM of 1405 km s−1 is present.
5.2.25. J1215+5442
J1215+5442 (SBS 1213+549A) is a radio-quiet NLS1 at z = 0.150 with a peak flux density of 0.56 mJy beam−1, an integrated flux density of 0.64 mJy, and a moderate luminosity of log νLν, int = 39.30 erg s−1. Its radio maps (Fig. B.126) do not exhibit any remarkable features, and according to the α map (Fig. B.126) its total spectral index is −1.0. J1215+5442 was detected in FIRST with a flux density of 2.35 mJy, giving a 1.4–5.2 GHz spectral index of −0.99, confirming the steep spectral index of our map.
Based on the star formation proxies, the radio emission of J1215+5442 can be explained by star formation activity and does not require a significant contribution from the AGN. Its mid-infrared colour, W3–W4, is 2.47, q22 is 1.52, and the W3 flux density is ∼29.6 mJy higher than the extrapolated JVLA 1.4 GHz flux density, suggesting strong star formation activity. Also, S5.2 GHz, CDFS is ∼0.8 mJy higher than Sint, supporting star formation as the main producer of radio emission in this galaxy. However, the contribution of AGN-heated dust to the mid-infrared emission cannot be ruled out, especially since an [O III] wing is present, with a velocity of −500 km s−1 and a FWHM of 661 km s−1.
5.2.26. J1218+2948
J1218+2948 (Mrk 766) is a well-studied nearby (z = 0.013) radio-loud NLS1 galaxy. Its peak flux density is 11.17 mJy beam−1, the integrated flux density 15.46 mJy, and the flux densities of the tapered maps almost the same. Its luminosity is quite low with log νLν, int = 38.47 erg s−1. The radio morphology (Fig. B.126) is mostly featureless, but exhibits a slight elongation in south-east – north-west direction. The tapered maps (Figs. B.133 and B.134) reveal additional extended emission towards the east. The radio emission is confined within the central parts of a barred spiral host (Fig. B.135 and B.136). The α map shows a steep core, with a spectral index of −0.84. The total spectral index is −0.83, so the source is thoroughly steep.
In archival radio observations obtained with the VLA the flux densities were found to be 35.9 mJy at 1.46 GHz, and 15.4 mJy at 4.89 GHz, in Owens Valley Radio Observatory (OVRO) observations at 20 GHz the flux density was 5.3 mJy (Edelson 1987), and observations with Arecibo yielded 29 mJy at 2.38 GHz (Dressel & Condon 1978). Bicay et al. (1995) obtained 17 ± 4 mJy at 4.755 GHz with the GBT, and Parra et al. (2010) 14.5 mJy at 4.8 GHz with the VLA. All the archival values are consistent with what we obtain, and indicate that the emission is not variable, at least at these timescales. Using the archival and our data, the spectral index between 1.46 and 5.2 GHz is −0.66, and between 5.2 and 20 GHz −0.79, consistent with our α map. J1218+2948 has been unresolved in most radio imaging observations, but at 8.4 GHz with the VLA in A configuration a slight extension towards the south-east was seen (Kukula et al. 1995), and 1.5 GHz VLA observations also detected extended emission on the north-west side of the nucleus, in addition to the south-east emission, was detected (Nagar et al. 1999). These structures correspond to the slightly elongated morphology we see in J1218+2948. The source was not detected at 22 GHz with the JVN (Doi et al. 2016), but was detected at 95 GHz with the Combined Array for Research in Millimeter-wave Astronomy (CARMA) with a flux density of 1.98 mJy (Behar et al. 2015). Behar et al. (2015) note that the high-frequency emission follows the LR − LX relation found in stellar coronae, and argue that the high-frequency radio emission is similarly produced in radio-quiet and moderately radio-loud AGN in the accretion disk corona closer to the black hole and within a smaller region than the large-scale radio emission. Esparza-Arredondo et al. (2020) classify this source as a fading nucleus.
Structures resembling the radio morphology have also been observed in optical and IR emission lines. The [O III] emission is found to be rather circular (Mulchaey et al. 1996; Schmitt et al. 2003) and limited to the innermost ∼0.5 kpc of the galaxy, but an excitation map shows a biconical south-east to north-west structure, with the south-east emission being brighter. Gonzalez Delgado & Perez (1996) find that the Hα emission is extended 1.5 kpc towards the north-east, and conclude that the spectrum of this region can be fitted with H II region models. They also find both a blueshifted and a redshifted component of [O III] on opposite sides of the nucleus, and argue that the kinematics of this gas is a result of a nuclear outflow. Schönell et al. (2014) map the innermost 450 pc of the galaxy with the Gemini Near Infrared Integral Field Spectrograph in J and Ks bands, and find that also the [Fe II] emission is extended towards the south-east. Based on line ratios they deduce that they have been ionised by a mixture of nuclear and starburst emission. Towards the south-east they detect signs of shocked gas and an increase in the [Fe II] velocity distribution, as well as redshifted and blueshifted components they think were caused by a jet or an outflow. Also, a water maser has been detected in J1218+2948, but whether it is associated with the nucleus is unclear (Tarchi et al. 2011).
Star formation diagnostics for this source can be unreliable due to the JVLA observation not mapping the whole galaxy, so the flux density can be somewhat underestimated. Furthermore, Rodríguez-Ardila et al. (2005) found in the near-infrared spectrum an excess they attribute to hot dust with a blackbody temperature of 1200 K they think resides very close to the nucleus, at the dust sublimation radius. If also the toroidal/poloidal cooler dust is bright it can contribute to the observed mid-infrared flux densities. Keeping these in mind, the star formation diagnostics point to this source being star-forming. The W3–W4 is 2.87, q22 is 1.40, the W3 flux density is 269.8 mJy higher than S1.4 GHz, JVLA, and S5.2 GHz, CDFS is 4.6 mJy higher than Sint. The star formation of the host is not extraordinarily high: Based on far-infrared observations it is 5.42 M⊙ yr−1 (Terrazas et al. 2017), and based on the infrared luminosity it is 2.24 M⊙ yr−1 (Lamperti et al. 2020). However, Rodríguez-Ardila & Viegas (2003) detect a 3.3 μm PAH feature within 150 pc of the nucleus at a level seen in circumnuclear starbursts in other sources. Also, ultraviolet (UV) observations reveal several bright star-forming regions and star clusters, and the most pronounced star forming region seems to be associated with the eastern part of the galaxy bar (Muñoz Marín et al. 2007). This could explain the eastward extended emission seen in the tapered maps.
Interestingly, two QPOs with a frequency ratio of 3:2 have been reported in J1218+2948 in X-rays (Boller et al. 2001; Zhang et al. 2017a). The periods of the QPOs are 4200 and 6450 s, and they seem to be transient. Ultra-fast outflows have also been detected in this source, with velocities around ∼0.1c (Igo et al. 2020, and references therein).
All in all, it seems as if the radio emission of J1218+2948 is a mixture of star-formation- and AGN-related emission. In the radio maps there are signs of possible jets or outflows in the south-east – north-west direction, but due to the lack of variability in the radio flux densities or radio morphology the jets/outflows appear lethargic. Furthermore, according to several studies the host galaxy is forming stars, but the level of this activity, and thus its contribution to the radio emission, is uncertain. Further observations would be needed to clarify the role of each component in this galaxy.
5.2.27. J1227+3214
J1227+3214 (SDSS J122749.14+321458.9) is a radio-loud NLS1 (z = 0.136) with a peak flux density of 2.96 mJy beam−1, the integrated flux density of 3.34 mJy, and the flux densities of the tapered maps only slightly higher. This results in a moderate luminosity of log νLν, int = 39.94 erg s−1. The source was detected in FIRST with a flux density of 6.42 mJy, yielding a spectral index of −0.50 between 1.4 and 5.2 GHz. Our α map in Fig. B.137 shows a steeper spectrum: The total spectral index is −0.67, and the core spectral index is −0.74. The difference might be due to variability since the mean epoch of the FIRST observations is in 1994; however, due to the lack of further radio observations, we cannot investigate the possible variability. The radio morphology seems somewhat resolved, but without any clear structures. In the normal map the morphology seems slightly extended towards the north-east and west, whereas the tapered maps reveal faint extended emission towards the north and south-east. Whereas the bulk of the emission is confined within the host galaxy, this extended emission seems to be reaching outside it (Fig. B.141).
The star formation diagnostics indicate some activity in the host: the W3–W4 colour is 2.62, q22 is 1.06, and the W3 flux density is ∼25.4 mJy higher than the S1.4 GHz, JVLA. However, Sint is 1.9 mJy higher than S5.2 GHz, CDFS. Caccianiga et al. (2015) find the star formation of this source to be high, 54 M⊙ yr−1, so star formation contribution to the radio emission can be expected. Interestingly, this source is labelled as a red quasar in LaMassa et al. (2016). They argue that it is in a dusty, possibly post-merger state, when powerful nuclear winds start unveiling a heavily obscured nucleus. However, no shift was detected in [O III] lines, so a large-scale outflow does not seem to be present, and only a moderate wing component with a velocity of −209 km s−1 and a FWHM of 592 km s−1 is seen in Berton & Järvelä (2021). Also, Zhang et al. (2017b) study its dust properties and conclude that only the innermost parts of the AGN – the accretion disk, the BLR, and the inner edge of the torus – seem to be obscured, and not the NLR. Based on Cloudy analysis, they claim that the obscuring medium can actually be the torus itself. The host galaxy of J1227+3214 has been observed a few times, but, despite its moderate redshift, the attempts to model the morphology of the host galaxy have been inconclusive; thus, nothing can be said about the state of the host (Järvelä et al. 2018; Olguín-Iglesias et al. 2020).
J1227+3214 would be very luminous for a galaxy dominated purely by star formation, so it is probable that also the AGN contributes to the overall radio emission. Based on its luminosity and the steep spectral index, it could be a low-luminosity CSS-like source. With these data, it is impossible to say whether the extended emission that reaches outside the host is of nuclear or star formation origin, and further observations will be needed to reveal the nature of this source.
5.2.28. J1242+3317
J1242+3317 (WAS 61) is a radio-quiet source at z = 0.044 with a peak flux density of 1.32 mJy beam−1, integrated flux density of 2.23 mJy, and the flux densities of the tapered maps similar. Its luminosity is quite low with log νLν, int = 38.74 erg s−1. Its FIRST flux density is 6.32 mJy, giving a spectral index of −0.79 between 1.4 and 5.2 GHz. This is consistent with what we see in the α map in Fig. B.142: The total spectral index is −0.74, and the core spectral index is −0.88. Brinkmann et al. (1995) report a value of 45 mJy at 4.85 GHz observed with the GBT in 1989, but this record is not found anywhere else, for example, in the National Aeronautics and Space Administration (NASA)/Science & Data Center for Astrophysics & Planetary Sciences (IPAC) Extragalactic Database (NED), the High Energy Astrophysics Science Archive Research Center’s (HEASARC) Xamin, or Set of Identifications, Measurements and Bibliography for Astronomical Data’s (SIMBAD) VizieR, so the value is highly dubious. The morphology of the source is clearly elongated towards the east, and it seems as if the spectral index flattens towards the east as well, but this might be an edge-effect, especially since also the errors increase towards this direction. The tapered maps (Figs. B.144 and B.145) show the same extended emission towards the east, and are additionally also slightly extended towards the south-west. The maximum extent of the region of continuous emission is 1.3 kpc in the normal map and 2.9 kpc in the 90kλ tapered map. The extended emission can be caused by either a low-power jet or a nuclear outflow. Higher-resolution observations would be needed to distinguish between these two options.
The host galaxy of J1242+3317 was classified as a possible S0 galaxy with a strong bar (SB) (Ohta et al. 2007), but modelling the host with a bulge and a disk yielded a Sérsic index of 3.45 for the bulge, suggesting it is a classical bulge (Mathur et al. 2012), in which case the galaxy would not be a pristine late-type galaxy. However, the presence of a bar was not taken into account in the modelling, even if it is clearly visible in the residuals, and might affect the final results.
J1242+3317 is also a bright mid-infrared emitter, even though it is quite clear that the morphology is caused by an AGN. Its W3–W4 colour is 2.72, q22 is 1.59, the W3 flux density is 60.8 mJy higher than S1.4 GHz, JVLA, and S5.2 GHz, CDFS is 1.6 mJy higher than Sint. Yang et al. (2020) estimate its star formation rate based on the 5.2 GHz radio luminosity and conclude that the radio emission cannot be of star formation origin. However, they do not consider the possibility that it can be a mixture of the two. Using BPT diagrams Stern & Laor (2013) classify J1242+3317 as an AGN, a star-forming galaxy, and a Seyfert galaxy in diagrams based on [N II], [S II], and [O I], respectively. This result suggests that indeed probably also star formation is present in this source. Also, an [O III] wing is detectable in the spectrum, with a velocity of −213 km s−1 and a FWHM of 888 km s−1, so additional contribution of the AGN-heated dust to the mid-infrared emission cannot be ruled out either.
5.2.29. J1246+0222
J1246+0222 (PG 1244+026) is a radio-quiet, faint NLS1, at z = 0.048, with a peak flux density of 0.43 mJy beam−1, an integrated flux density of 0.71 mJy and the flux densities of the tapered maps of 0.85 and 0.82 mJy for the 90kλ and the 60kλ taper, respectively. It is also a low-luminosity source with log νLν, int = 38.31 erg s−1. In Kellermann et al. (1994) its 5 GHz flux density was found to be 0.83 mJy, so it seems as if it has not undergone major changes during the last few decades. Its FIRST flux density is 2.23 mJy, giving a spectral index of −0.87 between 1.4 and 5.2 GHz. Upgraded Giant Metrewave Radio Telescope (uGMRT) observations at 685 MHz yielded a flux density of 3.1 ± 0.3 mJy, and they found a steep spectral index of −0.7 (Silpa et al. 2020). Furthermore, they found the source to be extended towards the west-south-west on a kiloparsec scale. In the radio map in Fig. B.147 the source seems to be extended northwards and west-southwestwards. The spectral index varies over the emitting region, and the extreme values close to the edges are clearly a product of edge-effects and low S/N ratio data. The core spectral index is flat with α = 0.05, consistent with what was found in B18, although new observations are certainly required to confirm our result. The tapered maps show extended emission towards the south-east, with an extent of 5.2 kpc in the 90kλ tapered map. The host galaxy of J1246+0222 is featureless (Fig. B.151), and the bulk of the radio emission is confined within it. Its SDSS r band 25 mag arcsec−2 isophotal semi-major axis is 3.42 kpc, implying that the extended emission reaches outside the host.
Teng et al. (2013) study the H I absorption properties of J1246+0222 and conclude that the blueshifted and broad H I absorption features match an outflow caused by the nuclear activity, probably driven by a jet. Moreover, they find that the minima of the absorption troughs exceed the nuclear continuum flux densities, meaning that there is also off-nuclear radio emission contributing to the continuum in J1246+0222. Based on the resolution of their observations they argue that the emitting region needs to be at least 3 kpc from the core. The south-eastward extended emission visible in our tapered maps would fit the criterion of the required off-nuclear emission. Also, fitting of the timing data of J1246+0222 in X-rays supports the presence of a jet or at least a jet base in this source. Chainakun & Young (2017) find that the data are best fitted with two X-ray sources, with the source further away from the black hole producing only small amounts of reflection X-rays. They interpret this component as a jet whose emission is beamed away from the accretion disk and thus does not get reflected. In any case, the radio morphology would be highly unusual for a star-forming galaxy, and thus it is probable that at least the extended emission is produced by nuclear activity, which implies that a jet or a nuclear outflow is or has been present. Interestingly, no [O III] shift is seen in the optical spectrum, but a wing is present with a velocity of −503 km s−1 and a FWHM of 1245 km s−1. Also, a possible UFO with a velocity of 0.08 c has been detected (Igo et al. 2020).
According to the star formation diagnostics the bulk of the radio emission could be from star formation as the W3-W4 colour is 2.56, q22 is 2.26, the W3 flux density is 40.3 mJy higher than the S1.4 GHz, JVLA, and S5.2 GHz, CDFS is about the same as Sint. The star formation rates derived using different methods are roughly in agreement, ranging from 1 to 11 M⊙ yr−1 (Young et al. 2014; Sargsyan et al. 2012; Shangguan et al. 2020). However, Yang et al. (2020) claim that producing the amount of radio emission seen in J1246+0222 would require very improbable amounts of star formation. Shi et al. (2007) claim to have detected PAH features at 7.7 and 11.3 μm in the infrared spectrum obtained with the Infrared Spectrograph (IRS) on board the Spitzer Space Telescope, whereas Xie et al. (2018) see only a flat, featureless spectrum in their data obtained with the same instrument. They model the spectrum and conclude that it can be reproduced by three continuum components with temperatures of about 394, 165, and 77 K. If in absence of strong star formation the hot, as well as partly the warm, dust emission could originate from the dust heated by the AGN, which could explain the excess mid-infrared emission.
5.2.30. J1302+1624
J1302+1624 (Mrk 783) is a radio-loud NLS1 at z = 0.067 with a peak flux density of 3.28 mJy beam−1, an integrated flux density of 11.47 mJy and the flux densities of the tapered maps about half a mJy higher. Its luminosity is log νLν, int= 39.91 erg s−1. Its radio map in Fig. B.152 reveals a core and considerable extended emission towards the east and south-east, in a curved morphology. The tapered maps do not show any additional emission (Figs. B.154 and B.155). The extent of the emission from the core in the normal map towards the south-east is 7 kpc, towards the north 3.9 kpc, and towards the west 2 kpc. In the α map (Fig. B.152) the spectral index of the core is ∼ − 0.83, and the total spectral index is −1.50. The extended emission is mostly very steep, with spectral indices < − 1.5. An exception is a region very south, at the tip of the extended emission: the spectral index at the centre of the highest contour (RA 13:02:58.04, Dec +16:24:24.49) is −0.67, and thus considerably flatter than elsewhere. It is probable that these flatter spectral indices are real, since they are not only seen at edges, and this region is clearly brighter than the rest of the jet, resembling a hotspot, and indicating interaction with the interstellar medium.
J1302+1624 was detected with FIRST with a flux density of 28.72 mJy, but this value includes both the core and the extended emission, and thus deriving a spectral index using it does not tell us much. Doi et al. (2013) observed the source with the VLBA at 1.7 GHz finding it unresolved with a flux density of 1.3 mJy. It was not detected at 22 GHz using the JVN (Doi et al. 2016). J1302+1624 is extensively studied in Congiu et al. (2017a,b), and Congiu et al. (2020). Congiu et al. (2017b) find an extended NLR in this source. This region has the same position angle as the radio emission extended south-east, but is much further away from the nucleus, reaching as far as 35 kpc. They confirm with a BPT diagram that this region has been ionised by the AGN, and not star formation. Hints of gas ionised by star formation are seen closer to the nucleus, and between these there is a region where no line emission was detected at all. If the gas 35 kpc away from the nucleus was ionised by the AGN, we can use a simple light travel time argument to estimate a lower limit for the age of the source: it has taken the nuclear emission at least 35 kpc/c = 105.05 yr to reach this region.
Congiu et al. (2017a) thoroughly analyse the same JVLA data we are using. Using tapering they estimate the extent of the emission to be 14 kpc south-eastwards and 12 kpc north-westwards. They measure the spectral indices using the same method as in B18 and estimate the core spectral index to be −0.67 ± 0.13, and the spectral index of the extended emission to be −2.02 ± 0.74. We confirm these results with the α map. It should be noted that their extended spectral index includes both the very steep region and the flatter region seen in our α map, thus being an average between them. Due to the very steep spectral index and the lack of clear collimated structures they hypothesise that the extended emission might be old, and is not being replenished anymore. They also propose that the S-shaped extended emission in the tapered map might suggest that the jets in J1302+1624 are precessing. They further test this scenario in Congiu et al. (2020) observing the source with the VLBA and the enhanced Multi-Element Remotely Linked Interferometer Network (e-MERLIN). The e-MERLIN 1.6 GHz observations confirm the diffuse, non-collimated nature of the extended emission, as well as its steep spectral index. Interestingly, the source is partially resolved in VLBA observations at 5 GHz, but the pc-scale jet seems to be pointing north-east. Fitting a precession model to the JVLA 5.2 GHz data, they confirm that it is a plausible scenario for the origin of the detected emission. Another possibility they bring up is intermittent activity, as J1302+1624 seems to be undergoing a merger, and mergers are known to cause this kind of behaviour. Furthermore, a merger can also be responsible for the change in the direction of the jet. Current data are not enough to distinguish between these scenarios. Interestingly, the flattened emission region we see in the α map coincides with the southern tidal structure seen in Fig. 6 of Congiu et al. (2020), possibly indicating that the jet is interacting with the interstellar medium in the tidal tail. J1302+1624 is a blue outlier as its [O III] lines are shifted by −191 km s−1, but it is unclear whether the shift is due to the jet or possibly the merger.
The jet is clearly the main source of radio emission in this source, but as indicated by the BPT diagram, there probably is also some star formation going on in the host. The star formation diagnostics are dominated by the jet emission, and only the W3–W4 colour of 2.62 reveals possible star formation. q22 is −0.11, the W3 flux density is 63.0 mJy lower than the S1.4 GHz, JVLA, and Sint is 10.8 mJy higher than S5.2 GHz, CDFS.
5.2.31. J1305+5116
J1305+5116 (SDSS J130522.74+511640.2) is a radio-loud, bright NLS1 at z = 0.788 with a peak flux density of 32.10 mJy beam−1, an integrated flux density of 53.41 mJy and the flux densities of the tapered maps approximately the same. It is one of the most luminous sources in our sample with log νLν, int = 42.91 erg s−1. J1305+5116 has also been detected in gamma-rays, which – when taking into account the quite high redshift of this source – strongly suggests it hosts a relativistic, beamed jet (Liao et al. 2017). Its radio map (Fig. B.159) shows two components with a separation of 8.1 kpc, and at a position angle of 168°. The northern component is responsible for about 62% of the emission (33.1 mJy). The α map reveals that this is the core, since it shows a flat spectral index (α = −0.07), whereas the spectral index of the southern component is −0.73 (RA 13:05:22.76, Dec 51:16:39.10), and consistent with optically thin synchrotron emission. The northern component is centred at the centre of the featureless host galaxy (Fig. B.163). The SDSS r band 25.0 mag arcsec−2 isophotal semi-major axis of the host is 15.4 kpc, so also the jet is still confined within the host galaxy.
Based on archival data, J1305+5116 was previously classified as a steep spectrum source: its flux densities at 150 MHz (6C/7C), 325 MHz (WENNS), and 1.4 GHz (FIRST) are 320, 211, and 86.9 mJy, respectively (Yuan et al. 2008). It was later observed with the Allen Telescope Array (ATA) at 1.4 GHz with a flux density of 92.7 mJy (Croft et al. 2010), indicating some degree of variability. Higher-resolution observations revealed a north-south -oriented core-jet structure (Petrov 2013). In VLBA observations at 5 GHz the core flux density was found to be 15 mJy, and the jet flux density 8.9 mJy. These values are less than 50% of what we observe at 5.2 GHz indicating that a substantial amount of the emission is resolved-out at the VLBA scales. The source was not detected at 22 GHz with the JVN with a detection limit of 9 mJy (Doi et al. 2016).
Komossa et al. (2018) investigate the optical spectrum of J1305+5116 and find extreme emission line shifts, with the largest velocities derived from them exceeding the escape velocity of the galaxy. They also find ionisation stratification – the shifts of higher ionisation potential lines are larger – and argue that this implies that the shifts are not caused by local interaction, but concern the whole NLR. They conclude that the properties of the optical spectrum are most probably indicative of an early stage of jet evolution, where a young jet is still advancing through the dense interstellar medium and interacting with it. This scenario is in agreement with the radio morphology of the source, since the jet still seems to reside within the host. This source would be ideal for future observations about the jet – interstellar medium interaction.
The radio emission in J1305+5116 seems to be produced by a powerful nucleus and a relativistic, beamed jet. Nevertheless, for consistency the star formation diagnostics of this source are: the W3–W4 colour is 2.34, q22 is −0.61, S1.4 GHz, JVLA is 72.3 mJy higher than SW3, Sint is 5.03 mJy higher than S5.2 GHz, CDFS.
5.2.32. J1317+6010
J1317+6010 (SBS 1315+604) is a radio-quiet NLS1 (z = 0.137) with a peak flux density of 0.51 mJy beam−1, an integrated flux density of 0.64 mJy, and the tapered flux densities slightly higher, 0.80 and 0.79 mJy for the 90 and 60kλ taper, respectively. Due to its redshift the low flux density translates to a moderate luminosity of log νLν, int = 39.42 erg s−1. The only archival radio detection is 1.82 mJy from FIRST, yielding a 1.4–5.2 GHz spectral index of −0.80. Interestingly, according to the α map in Fig. B.165 the core spectral index is quite flat with α = −0.34. This is consistent with what was found in B18, but since they used the same dataset, this result should be checked. It can be an artefact due to the faintness of the source. The morphology seems to be somewhat extended, and the central region seems to be surrounded by patchy, diffuse emission. In the tapered maps (Figs. B.167 and B.168) these blobs form one, quite featureless, emission region. The radio emission is confined within the host galaxy, which does not show any distinguishable morphology either (Fig. B.169).
The star formation proxies indicate star formation in the host, W3–W4 is 2.6, q22 is 1.60, SW3 is 12.8 mJy higher than S1.4 GHz, JVLA, and Sint and S5.2 GHz, CDFS are about the same. However, the BPT diagrams using different emission line ratios all indicate that the gas has been ionised by the AGN (Stern & Laor 2013). The [O III] lines are not shifted, but the source does show an [O III] wing with a velocity of −377 km s−1 and a FWHM of 1436 km s−1, so the dust heated by the AGN could explain the mid-infrared emission.
5.2.33. J1337+2423
J1337+2423 (IRAS 13349+2438) is a radio-quiet source at z = 0.108, originally classified as an NLS1, but later found to be a BLS1 with the FWHM(Hβ) ∼ 2500 km s−1 (Lee et al. 2013). However, its optical spectrum exhibits very strong Fe II emission, unlike BLS1s in general, so it might be an ‘overgrown’ NLS1. We decided to include it in the sample because it still shares a lot of properties with NLS1s, and might be interesting from a evolutionary point of view. It is defined as radio-quiet, mostly due to its strong optical/infrared emission. Its peak flux density is 9.64 mJy beam−1, the integrated flux density is 9.96 mJy, and the tapered flux densities are about the same. It has a high luminosity of log νLν, int = 40.26 erg s−1. Its FIRST flux density is 19.9 mJy, giving a 1.4–5.2 GHz spectral index of −0.53. The α map in Fig. B.170 shows generally steep spectral indices: the total spectral index is −1.03, and the core spectral index is −1.01. The source is slightly elongated towards the east. The tapered maps do not reveal significant new emission. The radio emission is confined within the host galaxy, which shows hints of a bar and possible spiral arms or disturbed morphology (Fig. B.174).
The star formation diagnostics, except for the W3–W4 colour, indicate strong star formation. The W3–W4 colour is 1.95, q22 is 1.29, the W3 flux density is 424.1 mJy higher than the S1.4 GHz, JVLA, and S5.2 GHz, CDFS is 2.8 mJy higher than Sint. However, this source has been studied in infrared in detail, and it has been classified as a hot dust-obscured galaxy, where almost all the mid-infrared emission originates from the AGN-heated dust (Lyu & Rieke 2018). The AGN-fraction of the mid-infrared emission is studied also in Alonso-Herrero et al. (2016) and Gruppioni et al. (2016) and is found to be 0.97 and 0.98, respectively, so it can be concluded that the very bright mid-infrared emission is of AGN origin. On the other hand, this source also shows considerable star formation, with the estimates ranging between ∼15 to 45 M⊙ yr−1 (Sargsyan et al. 2012; Mahajan et al. 2019), so the contribution of the star formation to the radio emission cannot be totally ruled out.
J1337+2423 was also found to host strong multi-phase UFOs with velocities of ∼0.14c and ∼0.27c (Parker et al. 2020), as well as two warm absorbers with velocities around −600 km s−1 (Parker et al. 2018). The optical spectrum does not show [O III] line shifts, but reveals a strong [O III] wing component with a velocity of −598 km s−1 and a FWHM of 2241 km s−1. Taking into account the proof of strong outflows in this source, it is possible that the eastward extended emission is also caused by an outflow rather than a jet. The steep spectral indices also support this hypothesis.
5.2.34. J1348+2622
J1348+2622 (SDSS J134834.28+262205.9) is a radio-quiet NLS1 at z = 0.917 with a very low integrated flux density of 0.38 mJy. However, this source has the highest redshift among our sample, so the low Sint translates to quite a high luminosity of log νLν, int = 40.84 erg s−1. The source does not exhibit any distinct features in the radio maps, and unsurprisingly also its host galaxy is unresolved due to the redshift (Fig. B.179). The α map (Fig. B.175) shows that the spectral index of the source is very steep, the total spectral index is −1.06, and the core spectral index is −1.30.
The star formation diagnostics do not imply strong star formation in this source, W3–W4 is 1.83, q22 is 0.32, and both SW3 and S1.4 GHz, JVLA, and Sint and S5.2 GHz, CDFS are roughly the same. However, due to the high redshift of this source, the PAH features around 11.3 μm are not within the W3 band anymore, but actually fall into the W4 band, so the star formation proxies used are not necessarily reliable for this source. Since the PAH features should be within the W4 band we decided to use it instead of W3 in the SW3 − S1.4 GHz, JVLA relation. According to this the W4 flux density is ∼1.6 mJy higher than S1.4 GHz, JVLA, still not a very robust result in favour of star formation.
Based on these data, it is not possible to determine the predominant source of the radio emission in J1348+2622. However, star forming, or even starburst galaxies rarely exceed the radio luminosity of log νLν = 40 erg s−1 (e.g., Sargsyan & Weedman 2009), which might suggest that the radio emission is dominated by the AGN, and that J1348+2622 might be a CSS-like NLS1 galaxy.
5.2.35. J1358+2658
J1358+2658 (SDSS J135845.38+265808.4) is a radio-quiet source at z = 0.331 with a peak flux density of 0.52 mJy beam−1, an integrated flux density of 0.61 mJy, with the flux densities of the tapered maps similar. Due to the redshift of this source the low flux density results in a high luminosity of log νLν, int = 40.05 erg s−1. The radio map in Fig. B.180 shows a core, and faint extended emission north-eastwards. A similar structure is seen also in the tapered maps (Figs. B.182 and B.183). However, with these data we cannot be certain the emission is real. The α map probably suffers from the faintness of the source, and shows variable, possibly not reliable, values. The general trend seems to be on the verge between flat and steep, but based on these data nothing conclusive can be said. The FIRST flux density is 1.17 mJy, and thus the 1.4–5.2 GHz spectral index is −0.50, somewhat in agreement with the α map, which has a total spectral index of −0.42. The bulk of the radio emission comes from within the host galaxy, of whose morphology nothing can be said, but the north-eastward extension seems to be reaching outside it. The SDSS r band 25 mag arcsec−2 isophotal semi-major axis of the galaxy is 7.7 kpc, whereas the maximum extent of the radio emission is 17 kpc.
Caccianiga et al. (2015) estimate the star formation activity in the host to be at a starburst level with 129 M⊙ yr−1. Strong star formation is supported by the W3–W4 colour of 2.69, q22 of 1.30, the W3 flux density that is 5.4 mJy higher than S1.4 GHz, JVLA, and Sint and S5.2 GHz, CDFS that are about equal. Its optical spectrum also shows an [O III] wing with a velocity of −253 km s−1 and a FWHM of 1366 km s−1, so the contribution of the AGN-heated dust cannot be ruled out either.
The extended emission – if real – cannot easily be explained by star formation, and it is most likely of nuclear origin, but its nature cannot be determined with these data. Furthermore, the broadband spectral index close to the threshold between flat and steep is not in agreement with a pure star formation scenario, which should result in a steeper spectral index. This indicates that whereas a fraction on the radio emission originates from the starburst, there needs to be also a flatter component present to account for the observed spectral index. Moreover, the luminosity of this source would be very high for a pure starburst galaxy, and thus the radio emission within the galaxy seems to be a combination of starburst and nuclear activity.
5.2.36. J1402+2159
J1402+2159 (RX J1402.5+2159) is a radio-quiet NLS1 at z = 0.066 with very fait radio emission, the peak flux density is 0.28 mJy beam−1, the integrated flux density is 0.33 mJy, and the 90kλ tapered flux density is 0.46 mJy. J1402+2159 is a quite nearby source, so also the resulting luminosity is low with log νLν, int = 38.34 erg s−1. The source was detected in FIRST with a flux density of 0.87 mJy, giving a 1.4–5.2 GHz spectral index of p0.74. In addition to these there are not other radio observations of this source. The spectral index seen in the α map in Fig. B.185 is even steeper, the total spectral index is −0.95, and the core spectral index is −1.54. However, the spectral index values might be affected by the faintness and the low S/N of the data. The source morphology shows an extension towards the north-east. This feature is more pronounced in the tapered maps (Figs. B.187 and B.188). Overlaid with the host galaxy (Fig. B.189), it looks like the radio emission reaches slightly outside of it, or at least to the edges, even when considering that the elongated beam somewhat exaggerates the extent of the emission.
The host galaxy is probably of E/S0 type (Ohta et al. 2007), and all the star formation diagnostics indicate activity in this source, the W3–W4 colour is 2.75, q22 is 2.16, SW3 is 41.2 mJy higher than S1.4 GHz, JVLA, and S5.2 GHz, CDFS is 2.1 mJy higher than Sint. These diagnostics are supported by BPT diagrams based on various line ratios where this source is consistently classified as a star-forming galaxy, indicating that the main source of ionising emission in this galaxy are stars. The data are consistent with the star formation activity being the main source of radio emission in this source. However, the nature of the extended radio emission cannot be determined with these data, more, preferably higher S/N observations would be needed for that.
5.2.37. J1536+5433
J1536+5433 (Mrk 486) is a radio-quiet NLS1 at z = 0.039 with very faint radio emission: the peak flux density is 0.44 mJy beam−1 and the integrated flux density is = 0.50 mJy. It also has a low luminosity of log νLν, int = 37.98 erg s−1. It was detected at 5 GHz in the 1980s with a flux density of 0.47 mJy (Kellermann et al. 1989), indicating that it does not show significant variability. The FIRST detection at 1.4 GHz is 1.23 mJy, giving a 1.4–5.2 GHz spectral index of −0.69. Our α map in Fig. B.190 shows slightly flatter spectral indices, the total spectral index is −0.35, and the core spectral index is −0.50. Due to the faintness of this source we cannot be sure how reliable the spectral index range is but it seems as if the general spectral index is rather flat, which is in agreement with the spectral index estimated in B18. The radio emission in confined within the inner regions of the host galaxy (Fig. B.194), which appears to be late-type.
The PAH features of J1536+5433 at 11.3 μm are studied by Martínez-Paredes et al. (2019), and whereas they are able to detect them they find no evidence of enhanced star formation; in fact the estimated star formation rate is only 0.24 ± 0.08 M⊙ yr−1. Although it should be kept in mind that an AGN can suppress the PAH features. Nevertheless, the mid-infrared colour agrees with this (W3–W4 = 1.92), but the other diagnostics do not. The q22 is 2.12, the W3 flux density is substantially higher, about 52.1 mJy, than S1.4 GHz, JVLA, and also S5.2 GHz, CDFS is ∼1.0 mJy higher than Sint. Whereas Sint and S5.2 GHz, CDFS are comparable and indicate that the radio emission could be explained by modest star formation, the W3 flux density is surprisingly high, and hard to explain by the low star formation seen in this source. The [O III] lines of J1536+5433 are not shifted, and do not show a wing either. This, of course, does not rule out the possibility that the excess mid-infrared emission might originate from the equatorial dust heated by the AGN. This would be in line with the flat spectral index – uncommon for star formation emission – of the source.
5.2.38. J1555+1911
J1555+1911 (Mrk 291) is a faint, radio-quiet NLS1 (z = 0.035) with a peak flux density of 0.12 mJy beam−1 and an integrated flux density of 0.36 mJy. The flux densities of the tapered maps are 0.42 and 0.44 mJy, for the 90 and the 60kλ taper, respectively. The normal map (Fig. B.195) exhibits diffuse emission, and it is hard to say whether a proper core is even present. The FIRST detection of this source is 1.85 mJy, giving a 1.4–5.2 GHz spectral index of −1.25. Also, our α map shows a very steep spectral index: The core spectral index is −1.13, and the total spectral index is −0.82, although the south-western part of the emission exhibits a flat spectral index, which might be due to the edge effects and thus not reliable. The tapered maps (Fig. B.197 and B.198) show a morphology slightly elongated towards the north-west. J1555+1911 is hosted by a spiral galaxy (Fig. B.199), and most of the radio emission is confined within the bulge of the galaxy.
Based on its mid-infrared properties, the diffuse radio morphology, and the low luminosity (log νLν, int = 37.85 erg s−1) it seems rather evident that the predominant source of the radio emission is star formation. W3–W4 colour is 2.62, q22 is 1.67, W3 flux density is ∼19.2 mJy higher than S1.4 GHz, JVLA, and Sint and S5.2 GHz, CDFS are roughly in agreement.
5.2.39. J1559+3501
J1559+3501 (Mrk 493) is a radio-quiet NLS1 at z = 0.031 with faint radio emission, the peak flux density is 0.46 mJy beam−1, the integrated flux density is 1.41 mJy, and the flux densities of the tapered maps are 1.47 and 1.48 mJy for the 90 and 60kλ, respectively. It is a nearby source so the flux density results in a low luminosity of log νLν, int = 38.19 erg s−1. The radio map in Fig. B.200 shows a core surrounded by diffuse emission, slightly more elongated towards the north-west and south-east. The tapered maps in Figs. B.202 and B.203 do not show any additional structures. The α map suffers from low S/N, as can be seen especially close to the edges, but in general the map shows very steep spectral indices, and the total spectral index is as steep as −1.16. The FIRST detection of this source is 3.39 mJy, giving a 1.4–5.2 GHz spectral index of −0.67. Yang et al. (2020) report a JVLA A-configuration 8.84 GHz flux density of 0.56 mJy, resulting in a very steep 5.2–8.84 GHz spectral index of −1.74. They claim that the 5.2–8.84 GHz spectral index is flat, but their reported value for the integrated 5.2 GHz flux density is only 0.62 mJy, whereas their and ours peak flux densities are about the same. They obtained the value using the same dataset we are using, but their rms is higher (11 vs. 15.64 μJy beam−1). However, the 1.4–5.2 GHz spectral index is steep, and it does not seem probable that it would flatten above 5.2 GHz.
It is worth noting that the detected radio emission is confined within the bulge of the host (Fig. B.204) and probably does not represent the whole radio emission of the source. The host galaxy is a barred spiral that also exhibits a nuclear ring and a nuclear dust spiral (Crenshaw et al. 2003; Deo et al. 2006; Ohta et al. 2007). Popović et al. (2009) studied the nuclear region in detail and concluded that the nuclear ring can indeed be a place of enhanced star formation. They estimated an unusually high star formation rate of 2 M⊙ yr−1 for the innermost < 1 kpc. In the BPT diagrams J1559+3501 is classified as a star-forming galaxy, indicating that the NLR lines as excited by star formation rather than the AGN. Sani et al. (2010) detected strong 6.2 μm PAH features in this source, confirming the presence of star formation. Our star formation diagnostics are somewhat in agreement with this, but it should be noted that the WISE flux densities cover the whole galaxy, whereas we likely are missing some faint, extended radio emission from host. The W3–W4 colour is 2.34, q22 is 1.38, W3 flux density is ∼64.3 mJy higher than S1.4 GHz, JVLA, and S5.2 GHz, CDFS is 1.3 mJy higher than Sint. The [O III] lines of J1559+3501 show a prominent wing with a velocity of −349 km s−1 and a FWHM of 807 km s−1, so also nuclear winds are present.
The evidence seems to indicate that the star formation is a significant, if not the major, contributor to the radio emission. The nuclear, possibly star-forming ring found in previous studies falls within the radio emitting region in our map, and also the radio morphology seems to be more consistent with star formation than nuclear activity. This does not rule out the possibility that the AGN contributes too, but higher-resolution observations will be needed to disentangle these two mechanisms.
5.2.40. J1633+4718
J1633+4718 (SDSS J163323.58+471858.9) is a radio-loud NLS1 (z = 0.116) whose radio map in Fig. B.205 shows two distinct components. The integrated flux density of the core component is 24.48 mJy, and the integrated flux density of the north component is 0.79 mJy. The flux densities of the tapered maps are very similar to these. J1633+4718 is a high-luminosity source with log νLν, int = 40.67 erg s−1. J1633+4718 resides in an interacting system (Olguín-Iglesias et al. 2020): the core component is associated with the disk-like host galaxy of J1633+4718, whereas the north component is associated with another disk galaxy (Fig. B.209). The nuclei of the two galaxies are ∼8 kpc apart. The core spectral index of the component that hosts the NLS1 is −0.54, and thus on the verge between flat and steep. The α map of the companion galaxy suffers from low S/N and edge effects, but its ‘core’ spectral index is −0.69.
Past radio observations of J1633+4718 indicate variability in the core. Neumann et al. (1994) found an inverted radio spectrum above 5 GHz with simultaneous observations, whereas Doi et al. (2011) found the 1.7 to 8.5 GHz spectral index to be steep with quasi-simultaneous observations. Also, archival data at ∼5 GHz suggest considerable variability: Gregory & Condon (1991) reported a flux density of 34 mJy at 4.85 GHz obtained with the GBT, Laurent-Muehleisen et al. (1997) obtained 30 mJy with the VLA at 5 GHz, and Gu & Chen (2010) reported 55.2 mJy with the VLBA at 5 GHz. This is indicative of jet activity, which has been confirmed by high brightness temperature of at least 1011.3 K (Doi et al. 2007), and a pc-scale core-jet radio morphology in high-resolution observations at 1.7 and 5 GHz (Gu & Chen 2010; Doi et al. 2011). At 8.4 GHz with the JVN the source remains unresolved with a flux density of 21.2 mJy.
Archival FIRST 1.4 GHz flux density for J1633+4718 is 65.02 mJy, whereas Doi et al. (2011) were able to detect 55.5 mJy at 1.7 GHz with the VLBA. The discrepancy might be due to resolved-out emission in the VLBA observations, but also because of the variability. Several previous studies suggest that this might be a CSS-like source due to its small size and steep spectral incides, but taking into account that the source also shows flat or even inverted radio spectra, it seems more probable that the occasional steep indices have been due to the temporal variability in the source. Moreover, the 22 GHz flux density was found to be as high as 163 mJy observed with the JVN (Doi et al. 2016), also not consistent with the CSS scenario.
The W3–W4 colour of 2.67 indicates that there might also be star formation present in the galaxy, and Caccianiga et al. (2015) estimate the star formation rate to be as high as 68 M⊙ yr−1. The other indicators do not favour star formation, since the radio emission is clearly dominated by the nucleus: q22 is 0.22, the W3 flux density is ∼24.4 mJy lower than S1.4 GHz, JVLA, and S5.2 GHz, CDFS is 24.1 mJy lower than Sint. However, also a strong nuclear wind seen in the [O III] wing is present with a velocity of −279 km s−1 and a FWHM of 1186 km s−1 so AGN-heated dust can contribute to the observed mid-infrared emission. The main source of the radio emission in J1633+4718 is the AGN, but the weak radio emission of the companion galaxy might be produced by star formation.
J1633+4718 is also an interesting X-ray source, since an ultra-soft X-ray component with a low blackbody temperature of ∼30 eV was detected in it (Yuan et al. 2010; Mallick et al. 2016). This was interpreted as a direct detection of the accretion disk, and so far similar components have not been detected in other NLS1s. Mallick et al. (2016) also detect excess UV emission that requires the presence of a jet to be explained.
5.2.41. J1703+4540
J1703+4540 (SDSS J170330.38+454047.1) is a radio-loud NLS1 at z = 0.060 that was previously classified as a CSS with a turnover frequency below 150 MHz (Snellen et al. 2004). Our α map, shown in Fig. B.210, agrees with this classification since the spectral index we find is steep: the total spectral index is −0.87, and the core spectral index is −0.91. The peak flux density is 32.26 mJy beam−1, the integrated flux density of the normal map (Fig. B.210) is 34.68 mJy, with log νLν, int = 40.20 erg s−1, and it exhibits very mild elongation towards the south-east. The integrated flux densities of the tapered maps (Figs. B.212 and B.213) are about a mJy higher, and both maps reveal extended, but faint radio emission towards the south-east. The host of J1703+4540 is clearly a spiral galaxy, as seen in Fig. B.214, and the radio emission is concentrated within the bulge of the galaxy, which is of a pseudo-bulge type (Olguín-Iglesias et al. 2020). The extended radio emission seems to somewhat trace the southern bar- or arm-like structure, possibly indicating the presence of star formation in the galaxy. The star formation diagnostics partly support this, as the mid-infrared colour W3–W4 is 2.59, and the W3 flux density 15.9 mJy higher than the S1.4 GHz, JVLA. Sint, on the other hand, is 28.8 mJy higher than S5.2 GHz, CDFS, and q22 is only 0.52, suggesting that star formation is not sufficient to explain all of the radio emission.
Indeed, analysing archival VLBA observations of J1703+4540 at 5 GHz Gu & Chen (2010) found a one-sided core-jet structure directed towards the south-west. They also reported considerable flux density variability, which might also affect our star formation diagnostics, since we do not know in which state the source was during our observations. However, our integrated flux density is ∼20 mJy lower than the 5 GHz VLBA flux density (56.8 mJy), suggesting that the source was in a rather low state during our observations. The presence of a jet was confirmed in VLBA observations at 1.7 GHz by Doi et al. (2011), who found a similar one-sided structure, consistent with the jet of Gu & Chen (2010), and with a projected length of 35 pc. The jet emission is quite diffuse and does not appear Doppler boosted, and they conclude that the jet is either sub-relativistic or seen at a large angle. They also detect hints of a counter-jet but cannot confirm whether it is real or not. Giroletti et al. (2017) claim to have confirmed the presence of emission on the counter-side of the core at 5 GHz, and they classify J1703+4540 as an asymmetric double, and a low-power compact (LPC; Kunert-Bajraszewska et al. 2010) source, since it does not show considerable radio morphology evolution over time, as would be expected from a true CSS.
A powerful molecular outflow with a bulk velocity of −660 km s−1 (Longinotti et al. 2018), and a multi-component ultra-fast X-ray outflow showing velocities up to ∼0.1 c (Sanfrutos et al. 2018), consistent with each other, have also been found in this source. Longinotti et al. (2018) state that the outflow seen in J1703+4540 is consistent with an energy-conserving outflow propagating through the host galaxy, an instance of probably the most important and effective way of AGN feedback. In agreement with the outflows, also an [O III] wing component is present, with a velocity of −336 km s−1, and a FWHM of 646 km s−1. Interestingly, the [O III] emission line shows a redshift of 210 km s−1 (Berton & Järvelä 2021), the origin of which remains unclear. Since the wing velocity is defined relative to the [O III] core, its real velocity, compared to the restframe, is smaller than the previously reported value. Spatially resolved spectra would be needed to study the morphology and kinematics of [O III] in more detail.
5.2.42. J1713+3523
J1713+3523 (FBQS J1713+3523, z = 0.083) is an NLS1 that would be classified as radio-quiet based on the FIRST detection (Sint, 1.4 GHz = 11.24 mJy) or our data (Sint = 3.81 mJy), but it was detected at 22 GHz with the JVN with a whopping flux density of 138 mJy (Doi et al. 2016), implying extreme variability and jet activity. Interestingly, the 1.4–5.2 GHz spectral index is steep with α = −0.66, in agreement with our α map in Fig. B.215 whose total spectral index is −0.97. Assuming the less extreme spectral index of −0.66, the extrapolated 22 GHz flux density would be 1.47 mJy, requiring almost a hundred-fold increase in the flux density to achieve the observed 138 mJy. The spectral index between 5.2 and 22 GHz is 2.49, very close to the theoretical synchrotron self-absorption (SSA) limit. It should be noted that the observations are not simultaneous, the 22 GHz observations were performed in April 2014, and the JVLA observations in September 2015. However, radio flares usually propagate from higher to lower frequencies within timescales from several months to a few years, so if anything the 22 GHz flare should have increased the 5.2 GHz flux density at the time of our observation, if it would have propagated to such low frequencies, so the estimated spectral index should be indicative of the real spectral index.
The 22 GHz observation was done with the JVN, so it probes milliarcsecond-scale emission in the source. J1713+3523 lies at z = 0.083, giving a scale of 1.562 pc mas−1, and thus the observed flux density must have come from a region of some tens of parsecs across. It is interesting that we do not see any signs of the flattening of the spectral index in our α map, which would have been expected to happen if the 22 GHz flare would have propagated to lower frequencies. An alternative to a conventional AGN radio flare is that the 22 GHz flare was a sign of recently started jet activity in J1713+3523, as seen in high-frequency peakers (HFPs). In this case there could exist a quasi-stationary feature at higher radio frequencies, with the inverted radio spectrum produced by SSA (O’Dea & Saikia 2021) or free-free absorption by the ionised gas produced in the bow shock of the jet (Bicknell et al. 1997). The [O III] lines of J1713+3523 are extremely blueshifted with v = −674 km s−1, providing further support of the influence of a jet still confined within its host galaxy and in interaction with the interstellar medium. Interestingly, no [O III] wing is present in this source.
The whole radio emission seen in the JVLA observation of J1713+3523 could be explained by star formation, as the W3 flux density is ∼17.8 mJy higher than S1.4 GHz, JVLA, and Sint and S5.2 GHz, CDFS are roughly the same. On the other hand, the near-infrared colour, W3–W4 = 2.11, nor the q22 of 0.62, do not necessarily indicate strong star formation. However, the source is not extraordinarily bright, with log νLν, int = 39.54 erg s−1, lower than for jetted sources in B18 in general. The higher-frequency observations confirm the presence of a jet, but it does not seem to dominate the 5.2 GHz radio emission.
5.2.43. J2242+2943
J2242+2043 (Ark 564, z = 0.025) is a radio-quiet NLS1 with a peak flux density of 5.61 mJy beam−1, and an integrated flux density of 10.33 mJy that gives quite a low luminosity of log νLν, int = 38.88 erg s−1. It was detected in NVSS with a flux density of 29.1 mJy, yielding a spectral index of −0.79 between 1.4 and 5.2 GHz, and at 95 GHz with a flux density of 1.14 mJy (Behar et al. 2015), giving a spectral index of −0.76 between 5.2 and 95 GHz. These results are consistent with our α map (Fig. B.220), which has a total spectral index of −0.81, and a core spectral index of −0.85. The radio morphology of the source is clearly elongated towards the north, as also found in previous studies (e.g., Moran 2000), and the spectral index seems to slightly flatten northwards. The tapered maps (Figs. B.222 and B.223) do not show any additional structures, and the radio emission is confined within the bulge of a galaxy with a barred spiral morphology (Fig. B.224). This source exhibits complex X-ray properties as both relativistic and sub-relativistic outflows have been detected (e.g., Gupta et al. 2013a,b; Khanna et al. 2016).
Whereas the asymmetric radio morphology indicates that J2242+2943 possesses a jet or a wind that produces radio emission, the star formation proxies suggest that also star formation is present. The W3–W4 colour is 2.57, q22 is 1.16, and the W3 flux density is as much as ∼123.8 mJy higher than S1.4 GHz, JVLA, and Sint and S5.2 GHz, CDFS are comparable. The low radio luminosity of the source also suggests that a possible jet cannot be very powerful, supported by the fact that no shift is seen in the [O III] lines. However, an [O III] wing is detected, with the velocity and the FWHM of −564 and 1090 km s−1, respectively, so the mid-infrared emission might be enhanced by AGN-heated dust emission. It seems plausible that the radio emission is a combination of AGN and star-formation-related processes, but nothing definite can be said before more detailed observations.
5.2.44. J2314+2243
J2314+2243 (RX J2314.9+2243, z = 0.169) is a radio-quiet source with a peak flux density of 6.17 mJy beam−1, and an integrated flux density of 7.02 mJy. It was also detected in NVSS with a flux density of 18.7 mJy, giving a spectral index of −0.75 between 1.4 and 5.2 GHz. This value is in agreement with our α map in Fig. B.225: the total spectral index is −0.81, and the core spectral index is −0.85. The radio maps do not show any distinctive features, nor does the host galaxy in Fig. B.229, within which the radio emission is confined.
The W3–W4 colour (2.33) and q22 (0.85) do not indicate strong star formation, and also Sint is ∼4.5 mJy higher than S5.2 GHz, CDFS. However, SW3 is 43.8 mJy higher than S1.4 GHz, JVLA. The origin of this excess emission can be either star formation in the host galaxy or AGN-heated dust. The existence of a strong [O III] wing with a velocity of −1031 km s−1 and a FWHM of 1579 km s−1 is in favour of the AGN-heated, possibly polar, dust being a major contributor to the mid-infrared emission. J2314+2243 would be unusually bright for a purely star forming galaxy, with log νLν, int = 40.48 erg s−1, so it seems possible that the AGN is the main source of the radio emission. J2314+2243 could be another candidate for a CSS-like source.
6. Extraordinary diversity of NLS1s
The most notable result is the remarkable diversity of NLS1s: They show a host of different components contributing to the radio, as well as the mid-infrared emission, and no two sources are alike. Spatially resolved spectral index map utilised in this paper offer a clear advantage in disentangling these components when compared to conventional ways of determining the spectral indices, which usually give one value for the whole emitting region. The α maps allow us to examine the spectral index and its changes over the whole emitting region, and determine the most plausible origin of the emission in different parts of the source. In addition, the associated errors of the α maps derived using the mt-mfs method are considerably smaller than the errors for conventional estimates. Using this method, complemented by data at other wavelengths, some NLS1 groups with similar properties can be identified, and are discussed below.
6.1. AGN-dominated sources
In about one third of the sources in our sample the radio emission is clearly dominated by the AGN. These sources are characterised by moderate to high radio luminosities (all but one have log νLν, int > 39.00 erg s−1), asymmetric radio morphologies, and/or variable radio emission, and flat spectral indices in some cases. We can see considerable diversity even within this group, probably due to different ages, inclination angles, and environments of the sources.
6.1.1. Large-scale jets
A few of our sources exhibit radio jets with extents of the order of tens of kiloparsecs, with the jets reaching well outside the host galaxy. In some sources we are also able to detect counter-jet emission, indicating that these sources are seen at rather large inclination angles, and projection effects cannot be responsible for the narrowness of their permitted lines.
Based on simple travel-time arguments these sources cannot be kinematically very young, and must have maintained the jets for quite a long period of time for them to propagate through the host interstellar medium. Czerny et al. (2009) propose that intermittent activity due to radiation pressure instabilities of the accretion disk could be common in young radio sources accreting at high rates; the active, jetted phases would last for 103−104 years, separated by inactive, non-jetted periods of 104 − 106 years. It is unclear whether such short activity periods can be responsible for the kiloparsec-scale emission seen in these impressive sources since the final extent of the radio emission after the jets have turned off depends on several factors, for example, the jet power, the length of the activity period, and the properties of the medium it is expanding into.
Interestingly, one source in our sample, J1302+1624, shows possible relic emission with a very steep spectral index. This seems to be a consequence of its jets changing direction (Congiu et al. 2020), and with the current data we cannot say whether the jets turned off at some point or not. On the other hand, the most extended NLS1 discovered so far, J0814+5609, does not show signs of intermittent activity, and based on its flat core and observations at other radio frequencies the jets are currently active. However, this source might represent a transition object between NLS1s and broad-line radio galaxies, since its black hole mass is large for an NLS1 (108.44 M⊙; Berton et al. 2016b), and its FWHM(Hβ) on the threshold between NLS1s and BLS1s (2164 km s−1; Foschini et al. 2015). The other sources with large-scale jet emission in our sample do not show signs of intermittency either, and their black hole masses are well below 108 M⊙, implying that large-scale jets are not exclusively a property of high black hole mass sources. Morphologically, these sources resemble small broad-line radio galaxies, and are further proof that eventually some NLS1s might evolve into fully developed radio galaxies (Berton et al. 2016a).
6.1.2. Compact sources and small-scale jets
Another group whose radio emission is dominated by the AGN are the sources with compact morphologies that show no or moderate extended radio emission or small-scale jets. In these sources the high AGN activity – usually in the form of jets – was confirmed by, for example, a flat spectrum, a high luminosity, variability, or previous high-resolution radio observations. Interestingly, many of these sources are nominally radio-quiet, casting yet another shadow over the use of radio-loudness parameter as a proxy of AGN activity.
The compactness of these sources indicates that they are either less extended, and thus possibly younger sources, or seen at smaller inclination angles. The latter might be true, especially in case of the most luminous sources, where the emission is probably enhanced by considerable beaming. The lower-luminosity sources are probably either seen at large enough angles for the beaming not to have considerable effects and/or host slower, sub-relativistic jets.
An interesting individual is J1633+4718 since it resides in a late-type galaxy, hosts most likely relativistic jets, and is interacting with another late-type galaxy (Olguín-Iglesias et al. 2020). It has been hypothesised that interaction might play a role in triggering the nuclear activity (Taniguchi 1999; Barth et al. 2008; Urrutia et al. 2008; Ellison et al. 2011), and seems like jetted NLS1s might be a great example of this, since previous studies have shown that interaction and mergers are more common among jetted than non-jetted NLS1s (e.g., Olguín-Iglesias et al. 2017; Järvelä et al. 2018; Berton et al. 2019). However, it should be remembered that in general the jetted sources reside at higher redshifts than the non-jetted ones that have been studied, and the impact of this difference has not been properly addressed yet.
6.1.3. CSS-like sources
We identify five new NLS1s that exhibit properties consistent with the CSS classification: J0806+7238, J1047+4725, J1138+3653, J1348+2622, and J2314+2243. These sources show compact morphology, steep spectral index, and luminosity that is too high to be explained by star formation or even a starburst. Three out of five sources exceed the traditional luminosity threshold for CSS sources at 5 GHz (log νLν, int = 40.60 erg s−1), and the luminosities of the other two are log νLint > 40.00 erg s−1.
A link between NLS1s and CSS sources has already been suggested several times, and some NLS1s have been identified as CSS sources in the literature (e.g., Oshlack et al. 2001; Gallo et al. 2006; Caccianiga et al. 2014; Berton et al. 2016a). These results lead to a tentative model where some CSS sources, especially the low-luminosity compact objects (LLCs) could be a part of the parent population of jetted NLS1s (Berton et al. 2016a). According to Kunert-Bajraszewska & Labiano (2010) some LLCs can be classified as high-excitation sources, similarly to NLS1s, and their intrinsic properties, such as black hole mass and Eddington ratio distributions, show significant overlap with beamed NLS1s. Also, their radio luminosity functions are consistent with each other, when beaming is taken into account, and they show similar, simple radio morphologies, without considerable diffuse emission.
What is not yet known is if their host galaxies, and larger, group- and cluster-scale environments, are similar, and if so, to what extent (O’Dea & Saikia 2021). The environments of high-excitation LLCs and most CSS-like NLS1s have not been studied systematically, and also the knowledge of the environments of beamed NLS1s is far from comprehensive. An additional issue that must be taken into account in future studies is the selection criteria of LLCs: In Kunert et al. (2002) sources have 5 GHz flux densities > 150 mJy, and in Kunert-Bajraszewska et al. (2010) they have 1.4 GHz flux densities > 70 mJy. Most CSS-like NLS1s are fainter than this; therefore, in order to have comparable luminosities, they must be at higher redshifts, which might induce some selection biases in the samples. However, the unification scenario of sub-populations of NLS1s and CSS sources should definitely be studied further.
6.1.4. Large-scale outflows
A third group of AGN-dominated sources are the ones with large-scale outflows. These sources are rather scarce in our sample, but this might partially be because without higher-resolution observations they are hard to distinguish from sources with slow, poorly collimated jets. Also, their luminosities are quite low, so unless they can be identified based on the morphology, or actual observations of the outflow, they can easily go undetected. Outflows and jets can also co-exist (for example, J1703+4540, Gu & Chen 2010; Longinotti et al. 2018), and since the radio emission of the jet is generally brighter than the outflow radio emission, the jet dominates the radio band.
J0804+7248 is an example of a source than could host an outflow instead of a jet: it is only moderately luminous, its radio morphology it clearly asymmetric, but does not look collimated, and its [O III] lines are blueshifted, implying that the NLR is experiencing bulk motion. Another similar source, J0632+6340, shows a two-sided non-collimated radio morphology at the same PA as [O III] ionisation cones, and has a very low luminosity, implying that the low-speed jets or outflows have very low power.
6.2. Host-dominated sources
About a dozen of our sources seem to be dominated by radio emission that originates from the host galaxy, that is, from star-formation-related processes. They do not show any clear signs of AGN activity in radio, and the star formation activity is sufficient to explain their radio emission. Their radio morphologies are generally featureless, and the emission is confined within the host, or even the host bulge, hinting at circumnuclear star formation. In some cases the radio morphology is scattered in patches around the core, and in some cases it seems to trace the host galaxy features. The sources for which BPT diagram data exist are consistently classified as star-forming galaxies, suggesting that the stars are the main source of the ionising continuum. Interestingly, more than half of these sources show a prominent [O III] wing, indicating that nuclear winds reaching the inner NLR are present.
6.3. Composite sources
Approximately one third of the sources can be classified as composite: in these sources both the AGN and the host galaxy have a significant contribution to the total radio emission. These sources show a mixed variety of properties characteristic for AGN-dominated as well as for star formation dominated sources. They can show, for example, a flat spectrum core, radio morphology resembling a jet, or very high luminosity, and on the other hand, for example, patchy radio emission reminiscent of circumnuclear star formation, PAH features, or other positive star formation proxies, indicating star formation even at a starburst level. The different BPT diagrams also often give mixed results for these sources, indicating that both the AGN and the starlight continuum are significant. In addition, different kinds of outflows have been detected in these sources, including UFOs, BLR and NLR outflows, and molecular outflows. As a cherry on top, one of these sources was identified as a water maser source.
The ensemble of properties seen in these sources beautifully demonstrates why NLS1s should not be treated as a class consisting of similar sources, but should be treated as individuals. Caution should also be exercised when using simple diagnostic tools since they cannot properly take the versatility seen in these sources into account and might give misleading results when used on their own. This matter is further discussed in Sect. 6.4.
6.3.1. Peculiar sources
There are some unique sources that do not fit any of the categories described earlier. An obvious one is J1337+2423 that in closer inspection turned out not to be an NLS1, but a BLS1 galaxy (Lee et al. 2013). This source highlights a possibly bigger issue in the identification on different types of Seyferts: most of them have been classified based on quite low signal-to-noise (S/N) ratio spectra, and often using automated algorithms. Subtle, but crucial, details of the emission lines, such as the wings, cannot be properly modelled using low S/N data, but can easily lead to misclassification of NLS1s and BLS1s, and confusion with intermediate Seyferts (Järvelä et al. 2020; Peruzzi et al. 2021). Mixed samples will add undesired noise to statistical population studies, and hinder our efforts to understand the nature of the different classes of AGN.
J1038+4227 is another extremely interesting object, since its radio morphology does not resemble anything we see in other NLS1s. However, its optical spectrum clearly identifies it as one: its FWHM(Hβ) = 1979 km s−1, and it shows very strong Fe II multiplets. Were it a more evolved source, for example, an FSRQ with a flattened BLR seen face-on, we would not expect to see iron in the spectrum (Marziani et al. 2018b; Berton et al. 2020a). J1038+4227 is a luminous source, and since the core is responsible for most of its radio emission, and shows a steep spectral index it would be consistent with a CSS classification. The symmetrical, almost circular, faint radio emission reaching well outside the host galaxy is what sets J1038+4227 apart from other NLS1s. Due to its huge size its origin is probably the AGN, and it seems plausible that it is a radio lobe. It resembles the kiloparsec-scale morphologies seen in some blazars (Kharb et al. 2010), but is considerably fainter. Unfortunately, this structure is too faint to estimate its spectral index, and derive any information about its age or whether its a relic or still replenished. However, taking into account its circular shape it seems as if the jet must have pointed close to our line of sight, which does not seem to be the case right now; otherwise, we would expect to see a flatter spectral index in the core. The nature of this source remains unclear for now, but it definitely deserves to be studied in detail in the future.
The third source that stands out is J1713+3523. It has a steep spectral index at least up to 5.2 GHz, and does not show strong signs of AGN activity at that frequency. In fact, its 5.2 GHz radio emission could be explained with star formation alone. However, a 22 GHz detection of 138 mJy is undeniable proof that this source hosts at least moderately powerful jets, and it furthermore yields a 5.2–22 GHz spectral index close to the theoretical SSA maximum. It is interesting that no signs of the jets are seen at lower frequencies. This source somewhat resembles an extraordinary group of previously radio-quiet or totally radio-silent NLS1s, first discovered at 37 GHz due to their bright (hundreds of mJy), and variable radio emission, characteristic for relativistic jets (Lähteenmäki et al. 2018). These sources were later observed with the JVLA, and all of them showed a steep 1.6–9.0 GHz radio spectrum, with no signs of possible jets (Berton et al. 2020b). The nature of these sources is still somewhat unclear, but absorption, either SSA or free-free has been suggested as the culprit behind their unusual radio spectra. More observations of J1713+2523 are certainly needed to explain the observed properties of this source.
6.4. Implications and issues
The results of this paper strengthen the view of NLS1s as a wonderfully diverse class of sources. However, this versatility might also cause additional trouble, especially when studying larger samples of sources, rather than individuals, and thus caution is required when dealing with large samples and/or statistical studies. Below we discuss the biggest issues resulting from this diversity.
6.4.1. NLS1s are not a homogeneous class
It cannot be stressed enough that the variety of sources under the NLS1 umbrella is vast. After all, the classification is based solely on the narrowness of the permitted lines, which indicates an under-massive black hole, and the oxygen-to-hydrogen ratio, which ensures they are Type 1 sources. This does not tell us anything about the activity state of the AGN, and it ranges from radio-silent sources to rare individuals that are able to maintain fully developed relativistic jets. It also does not reflect the properties of the host galaxy, and in NLS1s the AGN rarely dominates the whole electromagnetic spectrum over the host, unlike in quasars or blazars. Even if this might be true also for some NLS1s, the majority does not fit one mould, as demonstrated in this paper. It should also be kept in mind that the radio view of NLS1s is very different than the optical view, and whereas their optical spectra are similar, the radio properties absolutely are not.
6.4.2. Advice against using simple proxies
The amazing diversity of NLS1s, and the varying contributions of the AGN and the host along the electromagnetic spectrum can have unexpected effects when using relations and proxies possibly calibrated with more homogeneous or simple samples of sources. This has been continuously demonstrated regarding the use of the radio-loudness parameter, which might have originally served as an acceptable first order estimate of the activity of the AGN but fails to perform when more complicated sources are included in the scenario (Järvelä et al. 2017; Padovani 2017).
In this paper we used several star formation diagnostics based on mid-infrared data, or relations between radio and mid-infrared. It soon became evident that these proxies were not ideal tools to estimate the strength of star formation in our sources. They often show results contradicting each other, as well as results in the literature obtained with more reliable methods, for example, PAH features. It is possibly the complexity of NLS1s that fool these proxies, and especially in mid-infrared the presence of an emphasised dust component that can mimic the properties of emission produced by star formation. Nevertheless, we decided to include these diagnostics in our results to highlight their behaviour in the case of NLS1s, and as a general caution for future, especially statistical, studies using similar diagnostics.
7. Summary and conclusions
In this paper we analysed 44 NLS1 galaxies by means of spatially resolved radio spectral index maps. In addition, we employed mid-infrared diagnostics to estimate the star formation activity in their hosts. With these tools, complemented by archival data, we estimated the predominant source or sources of radio emission in them. Based on these analyses, our main conclusions can be summarised as follows.
-
Narrow-line Seyfert 1 galaxies are an exceptionally heterogeneous class of AGN, and in the radio band they range from individuals with blazar-like and radio-galaxy-like characteristics to sources whose radio emission is dominated by the star formation activity in the host galaxy. Furthermore, some of them could actually be classified as CSS sources in addition to the NLS1 classification, thus providing further confirmation of the scenario in which NLS1s are AGN in an early evolutionary stage.
-
Due to this diversity and the varying contributions of different sources of radio as well as mid-infrared emission, NLS1s are not ideal targets for simple proxies, such as the radio loudness parameter or star formation diagnostics.
-
As the NLS1 classification is based solely on their optical spectrum, and includes all Type 1 sources with narrow permitted lines, it does not reflect their other physical properties, for example in the radio band. As a result, the NLS1 classification does not tell us much since these sources do not necessarily share similar physical properties. Also, the threshold of FWHM(Hβ) = 2000 km s−1 is somewhat arbitrary and should not be regarded as a real physical limit. These remarks should especially be kept in mind when studying NLS1s as a class or using the general NLS1 population in wider AGN studies.
Narrow-line Seyfert 1 galaxies are complicated sources, and any conclusions regarding the whole class cannot and should not be drawn lightly. Instead, these sources should be first and foremost studied as individuals, at least until we understand their nature, distinctive sub-classes, and characteristics better. As demonstrated by this study, the majority of NLS1s require very high-quality data and detailed data analysis to disentangle the contributions of the different elements. And even still, many of the sources in our sample will require further observations (e.g. in the radio at higher resolution) or integral field spectroscopy to unquestionably determine their nature and their physical properties. Future facilities, such as the Cherenkov Telescope Array (CTA), the Advanced Telescope for High Energy Astrophysics (ATHENA), and Euclid, will also be essential for improving our understanding of this peculiar class of objects. Despite their complexity, NLS1s are definitely a class worth investigating. The jetted NLS1s are an ideal laboratory for studying the launching of jets and the first stages of the evolution of more powerful FSRQs and high-excitation radio galaxies. In NLS1s, the interplay between the host and several AGN-related phenomena, for example jets and outflows, generally offers a great opportunity for examining the AGN feedback in action.
R4570 is the flux ratio of Fe II and Hβ.
If the BLR is virialised, the velocity dispersion of the gas clouds, i.e., the FWHM of the permitted lines, depends quadratically on the mass of the central object. Narrow permitted lines, then, may originate because of an under-massive black hole.
Radio-quiet AGN by definition have a ratio Sradio/Soptical < 10, where S are the flux densities at 5 GHz and in the B band, respectively (Kellermann et al. 1989). Radio-silent sources have no known detection in radio.
Radio loudness is defined as the ratio between the 5 GHz flux density and the B band flux density (Kellermann et al. 1989). Sources with radio loudness > 10 are classified as radio-loud, and sources with radio loudness < 10 as radio-quiet.
Assuming a spectral index of −1, the diffuse emission luminosity threshold between Fanaroff-Riley I and II radio galaxies at 5 GHz is ∼ log νLν = 39.5 erg s−1.
Acknowledgments
E.J. is a current ESA research fellow. E.C. acknowledges support from ANID project Basal AFB-170002. The National Radio Astronomy Observatory is a facility of the National Science Foundation operated under cooperative agreement by Associated Universities, Inc. This publication makes use of data products from the Wide-field Infrared Survey Explorer, which is a joint project of the University of California, Los Angeles, and the Jet Propulsion Laboratory/California Institute of Technology, funded by the National Aeronautics and Space Administration. The Pan-STARRS1 Surveys (PS1) and the PS1 public science archive have been made possible through contributions by the Institute for Astronomy, the University of Hawaii, the Pan-STARRS Project Office, the Max-Planck Society and its participating institutes, the Max Planck Institute for Astronomy, Heidelberg and the Max Planck Institute for Extraterrestrial Physics, Garching, The Johns Hopkins University, Durham University, the University of Edinburgh, the Queen’s University Belfast, the Harvard-Smithsonian Center for Astrophysics, the Las Cumbres Observatory Global Telescope Network Incorporated, the National Central University of Taiwan, the Space Telescope Science Institute, the National Aeronautics and Space Administration under Grant No. NNX08AR22G issued through the Planetary Science Division of the NASA Science Mission Directorate, the National Science Foundation Grant No. AST-1238877, the University of Maryland, Eotvos Lorand University (ELTE), the Los Alamos National Laboratory, and the Gordon and Betty Moore Foundation. Funding for the Sloan Digital Sky Survey (SDSS) has been provided by the Alfred P. Sloan Foundation, the Participating Institutions, the National Aeronautics and Space Administration, the National Science Foundation, the U.S. Department of Energy, the Japanese Monbukagakusho, and the Max Planck Society. The SDSS Web site is http://www.sdss.org/. The SDSS is managed by the Astrophysical Research Consortium (ARC) for the Participating Institutions. The Participating Institutions are The University of Chicago, Fermilab, the Institute for Advanced Study, the Japan Participation Group, The Johns Hopkins University, the Korean Scientist Group, Los Alamos National Laboratory, the Max-Planck-Institute for Astronomy (MPIA), the Max-Planck-Institute for Astrophysics (MPA), New Mexico State University, University of Pittsburgh, University of Portsmouth, Princeton University, the United States Naval Observatory, and the University of Washington. Thank you coffee and sparkling wine. This research has made use of the NASA/IPAC Extragalactic Database (NED), which is operated by the Jet Propulsion Laboratory, California Institute of Technology, under contract with the National Aeronautics and Space Administration. This research has made use of the SIMBAD database, operated at CDS, Strasbourg, France.
References
- Alonso-Herrero, A., Poulton, R., Roche, P. F., et al. 2016, MNRAS, 463, 2405 [NASA ADS] [CrossRef] [Google Scholar]
- Antón, S., Browne, I. W. A., & Marchã, M. J. 2008, A&A, 490, 583 [NASA ADS] [CrossRef] [EDP Sciences] [Google Scholar]
- Asmus, D. 2019, MNRAS, 489, 2177 [NASA ADS] [CrossRef] [Google Scholar]
- Asmus, D., Hönig, S. F., & Gandhi, P. 2016, ApJ, 822, 109 [NASA ADS] [CrossRef] [Google Scholar]
- Baldi, R. D., Williams, D. R. A., McHardy, I. M., et al. 2018, MNRAS, 476, 3478 [Google Scholar]
- Baldwin, J. A., Phillips, M. M., & Terlevich, R. 1981, PASP, 93, 5 [Google Scholar]
- Barth, A. J., Bentz, M. C., Greene, J. E., & Ho, L. C. 2008, ApJ, 683, L119 [NASA ADS] [CrossRef] [Google Scholar]
- Baum, S. A., O’Dea, C. P., Dallacassa, D., de Bruyn, A. G., & Pedlar, A. 1993, ApJ, 419, 553 [NASA ADS] [CrossRef] [Google Scholar]
- Becker, R. H., White, R. L., & Edwards, A. L. 1991, ApJS, 75, 1 [Google Scholar]
- Becker, R. H., White, R. L., & Helfand, D. J. 1995, ApJ, 450, 559 [Google Scholar]
- Behar, E., Baldi, R. D., Laor, A., et al. 2015, MNRAS, 451, 517 [NASA ADS] [CrossRef] [Google Scholar]
- Berton, M., & Järvelä, E. 2021, Universe, 7, 188 [NASA ADS] [CrossRef] [Google Scholar]
- Berton, M., Caccianiga, A., Foschini, L., et al. 2016a, A&A, 591, A98 [NASA ADS] [CrossRef] [EDP Sciences] [Google Scholar]
- Berton, M., Foschini, L., Ciroi, S., et al. 2016b, A&A, 591, A88 [NASA ADS] [CrossRef] [EDP Sciences] [Google Scholar]
- Berton, M., Foschini, L., Caccianiga, A., et al. 2017, Front. Astron. Space Sci., 4, 8 [NASA ADS] [CrossRef] [Google Scholar]
- Berton, M., Congiu, E., Järvelä, E., et al. 2018, A&A, 614, A87 [NASA ADS] [CrossRef] [EDP Sciences] [Google Scholar]
- Berton, M., Congiu, E., Ciroi, S., et al. 2019, AJ, 157, 48 [NASA ADS] [CrossRef] [Google Scholar]
- Berton, M., Björklund, I., Lähteenmäki, A., et al. 2020a, Contrib. Astron. Obs. Skalnate Pleso, 50, 270 [NASA ADS] [Google Scholar]
- Berton, M., Järvelä, E., Crepaldi, L., et al. 2020b, A&A, 636, A64 [NASA ADS] [CrossRef] [EDP Sciences] [Google Scholar]
- Bhatnagar, S., Rau, U., & Golap, K. 2013, ApJ, 770, 91 [Google Scholar]
- Bian, W.-H., & Huang, K. 2010, MNRAS, 401, 507 [NASA ADS] [CrossRef] [Google Scholar]
- Bicay, M. D., Kojoian, G., Seal, J., Dickinson, D. F., & Malkan, M. A. 1995, ApJS, 98, 369 [NASA ADS] [CrossRef] [Google Scholar]
- Bicknell, G. V., Dopita, M. A., & O’Dea, C. P. O. 1997, ApJ, 485, 112 [NASA ADS] [CrossRef] [Google Scholar]
- Boller, T., Keil, R., Trümper, J., et al. 2001, A&A, 365, L146 [NASA ADS] [CrossRef] [EDP Sciences] [Google Scholar]
- Boroson, T. A., & Green, R. F. 1992, ApJS, 80, 109 [Google Scholar]
- Boyle, B. J., Cornwell, T. J., Middelberg, E., et al. 2007, MNRAS, 376, 1182 [NASA ADS] [CrossRef] [Google Scholar]
- Brinkmann, W., Siebert, J., Reich, W., et al. 1995, A&AS, 109, 147 [NASA ADS] [Google Scholar]
- Buhariwalla, M. Z., Waddell, S. G. H., Gallo, L. C., Grupe, D., & Komossa, S. 2020, ApJ, 901, 118 [NASA ADS] [CrossRef] [Google Scholar]
- Burtscher, L., Jaffe, W., Raban, D., et al. 2009, ApJ, 705, L53 [NASA ADS] [CrossRef] [Google Scholar]
- Buta, R. J. 2017, MNRAS, 471, 4027 [NASA ADS] [CrossRef] [Google Scholar]
- Caccianiga, A., Antón, S., Ballo, L., et al. 2014, MNRAS, 441, 172 [NASA ADS] [CrossRef] [Google Scholar]
- Caccianiga, A., Antón, S., Ballo, L., et al. 2015, MNRAS, 451, 1795 [NASA ADS] [CrossRef] [Google Scholar]
- Caccianiga, A., Dallacasa, D., Antón, S., et al. 2017, MNRAS, 464, 1474 [NASA ADS] [CrossRef] [Google Scholar]
- Chainakun, P., & Young, A. J. 2017, MNRAS, 465, 3965 [NASA ADS] [CrossRef] [Google Scholar]
- Chamani, W., Savolainen, T., Hada, K., & Xu, M. H. 2021, A&A, 652, A14 [NASA ADS] [CrossRef] [EDP Sciences] [Google Scholar]
- Chen, S., Järvelä, E., Crepaldi, L., et al. 2020, MNRAS, 498, 1278 [NASA ADS] [CrossRef] [Google Scholar]
- Christopoulou, P. E., Holloway, A. J., Steffen, W., et al. 1997, MNRAS, 284, 385 [NASA ADS] [CrossRef] [Google Scholar]
- Cohen, A. S., Lane, W. M., Cotton, W. D., et al. 2007, AJ, 134, 1245 [Google Scholar]
- Condon, J. J. 1992, ARA&A, 30, 575 [Google Scholar]
- Condon, J. J., Cotton, W. D., Greisen, E. W., et al. 1998, AJ, 115, 1693 [Google Scholar]
- Congiu, E., Berton, M., Giroletti, M., et al. 2017a, A&A, 603, A32 [NASA ADS] [CrossRef] [EDP Sciences] [Google Scholar]
- Congiu, E., Contini, M., Ciroi, S., et al. 2017b, Front. Astron. Space Sci., 4, 27 [CrossRef] [Google Scholar]
- Congiu, E., Kharb, P., Tarchi, A., et al. 2020, MNRAS, 499, 3149 [NASA ADS] [CrossRef] [Google Scholar]
- Crenshaw, D. M., Kraemer, S. B., & Gabel, J. R. 2003, AJ, 126, 1690 [NASA ADS] [CrossRef] [Google Scholar]
- Croft, S., Bower, G. C., Ackermann, R., et al. 2010, ApJ, 719, 45 [NASA ADS] [CrossRef] [Google Scholar]
- Czerny, B., Siemiginowska, A., Janiuk, A., Nikiel-Wroczyński, B., & Stawarz, Ł. 2009, ApJ, 698, 840 [NASA ADS] [CrossRef] [Google Scholar]
- da Cunha, E., Charlot, S., & Elbaz, D. 2008, MNRAS, 388, 1595 [Google Scholar]
- Dalla Bontà, E., Peterson, B. M., Bentz, M. C., et al. 2020, ApJ, 903, 112 [CrossRef] [Google Scholar]
- D’Ammando, F., Acosta-Pulido, J. A., Capetti, A., et al. 2017, MNRAS, 469, L11 [CrossRef] [Google Scholar]
- D’Ammando, F., Acosta-Pulido, J. A., Capetti, A., et al. 2018, MNRAS, 478, L66 [NASA ADS] [Google Scholar]
- Decarli, R., Dotti, M., Fontana, M., & Haardt, F. 2008, MNRAS, 386, L15 [NASA ADS] [Google Scholar]
- Deller, A. T., & Middelberg, E. 2014, AJ, 147, 14 [Google Scholar]
- Deo, R. P., Crenshaw, D. M., & Kraemer, S. B. 2006, AJ, 132, 321 [NASA ADS] [CrossRef] [Google Scholar]
- Dicken, D., Tadhunter, C., Axon, D., et al. 2009, ApJ, 694, 268 [NASA ADS] [CrossRef] [Google Scholar]
- Doi, A., Fujisawa, K., Inoue, M., et al. 2007, PASJ, 59, 703 [NASA ADS] [Google Scholar]
- Doi, A., Asada, K., & Nagai, H. 2011, ApJ, 738, 126 [NASA ADS] [CrossRef] [Google Scholar]
- Doi, A., Asada, K., Fujisawa, K., et al. 2013, ApJ, 765, 69 [NASA ADS] [CrossRef] [Google Scholar]
- Doi, A., Wajima, K., Hagiwara, Y., & Inoue, M. 2015, ApJ, 798, L30 [Google Scholar]
- Doi, A., Oyama, T., Kono, Y., et al. 2016, PASJ, 68, 73 [NASA ADS] [CrossRef] [Google Scholar]
- Dressel, L. L., & Condon, J. J. 1978, ApJS, 36, 53 [NASA ADS] [CrossRef] [Google Scholar]
- Du, P., & Wang, J.-M. 2019, ApJ, 886, 42 [NASA ADS] [CrossRef] [Google Scholar]
- Du, P., Zhang, Z.-X., Wang, K., et al. 2018, ApJ, 856, 6 [NASA ADS] [CrossRef] [Google Scholar]
- Edelson, R. A. 1987, ApJ, 313, 651 [NASA ADS] [CrossRef] [Google Scholar]
- Edelson, R. A., & Malkan, M. A. 1986, ApJ, 308, 59 [CrossRef] [Google Scholar]
- Ellison, S. L., Patton, D. R., Mendel, J. T., & Scudder, J. M. 2011, MNRAS, 418, 2043 [NASA ADS] [CrossRef] [Google Scholar]
- Esparza-Arredondo, D., Osorio-Clavijo, N., González-Martín, O., et al. 2020, ApJ, 905, 29 [NASA ADS] [CrossRef] [Google Scholar]
- Esquej, P., Alonso-Herrero, A., González-Martín, O., et al. 2014, ApJ, 780, 86 [Google Scholar]
- Faucher-Giguère, C.-A., & Quataert, E. 2012, MNRAS, 425, 605 [Google Scholar]
- Fischer, T. C., Crenshaw, D. M., Kraemer, S. B., & Schmitt, H. R. 2013, ApJS, 209, 1 [Google Scholar]
- Flewelling, H. A., Magnier, E. A., Chambers, K. C., et al. 2020, ApJS, 251, 7 [NASA ADS] [CrossRef] [Google Scholar]
- Foschini, L. 2011, Narrow-Line Seyfert 1 Galaxies and their Place in the Universe, https://pos.sissa.it/126/024/pdf [Google Scholar]
- Foschini, L. 2017, Front. Astron. Space Sci., 4, 6 [NASA ADS] [CrossRef] [Google Scholar]
- Foschini, L. 2020, Universe, 6, 136 [NASA ADS] [CrossRef] [Google Scholar]
- Foschini, L., Berton, M., Caccianiga, A., et al. 2015, A&A, 575, A13 [NASA ADS] [CrossRef] [EDP Sciences] [Google Scholar]
- Fraix-Burnet, D., Marziani, P., D’Onofrio, M., & Dultzin, D. 2017, Front. Astron. Space Sci., 4, 1 [NASA ADS] [Google Scholar]
- Fritz, J., Franceschini, A., & Hatziminaoglou, E. 2006, MNRAS, 366, 767 [Google Scholar]
- Gallimore, J. F., Axon, D. J., O’Dea, C. P., Baum, S. A., & Pedlar, A. 2006, AJ, 132, 546 [NASA ADS] [CrossRef] [Google Scholar]
- Gallo, L. C., Edwards, P. G., Ferrero, E., et al. 2006, MNRAS, 370, 245 [NASA ADS] [CrossRef] [Google Scholar]
- Ganci, V., Marziani, P., D’Onofrio, M., et al. 2019, A&A, 630, A110 [NASA ADS] [CrossRef] [EDP Sciences] [Google Scholar]
- Giroletti, M., & Panessa, F. 2009, ApJ, 706, L260 [NASA ADS] [CrossRef] [Google Scholar]
- Giroletti, M., Panessa, F., Longinotti, A. L., et al. 2017, A&A, 600, A87 [NASA ADS] [CrossRef] [EDP Sciences] [Google Scholar]
- Goad, M. R., Korista, K. T., & Ruff, A. J. 2012, MNRAS, 426, 3086 [Google Scholar]
- Gonzalez Delgado, R. M., & Perez, E. 1996, MNRAS, 278, 737 [NASA ADS] [CrossRef] [Google Scholar]
- González-Martín, O., Masegosa, J., García-Bernete, I., et al. 2019, ApJ, 884, 11 [Google Scholar]
- Goodrich, R. W. 1989, ApJ, 342, 224 [Google Scholar]
- Gregory, P. C., & Condon, J. J. 1991, ApJS, 75, 1011 [Google Scholar]
- Gruppioni, C., Berta, S., Spinoglio, L., et al. 2016, MNRAS, 458, 4297 [Google Scholar]
- Gu, M., & Chen, Y. 2010, AJ, 139, 2612 [NASA ADS] [CrossRef] [Google Scholar]
- Gu, M., Chen, Y., Komossa, S., et al. 2015, ApJS, 221, 3 [NASA ADS] [CrossRef] [Google Scholar]
- Gupta, A., Mathur, S., Krongold, Y., & Nicastro, F. 2013a, ApJ, 772, 66 [NASA ADS] [CrossRef] [Google Scholar]
- Gupta, A., Mathur, S., Krongold, Y., & Nicastro, F. 2013b, ApJ, 768, 141 [NASA ADS] [CrossRef] [Google Scholar]
- Gürkan, G., Hardcastle, M. J., Best, P. N., et al. 2019, A&A, 622, A11 [NASA ADS] [CrossRef] [EDP Sciences] [Google Scholar]
- Hagiwara, Y., Doi, A., Hachisuka, K., & Horiuchi, S. 2018, PASJ, 70, 54 [NASA ADS] [CrossRef] [Google Scholar]
- Hamilton, T. S., Berton, M., Antón, S., et al. 2021, MNRAS, 504, 5188 [NASA ADS] [CrossRef] [Google Scholar]
- Harrison, C. M., Alexander, D. M., Swinbank, A. M., et al. 2012, MNRAS, 426, 1073 [NASA ADS] [CrossRef] [Google Scholar]
- Heinz, S., & Sunyaev, R. A. 2003, MNRAS, 343, L59 [Google Scholar]
- Heisler, C. A., & Vader, J. P. 1994, AJ, 107, 35 [NASA ADS] [CrossRef] [Google Scholar]
- Hönig, S. F., Kishimoto, M., Tristram, K. R. W., et al. 2013, ApJ, 771, 87 [Google Scholar]
- Hutchings, J. B., & Craven, S. E. 1988, AJ, 95, 677 [NASA ADS] [CrossRef] [Google Scholar]
- Ibar, E., Cirasuolo, M., Ivison, R., et al. 2008, MNRAS, 386, 953 [NASA ADS] [CrossRef] [Google Scholar]
- Igo, Z., Parker, M. L., Matzeu, G. A., et al. 2020, MNRAS, 493, 1088 [NASA ADS] [CrossRef] [Google Scholar]
- Jackson, T. M., Rosario, D. J., Alexander, D. M., et al. 2020, MNRAS, 498, 2323 [NASA ADS] [CrossRef] [Google Scholar]
- Jarrett, T. H., Cohen, M., Masci, F., et al. 2011, ApJ, 735, 112 [Google Scholar]
- Järvelä, E., Lähteenmäki, A., Lietzen, H., et al. 2017, A&A, 606, A9 [NASA ADS] [CrossRef] [EDP Sciences] [Google Scholar]
- Järvelä, E., Lähteenmäki, A., & Berton, M. 2018, A&A, 619, A69 [NASA ADS] [CrossRef] [EDP Sciences] [Google Scholar]
- Järvelä, E., Berton, M., Ciroi, S., et al. 2020, A&A, 636, L12 [NASA ADS] [CrossRef] [EDP Sciences] [Google Scholar]
- Järvelä, E., Berton, M., & Crepaldi, L. 2021, Front. Astron. Space Sci., 8, 147 [CrossRef] [Google Scholar]
- Jiang, Y.-F., Ciotti, L., Ostriker, J. P., & Spitkovsky, A. 2010, ApJ, 711, 125 [NASA ADS] [CrossRef] [Google Scholar]
- Jin, C., Done, C., & Ward, M. 2021, MNRAS, 500, 2475 [Google Scholar]
- Jones, S., McHardy, I., & Maccarone, T. J. 2017, MNRAS, 465, 1336 [NASA ADS] [CrossRef] [Google Scholar]
- Kellermann, K. I., Sramek, R., Schmidt, M., Shaffer, D. B., & Green, R. 1989, AJ, 98, 1195 [Google Scholar]
- Kellermann, K. I., Sramek, R. A., Schmidt, M., Green, R. F., & Shaffer, D. B. 1994, AJ, 108, 1163 [Google Scholar]
- Khanna, S., Kaastra, J. S., & Mehdipour, M. 2016, A&A, 586, A2 [NASA ADS] [CrossRef] [EDP Sciences] [Google Scholar]
- Kharb, P., Lister, M. L., & Cooper, N. J. 2010, ApJ, 710, 764 [NASA ADS] [CrossRef] [Google Scholar]
- King, A. L., Miller, J. M., Cackett, E. M., et al. 2011, ApJ, 729, 19 [NASA ADS] [CrossRef] [Google Scholar]
- Kinney, A. L., Schmitt, H. R., Clarke, C. J., et al. 2000, ApJ, 537, 152 [Google Scholar]
- Kollatschny, W. 2003, A&A, 407, 461 [NASA ADS] [CrossRef] [EDP Sciences] [Google Scholar]
- Kollatschny, W., & Zetzl, M. 2011, Nature, 470, 366 [NASA ADS] [CrossRef] [Google Scholar]
- Komatsu, E., Smith, K. M., Dunkley, J., et al. 2011, ApJS, 192, 18 [Google Scholar]
- Komossa, S., Voges, W., Xu, D., et al. 2006, AJ, 132, 531 [NASA ADS] [CrossRef] [Google Scholar]
- Komossa, S., Xu, D. W., & Wagner, A. Y. 2018, MNRAS, 477, 5115 [CrossRef] [Google Scholar]
- Kotilainen, J. K., León-Tavares, J., Olguín-Iglesias, A., et al. 2016, ApJ, 832, 157 [CrossRef] [Google Scholar]
- Kozieł-Wierzbowska, D., Vale Asari, N., Stasińska, G., et al. 2021, ApJ, 910, 64 [CrossRef] [Google Scholar]
- Krongold, Y., Dultzin-Hacyan, D., & Marziani, P. 2001, AJ, 121, 702 [NASA ADS] [CrossRef] [Google Scholar]
- Kukula, M. J., Pedlar, A., Baum, S. A., & O’Dea, C. P. 1995, MNRAS, 276, 1262 [Google Scholar]
- Kukula, M. J., Dunlop, J. S., Hughes, D. H., & Rawlings, S. 1998, MNRAS, 297, 366 [NASA ADS] [CrossRef] [Google Scholar]
- Kunert, M., Marecki, A., Spencer, R. E., Kus, A. J., & Niezgoda, J. 2002, A&A, 391, 47 [NASA ADS] [CrossRef] [EDP Sciences] [Google Scholar]
- Kunert-Bajraszewska, M., & Labiano, A. 2010, MNRAS, 408, 2279 [NASA ADS] [CrossRef] [Google Scholar]
- Kunert-Bajraszewska, M., Gawroński, M. P., Labiano, A., & Siemiginowska, A. 2010, MNRAS, 408, 2261 [NASA ADS] [CrossRef] [Google Scholar]
- Lähteenmäki, A., Järvelä, E., Ramakrishnan, V., et al. 2018, A&A, 614, L1 [NASA ADS] [CrossRef] [EDP Sciences] [Google Scholar]
- LaMassa, S. M., Heckman, T. M., Ptak, A., et al. 2012, ApJ, 758, 1 [NASA ADS] [CrossRef] [Google Scholar]
- LaMassa, S. M., Ricarte, A., Glikman, E., et al. 2016, ApJ, 820, 70 [NASA ADS] [CrossRef] [Google Scholar]
- Lamperti, I., Saintonge, A., Koss, M., et al. 2020, ApJ, 889, 103 [Google Scholar]
- Laor, A. 2000, ApJ, 543, L111 [NASA ADS] [CrossRef] [Google Scholar]
- Laurent-Muehleisen, S. A., Kollgaard, R. I., Ryan, P. J., et al. 1997, A&AS, 122, 235 [NASA ADS] [CrossRef] [EDP Sciences] [Google Scholar]
- Lee, J. C., Kriss, G. A., Chakravorty, S., et al. 2013, MNRAS, 430, 2650 [NASA ADS] [CrossRef] [Google Scholar]
- Leftley, J. H., Hönig, S. F., Asmus, D., et al. 2019, ApJ, 886, 55 [NASA ADS] [CrossRef] [Google Scholar]
- Lianou, S., Barmby, P., Mosenkov, A. A., Lehnert, M., & Karczewski, O. 2019, A&A, 631, A38 [NASA ADS] [CrossRef] [EDP Sciences] [Google Scholar]
- Liao, N. H., Liang, Y. F., Weng, S. S., et al. 2017, Discovery of gamma-ray Emission from Steep Radio Spectrum NLS1s [Google Scholar]
- Lister, M. 2018, Revisiting Narrow-Line Seyfert 1 Galaxies and their Place in the Universe, 22 [Google Scholar]
- Longinotti, A. L., Vega, O., Krongold, Y., et al. 2018, ApJ, 867, L11 [CrossRef] [Google Scholar]
- Lyu, J., & Rieke, G. H. 2018, ApJ, 866, 92 [Google Scholar]
- Mahajan, S., Ashby, M. L. N., Willner, S. P., et al. 2019, MNRAS, 482, 560 [NASA ADS] [CrossRef] [Google Scholar]
- Maitra, D., Miller, J. M., Markoff, S., & King, A. 2011, ApJ, 735, 107 [NASA ADS] [CrossRef] [Google Scholar]
- Mallick, L., Dewangan, G. C., Gandhi, P., Misra, R., & Kembhavi, A. K. 2016, MNRAS, 460, 1705 [NASA ADS] [CrossRef] [Google Scholar]
- Martínez-Paredes, M., Aretxaga, I., González-Martín, O., et al. 2019, ApJ, 871, 190 [CrossRef] [Google Scholar]
- Marziani, P., Zamanov, R. K., Sulentic, J. W., & Calvani, M. 2003, MNRAS, 345, 1133 [NASA ADS] [CrossRef] [Google Scholar]
- Marziani, P., del Olmo, A., D’Onofrio, M., et al. 2018a, Proceedings of Science, Vol. Revisiting narrow-line Seyfert 1 galaxies and their place in the Universe, 2 [Google Scholar]
- Marziani, P., Dultzin, D., Sulentic, J. W., et al. 2018b, Front. Astron. Space Sci., 5, 6 [CrossRef] [Google Scholar]
- Mathur, S. 2000, MNRAS, 314, L17 [NASA ADS] [CrossRef] [Google Scholar]
- Mathur, S., Fields, D., Peterson, B. M., & Grupe, D. 2012, ApJ, 754, 146 [NASA ADS] [CrossRef] [Google Scholar]
- Meena, B., Crenshaw, D. M., Schmitt, H. R., et al. 2021, ApJ, 916, 31 [NASA ADS] [CrossRef] [Google Scholar]
- Miller, P., Rawlings, S., & Saunders, R. 1993, MNRAS, 263, 425 [NASA ADS] [Google Scholar]
- Moran, E. C. 2000, NewAR, 44, 527 [NASA ADS] [CrossRef] [Google Scholar]
- Mulchaey, J. S., Wilson, A. S., & Tsvetanov, Z. 1996, ApJS, 102, 309 [NASA ADS] [CrossRef] [Google Scholar]
- Muñoz Marín, V. M., González Delgado, R. M., Schmitt, H. R., et al. 2007, AJ, 134, 648 [CrossRef] [Google Scholar]
- Nagar, N. M., Wilson, A. S., Mulchaey, J. S., & Gallimore, J. F. 1999, ApJS, 120, 209 [Google Scholar]
- Neumann, M., Reich, W., Fuerst, E., et al. 1994, A&AS, 106, 303 [NASA ADS] [Google Scholar]
- Norris, R. P., Allen, D. A., Sramek, R. A., Kesteven, M. J., & Troup, E. R. 1990, ApJ, 359, 291 [NASA ADS] [CrossRef] [Google Scholar]
- O’Dea, C. P. 1998, PASP, 110, 493 [Google Scholar]
- O’Dea, C. P., & Saikia, D. J. 2021, A&ARv, 29, 3 [Google Scholar]
- Ohta, K., Aoki, K., Kawaguchi, T., & Kiuchi, G. 2007, ApJS, 169, 1 [NASA ADS] [CrossRef] [Google Scholar]
- Olguín-Iglesias, A., Kotilainen, J. K., León Tavares, J., Chavushyan, V., & Añorve, C. 2017, MNRAS, 467, 3712 [NASA ADS] [Google Scholar]
- Olguín-Iglesias, A., Kotilainen, J., & Chavushyan, V. 2020, MNRAS, 492, 1450 [Google Scholar]
- Orienti, M., & Prieto, M. A. 2010, MNRAS, 401, 2599 [NASA ADS] [CrossRef] [Google Scholar]
- Oshlack, A. Y. K. N., Webster, R. L., & Whiting, M. T. 2001, ApJ, 558, 578 [NASA ADS] [CrossRef] [Google Scholar]
- Osterbrock, D. E., & Pogge, R. W. 1985, ApJ, 297, 166 [Google Scholar]
- Padovani, P. 2017, Nat. Astron., 1, 0194 [Google Scholar]
- Panda, S., Czerny, B., Adhikari, T. P., et al. 2018, ApJ, 866, 115 [CrossRef] [Google Scholar]
- Panessa, F., Baldi, R. D., Laor, A., et al. 2019, Nat. Astron., 3, 387 [Google Scholar]
- Parker, M. L., Matzeu, G. A., Guainazzi, M., et al. 2018, MNRAS, 480, 2365 [NASA ADS] [CrossRef] [Google Scholar]
- Parker, M. L., Matzeu, G. A., Alston, W. N., et al. 2020, MNRAS, 498, L140 [NASA ADS] [CrossRef] [Google Scholar]
- Parra, R., Conway, J. E., Aalto, S., et al. 2010, ApJ, 720, 555 [CrossRef] [Google Scholar]
- Peng, Z.-X., Chen, Y.-M., Gu, Q.-S., & Zhang, K. 2014, Res. Astron. Astrophys., 14, 913 [Google Scholar]
- Peruzzi, T., Pasquato, M., Ciroi, S., et al. 2021, A&A, 652, A19 [NASA ADS] [CrossRef] [EDP Sciences] [Google Scholar]
- Peterson, B. M. 2011, PoS, NLSI, 032 [Google Scholar]
- Petrov, L. 2013, AJ, 146, 5 [NASA ADS] [CrossRef] [Google Scholar]
- Planck Collaboration VII. 2013, A&A, 550, A133 [NASA ADS] [CrossRef] [EDP Sciences] [Google Scholar]
- Popescu, C. C., Tuffs, R. J., Dopita, M. A., et al. 2011, A&A, 527, A109 [NASA ADS] [CrossRef] [EDP Sciences] [Google Scholar]
- Popović, L. Č., Smirnova, A. A., Kovačević, J., Moiseev, A. V., & Afanasiev, V. L. 2009, AJ, 137, 3548 [CrossRef] [Google Scholar]
- Pounds, K. A., & King, A. R. 2013, MNRAS, 433, 1369 [NASA ADS] [CrossRef] [Google Scholar]
- Pounds, K. A., Done, C., & Osborne, J. P. 1995, MNRAS, 277, L5 [NASA ADS] [Google Scholar]
- Proga, D. 2007, in The Central Engine of Active Galactic Nuclei, eds. L. C. Ho, & J. W. Wang, ASP Conf. Ser., 373, 267 [NASA ADS] [Google Scholar]
- Rakshit, S., Stalin, C. S., Hota, A., & Konar, C. 2018, ApJ, 869, 173 [CrossRef] [Google Scholar]
- Rakshit, S., Schramm, M., Stalin, C. S., et al. 2021, MNRAS, 504, L22 [NASA ADS] [CrossRef] [Google Scholar]
- Rau, U., & Cornwell, T. J. 2011, A&A, 532, A71 [NASA ADS] [CrossRef] [EDP Sciences] [Google Scholar]
- Rodríguez-Ardila, A., & Mazzalay, X. 2006, MNRAS, 367, L57 [CrossRef] [Google Scholar]
- Rodríguez-Ardila, A., & Viegas, S. M. 2003, MNRAS, 340, L33 [CrossRef] [Google Scholar]
- Rodríguez-Ardila, A., Contini, M., & Viegas, S. M. 2005, MNRAS, 357, 220 [CrossRef] [Google Scholar]
- Romano, P., Vercellone, S., Foschini, L., et al. 2018, MNRAS, 481, 5046 [NASA ADS] [CrossRef] [Google Scholar]
- Rosario, D. J., Burtscher, L., Davies, R., et al. 2013, ApJ, 778, 94 [NASA ADS] [CrossRef] [Google Scholar]
- Ruschel-Dutra, D., Rodríguez Espinosa, J. M., González Martín, O., Pastoriza, M., & Riffel, R. 2017, MNRAS, 466, 3353 [NASA ADS] [CrossRef] [Google Scholar]
- Saikia, P., Körding, E., Coppejans, D. L., et al. 2018, A&A, 616, A152 [NASA ADS] [CrossRef] [EDP Sciences] [Google Scholar]
- Sanfrutos, M., Longinotti, A. L., Krongold, Y., Guainazzi, M., & Panessa, F. 2018, ApJ, 868, 111 [CrossRef] [Google Scholar]
- Sani, E., Lutz, D., Risaliti, G., et al. 2010, MNRAS, 403, 1246 [Google Scholar]
- Sargsyan, L. A., & Weedman, D. W. 2009, ApJ, 701, 1398 [NASA ADS] [CrossRef] [Google Scholar]
- Sargsyan, L., Lebouteiller, V., Weedman, D., et al. 2012, ApJ, 755, 171 [Google Scholar]
- Sargsyan, L., Samsonyan, A., Lebouteiller, V., et al. 2014, ApJ, 790, 15 [Google Scholar]
- Scheuer, P. A. G., & Readhead, A. C. S. 1979, Nature, 277, 182 [NASA ADS] [CrossRef] [Google Scholar]
- Schmitt, H. R., Ulvestad, J. S., Antonucci, R. R. J., & Kinney, A. L. 2001a, ApJS, 132, 199 [NASA ADS] [CrossRef] [Google Scholar]
- Schmitt, H. R., Antonucci, R. R. J., Ulvestad, J. S., et al. 2001b, ApJ, 555, 663 [Google Scholar]
- Schmitt, H. R., Donley, J. L., Antonucci, R. R. J., Hutchings, J. B., & Kinney, A. L. 2003, ApJS, 148, 327 [NASA ADS] [CrossRef] [Google Scholar]
- Schönell, A. J., Riffel, R. A., Storchi-Bergmann, T., & Winge, C. 2014, MNRAS, 445, 414 [CrossRef] [Google Scholar]
- Seyfert, C. K. 1943, ApJ, 97, 28 [NASA ADS] [CrossRef] [Google Scholar]
- Shangguan, J., Ho, L. C., Bauer, F. E., Wang, R., & Treister, E. 2020, ApJ, 899, 112 [NASA ADS] [CrossRef] [Google Scholar]
- Shen, Y., & Ho, L. C. 2014, Nature, 513, 210 [NASA ADS] [CrossRef] [Google Scholar]
- Shi, Y., Ogle, P., Rieke, G. H., et al. 2007, ApJ, 669, 841 [NASA ADS] [CrossRef] [Google Scholar]
- Shirazi, M., & Brinchmann, J. 2012, MNRAS, 421, 1043 [NASA ADS] [CrossRef] [Google Scholar]
- Shuder, J. M., & Osterbrock, D. E. 1981, ApJ, 250, 55 [NASA ADS] [CrossRef] [Google Scholar]
- Silpa, S., Kharb, P., Ho, L. C., et al. 2020, MNRAS, 499, 5826 [NASA ADS] [CrossRef] [Google Scholar]
- Smethurst, R. J., Simmons, B. D., Lintott, C. J., & Shanahan, J. 2019, MNRAS, 489, 4016 [NASA ADS] [CrossRef] [Google Scholar]
- Snellen, I. A. G., Mack, K. H., Schilizzi, R. T., & Tschager, W. 2004, MNRAS, 348, 227 [NASA ADS] [CrossRef] [Google Scholar]
- Stern, J., & Laor, A. 2013, MNRAS, 431, 836 [NASA ADS] [CrossRef] [Google Scholar]
- Sulentic, J. W., Marziani, P., & Dultzin-Hacyan, D. 2000a, ARA&A, 38, 521 [Google Scholar]
- Sulentic, J. W., Zwitter, T., Marziani, P., & Dultzin-Hacyan, D. 2000b, ApJ, 536, L5 [Google Scholar]
- Tan, Q.-H., Gao, Y., Kohno, K., et al. 2019, ApJ, 887, 24 [NASA ADS] [CrossRef] [Google Scholar]
- Taniguchi, Y. 1999, ApJ, 524, 65 [CrossRef] [Google Scholar]
- Tarchi, A., Castangia, P., Columbano, A., Panessa, F., & Braatz, J. A. 2011, A&A, 532, A125 [NASA ADS] [CrossRef] [EDP Sciences] [Google Scholar]
- Teng, S. H., Veilleux, S., & Baker, A. J. 2013, ApJ, 765, 95 [NASA ADS] [CrossRef] [Google Scholar]
- Terrazas, B. A., Bell, E. F., Woo, J., & Henriques, B. M. B. 2017, ApJ, 844, 170 [NASA ADS] [CrossRef] [Google Scholar]
- Thean, A., Pedlar, A., Kukula, M. J., Baum, S. A., & O’Dea, C. P. 2000, MNRAS, 314, 573 [Google Scholar]
- Tombesi, F., Cappi, M., Reeves, J. N., et al. 2010, A&A, 521, A57 [NASA ADS] [CrossRef] [EDP Sciences] [Google Scholar]
- Ulvestad, J. S., & Wilson, A. S. 1984, ApJ, 285, 439 [Google Scholar]
- Ulvestad, J. S., Antonucci, R. R. J., & Goodrich, R. W. 1995, AJ, 109, 81 [NASA ADS] [CrossRef] [Google Scholar]
- Urrutia, T., Lacy, M., & Becker, R. H. 2008, ApJ, 674, 80 [Google Scholar]
- Wang, F., Du, P., Hu, C., et al. 2016, ApJ, 824, 149 [CrossRef] [Google Scholar]
- Whittle, M. 1992, ApJS, 79, 49 [Google Scholar]
- Wiegert, T., Irwin, J., Miskolczi, A., et al. 2015, AJ, 150, 81 [Google Scholar]
- Wright, E. L., Eisenhardt, P. R. M., Mainzer, A. K., et al. 2010, AJ, 140, 1868 [Google Scholar]
- Xie, Y., Ho, L. C., Li, A., & Shangguan, J. 2018, ApJ, 860, 154 [NASA ADS] [CrossRef] [Google Scholar]
- Yang, X., Yao, S., Yang, J., et al. 2020, ApJ, 904, 200 [NASA ADS] [CrossRef] [Google Scholar]
- Yao, S., & Komossa, S. 2021, MNRAS, 501, 1384 [Google Scholar]
- Young, J. E., Eracleous, M., Shemmer, O., et al. 2014, MNRAS, 438, 217 [NASA ADS] [CrossRef] [Google Scholar]
- Yuan, W., Zhou, H. Y., Komossa, S., et al. 2008, ApJ, 685, 801 [NASA ADS] [CrossRef] [Google Scholar]
- Yuan, W., Liu, B. F., Zhou, H., & Wang, T. G. 2010, ApJ, 723, 508 [NASA ADS] [CrossRef] [Google Scholar]
- Zhang, K., Wang, T.-G., Yan, L., & Dong, X.-B. 2013, ApJ, 768, 22 [NASA ADS] [CrossRef] [Google Scholar]
- Zhang, P., Zhang, P.-F., Yan, J.-Z., Fan, Y.-Z., & Liu, Q.-Z. 2017a, ApJ, 849, 9 [CrossRef] [Google Scholar]
- Zhang, S., Zhou, H., Shi, X., et al. 2017b, ApJ, 845, 126 [NASA ADS] [CrossRef] [Google Scholar]
- Zheng, X. Z., Xia, X. Y., Mao, S., Wu, H., & Deng, Z. G. 2002, AJ, 124, 18 [NASA ADS] [CrossRef] [Google Scholar]
- Zhuang, M.-Y., Ho, L. C., & Shangguan, J. 2018, ApJ, 862, 118 [NASA ADS] [CrossRef] [Google Scholar]
Appendix A: Tables
Basic data of the sample.
Basic data of the sample.
Measurements from the normal radio map and the 90 and 60kλ tapered maps, and associated rms, for our sample.
Weighted total spectral indices, core spectral indices, spectral indices of regions of interest for our sample, and the non-simultaneous 1.4 - 5.2 GHz spectral index.
Parameters related to the star formation estimation for our sample.
Summary of the radio and mid-infrared results.
Appendix B: α, Δα, and tapered maps
 |
Fig. B.1. Spectral index map. The rms = 14μJy beam−1, the contour levels are at -3, 3 × 2n, n∈ [0, 7], and the beam size is 0.23 × 0.17 kpc. |
 |
Fig. B.2. Spectral index error map. The rms, the contour levels, and the beam size are the same as in Fig. B.1. |
 |
Fig. B.3. Tapered map with uvtaper = 90kλ. The rms = 25μJy beam−1, the contour levels are at -3, 3 × 2n, n∈ [0, 7], and the beam size is 0.69 × 0.63 kpc. |
 |
Fig. B.4. Tapered map with uvtaper = 60kλ. The rms = 33μJy beam−1, the contour levels are at -3, 3 × 2n, n∈ [0, 6], and the beam size is 1.01 × 0.94 kpc. |
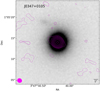 |
Fig. B.5. Pan-STARRS i band image of the host galaxy overlaid with the 90kλ tapered map. Radio map properties are the same as in Fig. B.3. |
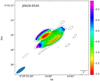 |
Fig. B.6. Spectral index map. The rms = 14μJy beam−1, the contour levels are at -3, 3 × 2n, n∈ [0, 8], and the beam size is 3.09 × 0.93 kpc. |
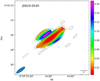 |
Fig. B.7. Spectral index error map. The rms, the contour levels, and the beam size are the same as in Fig. B.6. |
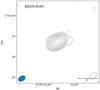 |
Fig. B.8. Tapered map with uvtaper = 90kλ. The rms = 22μJy beam−1, the contour levels are at -3, 3 × 2n, n∈ [0, 7], and the beam size is 4.15 × 2.73 kpc. |
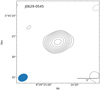 |
Fig. B.9. Tapered map with uvtaper = 60kλ. The rms = 26μJy beam−1, the contour levels are at -3, 3 × 2n, n∈ [0, 7], and the beam size is 5.12 × 3.91 kpc. |
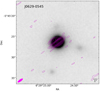 |
Fig. B.10. Pan-STARRS i band image of the host galaxy overlaid with the normal map. Radio map properties are the same as in Fig. B.6. |
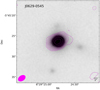 |
Fig. B.11. Pan-STARRS i band image of the host galaxy overlaid with the 90kλ tapered map. Radio map properties are the same as in Fig. B.8. |
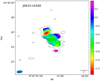 |
Fig. B.12. Spectral index map. The rms = 10 μJy beam−1, the contour levels are at -3, 3 × 2n, n∈ [0, 5], and the beam size is 0.22 × 0.11 kpc. |
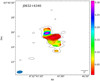 |
Fig. B.13. Spectral index error map. The rms, the contour levels, and the beam size are the same as in Fig. B.12. |
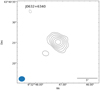 |
Fig. B.14. Tapered map with uvtaper = 90kλ. The rms = 14μJy beam−1, the contour levels are at -3, 3 × 2n, n∈ [0, 5], and the beam size is 0.42 × 0.34 kpc. |
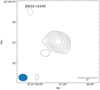 |
Fig. B.15. Tapered map with uvtaper = 60kλ. The rms = 16μJy beam−1, the contour levels are at -3, 3 × 2n, n∈ [0, 5], the beam size is 0.59 × 0.48 kpc. |
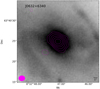 |
Fig. B.16. Pan-STARRS i band image of the host galaxy overlaid with the 90kλ tapered map. Radio map properties are the same as in Fig. B.14. |
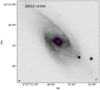 |
Fig. B.17. Pan-STARRS i band image of the host galaxy overlaid with the 90kλ tapered map. Radio map properties are the same as in Fig. B.14. |
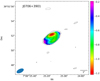 |
Fig. B.18. Spectral index map. The rms = 13μJy beam−1, the contour levels are at -3, 3 × 2n, n∈ [0, 5], and beam size is 1.68 × 0.85 kpc. |
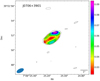 |
Fig. B.19. Spectral index error map. The rms, the contour levels, and the beam size are the same as in Fig. B.18. |
 |
Fig. B.20. Tapered map with uvtaper = 90kλ. The rms = 17μJy beam−1, the contour levels are at -3, 3 × 2n, n∈ [0, 5], and the beam size is 2.66 × 2.27 kpc. |
 |
Fig. B.21. Tapered map with uvtaper = 60kλ. The rms = 21μJy beam−1, the contour levels are at -3, 3 × 2n, n∈ [0, 5], and the beam size is 3.53 × 3.21 kpc. |
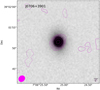 |
Fig. B.22. Pan-STARRS i band image of the host galaxy overlaid with the 90kλ tapered map. Radio map properties are the same as in Fig. B.20. |
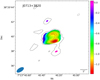 |
Fig. B.23. Spectral index map. The rms = 13μJy beam−1, the contour levels are at -3, 3 × 2n, n∈ [0, 5], and the beam size is 2.45 × 1.19 kpc. |
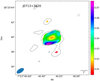 |
Fig. B.24. Spectral index error map. The rms, the contour levels, and the beam size are the same as in Fig. B.23. |
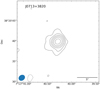 |
Fig. B.25. Tapered map with uvtaper = 90kλ. The rms = 19μJy beam−1, the contour levels are at -3, 3 × 2n, n∈ [0, 5], and the beam size is 3.65 × 3.01 kpc. |
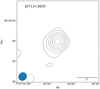 |
Fig. B.26. Tapered map with uvtaper = 60kλ. The rms = 23μJy beam−1, the contour levels are at -3, 3 × 2n, n∈ [0, 5], and the beam size is 4.82 × 4.33 kpc. |
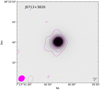 |
Fig. B.27. Pan-STARRS i band image of the host galaxy overlaid with the 90kλ tapered map. Radio map properties are the same as in Fig. B.25. |
 |
Fig. B.28. Spectral index map. The rms = 10μJy beam−1, the contour levels are at -3, 3 × 2n, n∈ [0, 3], and the beam size is 1.55 × 1.42 kpc. |
 |
Fig. B.29. Spectral index error map. The rms, the contour levels, and the beam size are the same as in Fig. B.28. |
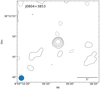 |
Fig. B.30. Tapered map with uvtaper = 90kλ. The rms = 18μJy beam−1, the contour levels are at -3, 3 × 2n, n∈ [0, 3], and the beam size is 4.73 × 4.59 kpc. |
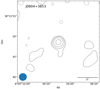 |
Fig. B.31. Tapered map with uvtaper = 60kλ. The rms = 23μJy beam−1, the contour levels are at -3, 3 × 2n, n∈ [0, 3], and the beam size is 6.66 × 6.46 kpc. |
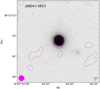 |
Fig. B.32. Pan-STARRS i band image of the host galaxy overlaid with the 90kλ tapered map. Radio map properties are the same as in Fig. B.30. |
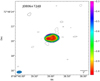 |
Fig. B.33. Spectral index map. The rms = 10μJy beam−1, the contour levels are at -3, 3 × 2n, n∈ [0, 8], and the beam size is 1.30 × 0.72 kpc. |
 |
Fig. B.34. Spectral index error map. The rms, the contour levels, and the beam size are the same as in Fig. B.33. |
 |
Fig. B.35. Tapered map with uvtaper = 90kλ. The rms = 11μJy beam−1, the contour levels are at -3, 3 × 2n, n∈ [0, 8], and the beam size is 2.79 × 2.41 kpc. |
 |
Fig. B.36. Tapered map with uvtaper = 60kλ. The rms = 12μJy beam−1, the contour levels are at -3, 3 × 2n, n∈ [0, 8], and the beam size is 4.08 × 3.37 kpc. |
 |
Fig. B.37. Pan-STARRS i band image of the host galaxy overlaid with the 90kλ tapered map. Radio map properties are the same as in Fig. B.35. |
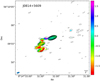 |
Fig. B.38. Spectral index map. The rms = 10μJy beam−1, the contour levels are at -3, 3 × 2n, n∈ [0, 9], and the beam size is 5.12 × 2.28 kpc. |
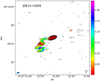 |
Fig. B.39. Spectral index error map. The rms, the contour levels, and the beam size are the same as in Fig. B.38. |
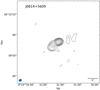 |
Fig. B.40. Tapered map with uvtaper = 90kλ. The rms = 16μJy beam−1, the contour levels are at -3, 3 × 2n, n∈ [0, 9], and the beam size is 10.05 × 7.77 kpc. |
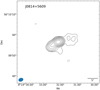 |
Fig. B.41. Tapered map with uvtaper = 60kλ. The rms = 19μJy beam−1, the contour levels are at -3, 3 × 2n, n∈ [0, 8], and the beam size is 14.74 × 10.98 kpc. |
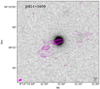 |
Fig. B.42. Pan-STARRS i band image of the host galaxy overlaid with the normal map. Radio map properties are the same as in Fig. B.38. |
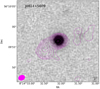 |
Fig. B.43. Pan-STARRS i band image of the host galaxy overlaid with the 90kλ tapered map. Radio map properties are the same as in Fig. B.40. |
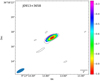 |
Fig. B.44. Spectral index map. The rms = 11μJy beam−1, the contour levels are at -3, 3 × 2n, n∈ [0, 3], and the beam size is 2.31 × 0.80 kpc. |
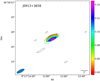 |
Fig. B.45. Spectral index error map. The rms, the contour levels, and the beam size are the same as in Fig. B.44. |
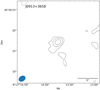 |
Fig. B.46. Tapered map with uvtaper = 90kλ. The rms = 17μJy beam−1, the contour levels are at -3, 3 × 2n, n∈ [0, 2], and the beam size is 3.47 × 2.58 kpc. |
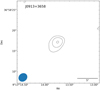 |
Fig. B.47. Tapered map with uvtaper = 60kλ. The rms = 26μJy beam−1, the contour levels are at -3, 3 × 2n, n∈ [0, 2], and the beam size is 4.41 × 3.82 kpc. |
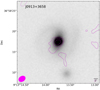 |
Fig. B.48. Pan-STARRS i band image of the host galaxy overlaid with the 90kλ tapered map. Radio map properties are the same as in Fig. B.46. |
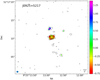 |
Fig. B.49. Spectral index map. The rms = 12μJy beam−1, the contour levels are at -3, 3 × 2n, n∈ [0, 5], and the beam size is 0.38 × 0.33 kpc. |
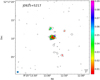 |
Fig. B.50. Spectral index error map. The rms, the contour levels, and the beam size are the same as in Fig. B.49. |
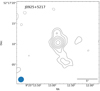 |
Fig. B.51. Tapered map with uvtaper = 90kλ. The rms = 16μJy beam−1, the contour levels are at -3, 3 × 2n, n∈ [0, 5], and the beam size is 1.00 × 0.95 kpc. |
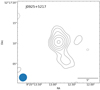 |
Fig. B.52. Tapered map with uvtaper = 60kλ. The rms = 21μJy beam−1, the contour levels are at -3, 3 × 2n, n∈ [0, 5], and the beam size is 1.39 × 1.35 kpc. |
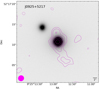 |
Fig. B.53. Pan-STARRS i band image of the host galaxy overlaid with the 90kλ tapered map. Radio map properties are the same as in Fig. B.51. |
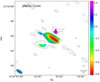 |
Fig. B.54. Spectral index map. The rms = 11μJy beam−1, the contour levels are at -3, 3 × 2n, n∈ [0, 6], and the beam size is 0.55 × 0.24 kpc. |
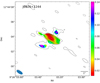 |
Fig. B.55. Spectral index error map. The rms, the contour levels, and the beam size are the same as in Fig. B.54. |
 |
Fig. B.56. Tapered map with uvtaper = 90kλ. The rms = 17μJy beam−1, the contour levels are at -3, 3 × 2n, n∈ [0, 5], and the beam size is 0.99 × 0.72 kpc. |
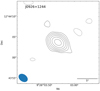 |
Fig. B.57. Tapered map with uvtaper = 60kλ. The rms = 22μJy beam−1, the contour levels are at -3, 3 × 2n, n∈ [0, 5], and the beam size is 1.42 × 1.01 kpc. |
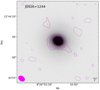 |
Fig. B.58. Pan-STARRS i band image of the host galaxy overlaid with the 90kλ tapered map. Radio map properties are the same as in Fig. B.56. |
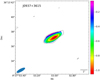 |
Fig. B.59. Spectral index map. The rms = 12μJy beam−1, the contour levels are at -3, 3 × 2n, n∈ [0, 4], and the beam size is 3.92 × 1.24 kpc. |
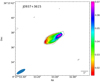 |
Fig. B.60. Spectral index error map. The rms, the contour levels, and the beam size are the same as in Fig. B.59. |
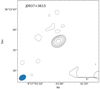 |
Fig. B.61. Tapered map with uvtaper = 90kλ. The rms = 15μJy beam−1, the contour levels are at -3, 3 × 2n, n∈ [0, 4], and the beam size is 5.68 × 4.10 kpc. |
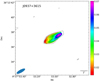 |
Fig. B.62. Tapered map with uvtaper = 60kλ. The rms = 19μJy beam−1, the contour levels are at -3, 3 × 2n, n∈ [0, 4], and the beam size is 6.98 × 6.07 kpc. |
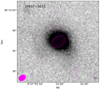 |
Fig. B.63. Pan-STARRS i band image of the host galaxy overlaid with the 90kλ tapered map. Radio map properties are the same as in Fig. B.61. |
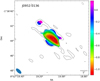 |
Fig. B.64. Spectral index map. The rms = 10μJy beam−1, the contour levels are at -3, 3 × 2n, n∈ [0, 9], and the beam size is 0.37 × 0.17 kpc. |
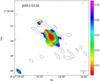 |
Fig. B.65. Spectral index error map. The rms, the contour levels, and the beam size are the same as in Fig. B.64. |
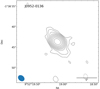 |
Fig. B.66. Tapered map with uvtaper = 90kλ. The rms = 12μJy beam−1, the contour levels are at -3, 3 × 2n, n∈ [0, 8], and the beam size is 0.69 × 0.53 kpc. |
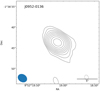 |
Fig. B.67. Tapered map with uvtaper = 60kλ. The rms = 14μJy beam−1, the contour levels are at -3, 3 × 2n, n∈ [0, 8], and the beam size is 0.96 × 0.76 kpc. |
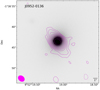 |
Fig. B.68. Pan-STARRS i band image of the host galaxy overlaid with the 90kλ tapered map. Radio map properties are the same as in Fig. B.66. |
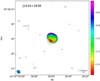 |
Fig. B.69. Spectral index map. The rms = 10μJy, the contour levels are at -3, 3 × 2n, n∈ [0, 7], and the beam size is 0.46 × 0.36 kpc. |
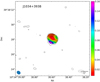 |
Fig. B.70. Spectral index error map. The rms, the contour levels, and the beam size are the same as in Fig. B.69. |
 |
Fig. B.71. Tapered map with uvtaper = 90kλ. The rms = 12μJy beam−1, the contour levels are at -3, 3 × 2n, n∈ [0, 7], and the beam size is 1.17 × 1.08 kpc. |
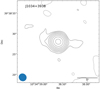 |
Fig. B.72. Tapered map with uvtaper = 60kλ. The rms = 14μJy beam−1, the contour levels are at -3, 3 × 2n, n∈ [0, 7], and the beam size is 1.63 × 1.53 kpc. |
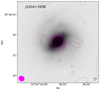 |
Fig. B.73. Pan-STARRS i band image of the host galaxy overlaid with the 90kλ tapered map. Radio map properties are the same as in Fig. B.71. |
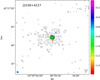 |
Fig. B.74. Spectral index map. The rms = 10μJy beam−1, the contour levels are at -3, 3 × 2n, n∈ [0, 6], and the beam size is 1.92 × 1.60 kpc. |
 |
Fig. B.75. Spectral index error map. The rms, the contour levels, and the beam size are the same as in Fig. B.74. |
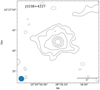 |
Fig. B.76. Tapered map with uvtaper = 90kλ. The rms = 13μJy beam−1, the contour levels are at -3, 3 × 2n, n∈ [0, 5], and the beam size is 4.97 × 4.65 kpc. |
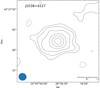 |
Fig. B.77. Tapered map with uvtaper = 60kλ. The rms = 17μJy beam−1, the contour levels are at -3, 3 × 2n, n∈ [0, 5], and the beam size is 6.96 × 6.57 kpc. |
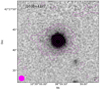 |
Fig. B.78. Pan-STARRS i band image of the host galaxy overlaid with the 90kλ tapered map. Radio map properties are the same as in Fig. B.76. |
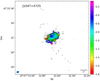 |
Fig. B.79. Spectral index map. The rms = 35μJy beam−1, the contour levels are at -3, 3 × 2n, n∈ [0, 10], and the beam size is 2.78 × 1.95 kpc. |
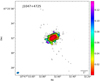 |
Fig. B.80. Spectral index error map. The rms, the contour levels, and the beam size are the same as in Fig. B.79. |
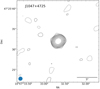 |
Fig. B.81. Tapered map with uvtaper = 90kλ. The rms = 50μJy beam−1, the contour levels are at -3, 3 × 2n, n∈ [0, 11], and the beam size is 7.66 × 7.28 kpc. |
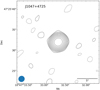 |
Fig. B.82. Tapered map with uvtaper = 60kλ. The rms = 80μJy beam−1, the contour levels are at -3, 3 × 2n, n∈ [0, 10], and the beam size is 11.56 × 11.03 kpc. |
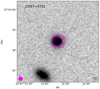 |
Fig. B.83. Pan-STARRS i band image of the host galaxy overlaid with the 90kλ tapered map. Radio map properties are the same as in Fig. B.81. |
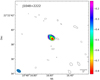 |
Fig. B.84. Spectral index map. The rms = 8μJy beam−1, the contour levels are at -3, 3 × 2n, n∈ [0, 3], and the beam size is 3.14 × 2.00 kpc. |
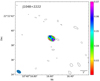 |
Fig. B.85. Spectral index error map. The rms, the contour levels, and the beam size are the same as in Fig. B.84. |
 |
Fig. B.86. Tapered map with uvtaper = 90kλ. The rms = 9μJy beam−1, the contour levels are at -3, 3 × 2n, n∈ [0, 3], and the beam size is 7.27 × 6.04 kpc. |
 |
Fig. B.87. Tapered map with uvtaper = 60kλ. The rms = 10μJy beam−1, the contour levels are at -3, 3 × 2n, n∈ [0, 3], and the beam size is 10.12 × 8.55 kpc. |
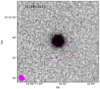 |
Fig. B.88. Pan-STARRS i band image of the host galaxy overlaid with the 90kλ tapered map. Radio map properties are the same as in Fig. B.86. |
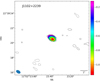 |
Fig. B.89. Spectral index map. The rms = 13μJy beam−1, the contour levels are at -3, 3 × 2n, n∈ [0, 4], and the beam size is 3.76 × 2.37 kpc. |
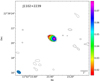 |
Fig. B.90. Spectral index error map. The rms, the contour levels, and the beam size are the same as in Fig. B.89. |
 |
Fig. B.91. Tapered map with uvtaper = 90kλ. The rms = 36μJy beam−1, the contour levels are at -3, 3 × 2n, n∈ [0, 2], and the beam size is 8.84 × 7.40 kpc. |
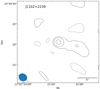 |
Fig. B.92. Tapered map with uvtaper = 60kλ. The rms = 45μJy beam−1, the contour levels are at -3, 3 × 2n, n∈ [0, 2], and the beam size is 12.43 × 10.58 kpc. |
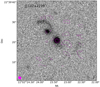 |
Fig. B.93. Pan-STARRS i band image of the host galaxy overlaid with the 90kλ tapered map. Radio map properties are the same as in Fig. B.91. |
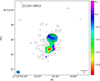 |
Fig. B.94. Spectral index map. The rms = 10μJy beam−1, the contour levels are at -3, 3 × 2n, n∈ [0, 8], and the beam size is 3.42 × 2.80 kpc. |
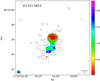 |
Fig. B.95. Spectral index error map. The rms, the contour levels, and the beam size are the same as in Fig. B.94. |
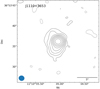 |
Fig. B.96. Tapered map with uvtaper = 90kλ. The rms = 11μJy beam−1, the contour levels are at -3, 3 × 2n, n∈ [0, 7], and the beam size is 9.70 × 8.81 kpc. |
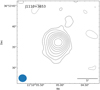 |
Fig. B.97. Tapered map with uvtaper = 60kλ. The rms = 12μJy beam−1, the contour levels are at -3, 3 × 2n, n∈ [0, 7], and the beam size is 13.66 × 12.50 kpc. |
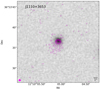 |
Fig. B.98. Pan-STARRS i band image of the host galaxy overlaid with the normal map. Radio map properties are the same as in Fig. B.94. |
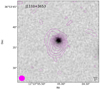 |
Fig. B.99. Pan-STARRS i band image of the host galaxy overlaid with the 90kλ tapered map. Radio map properties are the same as in Fig. B.96. |
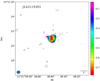 |
Fig. B.100. Spectral index map. The rms = 11μJy beam−1, the contour levels are at -3, 3 × 2n, n∈ [0, 4], and the beam size is 0.97 × 0.85 kpc. |
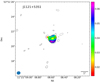 |
Fig. B.101. Spectral index error map. The rms, the contour levels, and the beam size are the same as in Fig. B.100. |
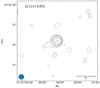 |
Fig. B.102. Tapered map with uvtaper = 90kλ. The rms = 12μJy beam−1, the contour levels are at -3, 3 × 2n, n∈ [0, 5], and the beam size is 2.63 × 2.50 kpc. |
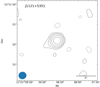 |
Fig. B.103. Tapered map with uvtaper = 60kλ. The rms = 14μJy beam−1, the contour levels are at -3, 3 × 2n, n∈ [0, 4], and the beam size is 3.71 × 3.50 kpc. |
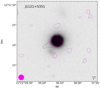 |
Fig. B.104. Pan-STARRS i band image of the host galaxy overlaid with the 90kλ tapered map. Radio map properties are the same as in Fig. B.102. |
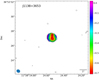 |
Fig. B.105. Spectral index map. The rms = 10μJy beam−1, the contour levels are at -3, 3 × 2n, n∈ [0, 7], and the beam size is 2.60 × 2.20 kpc. |
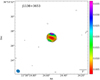 |
Fig. B.106. Spectral index error map. The rms, the contour levels, and the beam size are the same as in Fig. B.105. |
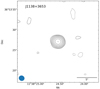 |
Fig. B.107. Tapered map with uvtaper = 90kλ. The rms = 12μJy beam−1, the contour levels are at -3, 3 × 2n, n∈ [0, 7], and the beam size is 7.04 × 6.49 kpc. |
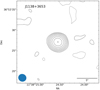 |
Fig. B.108. Tapered map with uvtaper = 60kλ. The rms = 12μJy beam−1, the contour levels are at -3, 3 × 2n, n∈ [0, 7], and the beam size is 9.94 × 9.19 kpc. |
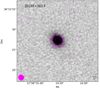 |
Fig. B.109. Pan-STARRS i band image of the host galaxy overlaid with the 90kλ tapered map. Radio map properties are the same as in Fig. B.107. |
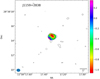 |
Fig. B.110. Spectral index map. The rms = 10μJy beam−1, the contour levels are at -3, 3 × 2n, n∈ [0, 4], and the beam size is 1.78 × 1.44 kpc. |
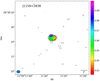 |
Fig. B.111. Spectral index error map. The rms, the contour levels, and the beam size are the same as in Fig. B.110. |
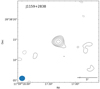 |
Fig. B.112. Tapered map with uvtaper = 90kλ. The rms = 13μJy beam−1, the contour levels are at -3, 3 × 2n, n∈ [0, 4], and the beam size is 5.00 × 4.35 kpc. |
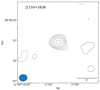 |
Fig. B.113. Tapered map with uvtaper = 60kλ. The rms = 14μJy beam−1, the contour levels are at -3, 3 × 2n, n∈ [0, 4], and the beam size is 7.09 × 6.13 kpc. |
 |
Fig. B.114. Pan-STARRS i band image of the host galaxy overlaid with the 90kλ tapered map. Radio map properties are the same as in Fig. B.112. |
 |
Fig. B.115. Spectral index map. The rms = 12μJy beam−1, the contour levels are at -3, 3 × 2n, n∈ [0, 4], and the beam size is 0.02 × 0.02 kpc. |
 |
Fig. B.116. Spectral index error map. The rms, the contour levels, and the beam size are the same as in Fig. B.115. |
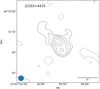 |
Fig. B.117. Tapered map with uvtaper = 90kλ. The rms = 29μJy beam−1, the contour levels are at -3, 3 × 2n, n∈ [0, 4], and the beam size is 0.06 × 0.05 kpc. |
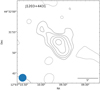 |
Fig. B.118. Tapered map with uvtaper = 60kλ. The rms = 38μJy beam−1, the contour levels are at -3, 3 × 2n, n∈ [0, 4], and the beam size is 0.08 × 0.08 kpc. |
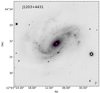 |
Fig. B.119. Pan-STARRS i band image of the host galaxy overlaid with the 90kλ tapered map. Radio map properties are the same as in Fig. B.117. |
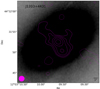 |
Fig. B.120. Pan-STARRS i band image of the host galaxy overlaid with the 90kλ tapered map. Radio map properties are the same as in Fig. B.117. |
 |
Fig. B.121. Spectral index map. The rms = 13μJy beam−1, the contour levels are at -3, 3 × 2n, n∈ [0, 3], and the beam size is 0.78 × 0.76 kpc. |
 |
Fig. B.122. Spectral index error map. The rms, the contour levels, and the beam size are the same as in Fig. B.121. |
 |
Fig. B.123. Tapered map with uvtaper = 90kλ. The rms = 14μJy beam−1, the contour levels are at -3, 3 × 2n, n∈ [0, 3], and the beam size is 2.65 × 2.58 kpc. |
 |
Fig. B.124. Tapered map with uvtaper = 60kλ. The rms = 15μJy beam−1, the contour levels are at -3, 3 × 2n, n∈ [0, 3], and the beam size is 3.97 × 3.87 kpc. |
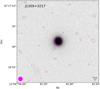 |
Fig. B.125. Pan-STARRS i band image of the host galaxy overlaid with the 90kλ tapered map. Radio map properties are the same as in Fig. B.123. |
 |
Fig. B.126. Spectral index map. The rms = 10μJy beam−1, the contour levels are at -3, 3 × 2n, n∈ [0, 4], and the beam size is 1.20 × 1.07 kpc. |
 |
Fig. B.127. Spectral index error map. The rms, the contour levels, and the beam size are the same as in Fig. B.126. |
 |
Fig. B.128. Tapered map with uvtaper = 90kλ. The rms = 12μJy beam−1, the contour levels are at -3, 3 × 2n, n∈ [0, 4], and the beam size is 3.56 × 3.48 kpc. |
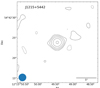 |
Fig. B.129. Tapered map with uvtaper = 60kλ. The rms = 13μJy beam−1, the contour levels are at -3, 3 × 2n, n∈ [0, 4], and the beam size is 4.99 × 4.91 kpc. |
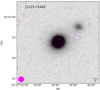 |
Fig. B.130. Pan-STARRS i band image of the host galaxy overlaid with the 90kλ tapered map. Radio map properties are the same as in Fig. B.128. |
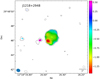 |
Fig. B.131. Spectral index map. The rms = 9μJy beam−1, the contour levels are at -3, 3 × 2n, n∈ [0, 8], and the beam size is 0.15 × 0.12 kpc. |
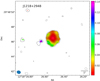 |
Fig. B.132. Spectral index error map. The rms, the contour levels, and the beam size are the same as in Fig. B.131. |
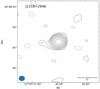 |
Fig. B.133. Tapered map with uvtaper = 90kλ. The rms = 10μJy beam−1, the contour levels are at -3, 3 × 2n, n∈ [0, 8], and the beam size is 0.39 × 0.34 kpc. |
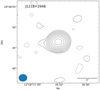 |
Fig. B.134. Tapered map with uvtaper = 60kλ. The rms = 12μJy beam−1, the contour levels are at -3, 3 × 2n, n∈ [0, 8], and the beam size is 0.56 × 0.48 kpc. |
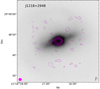 |
Fig. B.135. Pan-STARRS i band image of the host galaxy overlaid with the 90kλ tapered map. Radio map properties are the same as in Fig. B.133. |
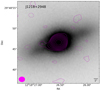 |
Fig. B.136. Pan-STARRS i band image of the host galaxy overlaid with the 90kλ tapered map. Radio map properties are the same as in Fig. B.133. |
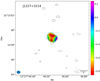 |
Fig. B.137. Spectral index map. The rms = 11μJy beam−1, the contour levels are at -3, 3 × 2n, n∈ [0, 6], and the beam size is 1.23 × 1.01 kpc. |
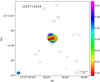 |
Fig. B.138. Spectral index error map. The rms, the contour levels, and the beam size are the same as in Fig. B.137. |
 |
Fig. B.139. Tapered map with uvtaper = 90kλ. The rms = 17μJy beam−1, the contour levels are at -3, 3 × 2n, n∈ [0, 5], and the beam size is 3.54 × 3.06 kpc. |
 |
Fig. B.140. Tapered map with uvtaper = 60kλ. The rms = 23μJy beam−1, the contour levels are at -3, 3 × 2n, n∈ [0, 5], and the beam size is 5.03 × 4.31 kpc. |
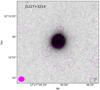 |
Fig. B.141. Pan-STARRS i band image of the host galaxy overlaid with the 90kλ tapered map. Radio map properties are the same as in Fig. B.139. |
 |
Fig. B.142. Spectral index map. The rms = 12μJy beam−1, the contour levels are at -3, 3 × 2n, n∈ [0, 5], and the beam size is 0.43 × 0.33 kpc. |
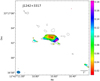 |
Fig. B.143. Spectral index error map. The rms, the contour levels, and the beam size are the same as in Fig. B.142. |
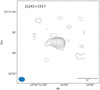 |
Fig. B.144. Tapered map with uvtaper = 90kλ. The rms = 16μJy beam−1, the contour levels are at -3, 3 × 2n, n∈ [0, 5], and the beam size is 1.38 × 1.01 kpc. |
 |
Fig. B.145. Tapered map with uvtaper = 60kλ. The rms = 21μJy beam−1, the contour levels are at -3, 3 × 2n, n∈ [0, 5], and the beam size is 2.04 × 1.41 kpc. |
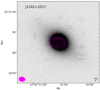 |
Fig. B.146. Pan-STARRS i band image of the host galaxy overlaid with the 90kλ tapered map. Radio map properties are the same as in Fig. B.144. |
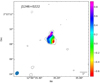 |
Fig. B.147. Spectral index map. The rms = 10μJy beam−1, the contour levels are at -3, 3 × 2n, n∈ [0, 3], and the beam size is 0.53 × 0.42 kpc. |
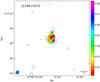 |
Fig. B.148. Spectral index error map. The rms, the contour levels, and the beam size are the same as in Fig. B.147. |
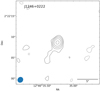 |
Fig. B.149. Tapered map with uvtaper = 90kλ. The rms = 11μJy beam−1, the contour levels are at -3, 3 × 2n, n∈ [0, 4], and the beam size is 1.35 × 1.22 kpc. |
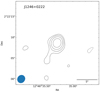 |
Fig. B.150. Tapered map with uvtaper = 60kλ. The rms = 15μJy beam−1, the contour levels are at -3, 3 × 2n, n∈ [0, 3], and the beam size is 1.91 × 1.72 kpc. |
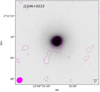 |
Fig. B.151. Pan-STARRS i band image of the host galaxy overlaid with the 90kλ tapered map. Radio map properties are the same as in Fig. B.149. |
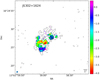 |
Fig. B.152. Spectral index map. The rms = 12μJy beam−1, the contour levels are at -3, 3 × 2n, n∈ [0, 6], the beam size is 0.58 × 0.50 kpc. Non-common uv range. |
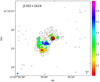 |
Fig. B.153. Spectral index error map. The rms, the contour levels, and the beam size are the same as in Fig. B.152. |
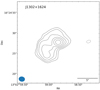 |
Fig. B.154. Tapered map with uvtaper = 90kλ. The rms = 28μJy beam−1, the contour levels are at -3, 3 × 2n, n∈ [0, 5], and the beam size is 1.94 × 1.59 kpc. |
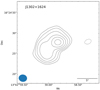 |
Fig. B.155. Tapered map with uvtaper = 60kλ. The rms = 35μJy beam−1, the contour levels are at -3, 3 × 2n, n∈ [0, 5], and the beam size is 2.66 × 2.27 kpc. |
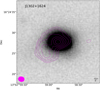 |
Fig. B.156. Pan-STARRS i band image of the host galaxy overlaid with the 90kλ tapered map. Radio map properties are the same as in Fig. B.154. |
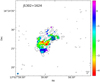 |
Fig. B.157. Spectral index map. The rms = 12μJy beam−1, the contour levels are at -3, 3 × 2n, n∈ [0, 6], and the beam size is 0.60 × 0.54 kpc. Common uv range. |
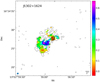 |
Fig. B.158. Spectral index error map. The rms, the contour levels, and the beam size are the same as in Fig. B.157. |
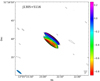 |
Fig. B.159. Spectral index map. The rms = 14μJy beam−1, the contour levels are at -3, 3 × 2n, n∈ [0, 9], and the beam size is 12.70 × 3.21 kpc. |
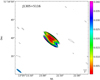 |
Fig. B.160. Spectral index error map. The rms, the contour levels, and the beam size are the same as in Fig. B.159. |
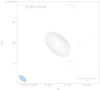 |
Fig. B.161. Tapered map with uvtaper = 90kλ. The rms = 16μJy beam−1, the contour levels are at -3, 3 × 2n, n∈ [0, 9], and the beam size is 17.03 × 8.66 kpc. |
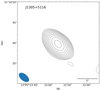 |
Fig. B.162. Tapered map with uvtaper = 60kλ. The rms = 20μJy beam−1, the contour levels are at -3, 3 × 2n, n∈ [0, 9], and the beam size is 22.18 × 12.10 kpc. |
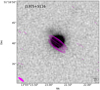 |
Fig. B.163. Pan-STARRS i band image of the host galaxy overlaid with the normal radio map. Radio map properties are the same as in Fig. B.159. |
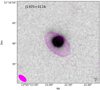 |
Fig. B.164. Pan-STARRS i band image of the host galaxy overlaid with the 90kλ tapered map. Radio map properties are the same as in Fig. B.161. |
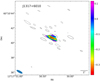 |
Fig. B.165. Spectral index map. The rms = 16μJy beam−1, the contour levels are at -3, 3 × 2n, n∈ [0, 3], and the beam size is 2.20 × 0.73 kpc. |
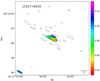 |
Fig. B.166. Spectral index error map. The rms, the contour levels, and the beam size are the same as in Fig. B.165. |
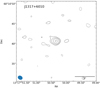 |
Fig. B.167. Tapered map with uvtaper = 90kλ. The rms = 24μJy beam−1, the contour levels are at -3, 3 × 2n, n∈ [0, 3], and the beam size is 2.98 × 2.37 kpc. |
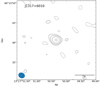 |
Fig. B.168. Tapered map with uvtaper = 60kλ. The rms = 29μJy beam−1, the contour levels are at -3, 3 × 2n, n∈ [0, 3], and the beam size is 4.09 × 3.39 kpc. |
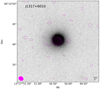 |
Fig. B.169. Pan-STARRS i band image of the host galaxy overlaid with the 90kλ tapered map. Radio map properties are the same as in Fig. B.167. |
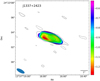 |
Fig. B.170. Spectral index map. The rms = 13μJy beam−1, the contour levels are at -3, 3 × 2n, n∈ [0, 7], and the beam size is 2.37 × 0.91 kpc. |
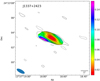 |
Fig. B.171. Spectral index error map. The rms, the contour levels, and the beam size are the same as in Fig. B.170. |
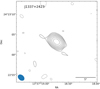 |
Fig. B.172. Tapered map with uvtaper = 90kλ. The rms = 14μJy beam−1, the contour levels are at -3, 3 × 2n, n∈ [0, 7], and the beam size is 3.59 × 2.59 kpc. |
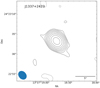 |
Fig. B.173. Tapered map with uvtaper = 60kλ. The rms = 16μJy beam−1, the contour levels are at -3, 3 × 2n, n∈ [0, 7], and the beam size is 4.70 × 3.69 kpc. |
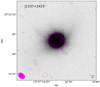 |
Fig. B.174. Pan-STARRS i band image of the host galaxy overlaid with the 90kλ tapered map. Radio map properties are the same as in Fig. B.172. |
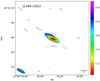 |
Fig. B.175. Spectral index map. The rms = 12μJy beam−1, the contour levels are at -3, 3 × 2n, n∈ [0, 3], and the beam size is 10.26 × 3.29 kpc. |
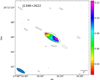 |
Fig. B.176. Spectral index error map. The rms, the contour levels, and the beam size are the same as in Fig. B.175. |
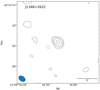 |
Fig. B.177. Tapered map with uvtaper = 90kλ. The rms = 14μJy beam−1, the contour levels are at -3, 3 × 2n, n∈ [0, 3], and the beam size is 14.72 × 10.18 kpc. |
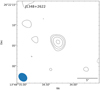 |
Fig. B.178. Tapered map with uvtaper = 60kλ. The rms = 15μJy beam−1, the contour levels are at -3, 3 × 2n, n∈ [0, 3], and beam size is 18.48 × 14.72 kpc. |
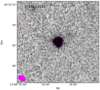 |
Fig. B.179. Pan-STARRS i band image of the host galaxy overlaid with the 90kλ tapered map. Radio map properties are the same as in Fig. B.177. |
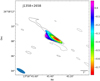 |
Fig. B.180. Spectral index map. The rms = 11μJy beam−1, the contour levels are at -3, 3 × 2n, n∈ [0, 3], and the beam size is 6.24 × 2.00 kpc. |
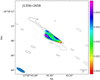 |
Fig. B.181. Spectral index error map. The rms, the contour levels, and the beam size are the same as in Fig. B.180. |
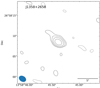 |
Fig. B.182. Tapered map with uvtaper = 90kλ. The rms = 13μJy beam−1, the contour levels are at -3, 3 × 2n, n∈ [0, 3], and the beam size is 8.90 × 6.48 kpc. |
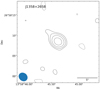 |
Fig. B.183. Tapered map with uvtaper = 60kλ. The rms = 15μJy beam−1, the contour levels are at -3, 3 × 2n, n∈ [0, 3], and the beam size is 11.05 × 9.38 kpc. |
 |
Fig. B.184. Pan-STARRS i band image of the host galaxy overlaid with the 90kλ tapered map. Radio map properties are the same as in Fig. B.182. |
 |
Fig. B.185. Spectral index map. The rms = 16μJy beam−1, the contour levels are at -3, 3 × 2n, n∈ [0, 2], and the beam size is 2.20 × 0.54 kpc. |
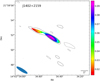 |
Fig. B.186. Spectral index error map. The rms, the contour levels, and the beam size are the same as in Fig. B.185. |
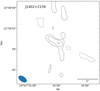 |
Fig. B.187. Tapered map with uvtaper = 90kλ. The rms = 22μJy beam−1, the contour levels are at -3, 3 × 2n, n∈ [0, 2], and the beam size is 2.90 × 1.62 kpc. |
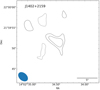 |
Fig. B.188. Tapered map with uvtaper = 60kλ. The rms = 22μJy beam−1, the contour levels are at -3, 3, 6, and the beam size is 3.42 × 2.33 kpc. |
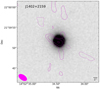 |
Fig. B.189. Pan-STARRS i band image of the host galaxy overlaid with the 90kλ tapered map. Radio map properties are the same as in Fig. B.187. |
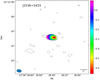 |
Fig. B.190. Spectral index map. The rms = 10μJy beam−1, the contour levels are at -3, 3 × 2n, n∈ [0, 3], and the beam size is 0.53 × 0.33 kpc. |
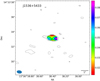 |
Fig. B.191. Spectral index error map. The rms, the contour levels, and the beam size are the same as in Fig. B.190. |
 |
Fig. B.192. Tapered map with uvtaper = 90kλ. The rms = 18μJy beam−1, the contour levels are at -3, 3 × 2n, n∈ [0, 3], and the beam size is 1.17 × 1.00 kpc. |
 |
Fig. B.193. Tapered map with uvtaper = 60kλ. The rms = 23μJy beam−1, the contour levels are at -3, 3 × 2n, n∈ [0, 2], and the beam size is 1.66 × 1.40 kpc. |
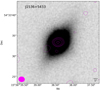 |
Fig. B.194. Pan-STARRS i band image of the host galaxy overlaid with the 90kλ tapered map. Radio map properties are the same as in Fig. B.192. |
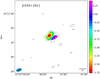 |
Fig. B.195. Spectral index map. The rms = 11μJy beam−1, the contour levels are at -3, 3 × 2n, n∈ [0, 2], and the beam size is 0.54 × 0.30 kpc. |
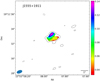 |
Fig. B.196. Spectral index error map. The rms, the contour levels, and the beam size are the same as in Fig. B.195. |
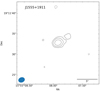 |
Fig. B.197. Tapered map with uvtaper = 90kλ. The rms = 15μJy beam−1, the contour levels are at -3, 3 × 2n, n∈ [0, 2], and the beam size is 1.12 × 0.88 kpc. |
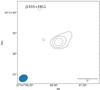 |
Fig. B.198. Tapered map with uvtaper = 60kλ. The rms = 17μJy beam−1, the contour levels are at -3, 3 × 2n, n∈ [0, 2], and the beam size is 1.57 × 1.24 kpc. |
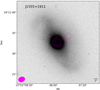 |
Fig. B.199. Pan-STARRS i band image of the host galaxy overlaid with the 90kλ tapered map. Radio map properties are the same as in Fig. B.197. |
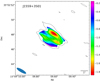 |
Fig. B.200. Spectral index map. The rms = 11μJy beam−1, the contour levels are at -3, 3 × 2n, n∈ [0, 4], and the beam size is 0.91 × 0.25 kpc. |
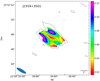 |
Fig. B.201. Spectral index error map. The rms, the contour levels, and the beam size are the same as in Fig. B.200. |
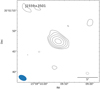 |
Fig. B.202. Tapered map with uvtaper = 90kλ. The rms = 14μJy beam−1, the contour levels are at -3, 3 × 2n, n∈ [0, 4], and the beam size is 1.26 × 0.79 kpc. |
 |
Fig. B.203. Tapered map with uvtaper = 60kλ. The rms = 16μJy beam−1, the contour levels are at -3, 3 × 2n, n∈ [0, 4], and the beam size is 1.59 × 1.13 kpc. |
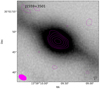 |
Fig. B.204. Pan-STARRS i band image of the host galaxy overlaid with the 90kλ tapered map. Radio map properties are the same as in Fig. B.202. |
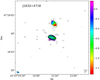 |
Fig. B.205. Spectral index map. The rms = 10μJy beam−1, the contour levels are at -3, 3 × 2n, n∈ [0, 9], and the beam size is 1.60 × 0.84 kpc. |
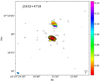 |
Fig. B.206. Spectral index error map. The rms, the contour levels, and the beam size are the same as in Fig. B.205. |
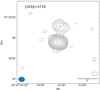 |
Fig. B.207. Tapered map with uvtaper = 90kλ. The rms = 12μJy beam−1, the contour levels are at -3, 3 × 2n, n∈ [0, 9], and the beam size is 3.30 × 2.63 kpc. |
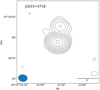 |
Fig. B.208. Tapered map with uvtaper = 60kλ. The rms = 14μJy beam−1, the contour levels are at -3, 3 × 2n, n∈ [0, 9], and the beam size is 4.69 × 3.74 kpc. |
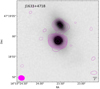 |
Fig. B.209. Pan-STARRS i band image of the host galaxy overlaid with the 90kλ tapered map. Radio map properties are the same as in Fig. B.207. |
 |
Fig. B.210. Spectral index map. The rms = 11μJy beam−1, the contour levels are at -3, 3 × 2n, n∈ [0, 9], and the beam size is 0.88 × 0.48 kpc. |
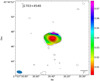 |
Fig. B.211. Spectral index error map. The rms, the contour levels, and the beam size are the same as in Fig. B.210. |
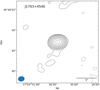 |
Fig. B.212. Tapered map with uvtaper = 90kλ. The rms = 17μJy beam−1, the contour levels are at -3, 3 × 2n, n∈ [0, 9], and the beam size is 1.85 × 1.47 kpc. |
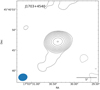 |
Fig. B.213. Tapered map with uvtaper = 60kλ. The rms = 22μJy beam−1, the contour levels are at -3, 3 × 2n, n∈ [0, 9], and the beam size is 2.62 × 2.09 kpc. |
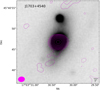 |
Fig. B.214. Pan-STARRS i band image of the host galaxy overlaid with the 90kλ tapered map. Radio map properties are the same as in Fig. B.212. |
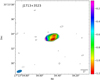 |
Fig. B.215. Spectral index map. The rms = 10μJy beam−1, the contour levels are at -3, 3 × 2n, n∈ [0, 6], and the beam size is 1.16 × 0.58 kpc. |
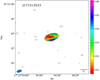 |
Fig. B.216. Spectral index error map. The rms, the contour levels, and the beam size are the same as in Fig. B.215. |
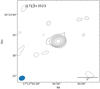 |
Fig. B.217. Tapered map with uvtaper = 90kλ. The rms = 13μJy beam−1, the contour levels are at -3, 3 × 2n, n∈ [0, 6], and the beam size is 2.45 × 1.87 kpc. |
 |
Fig. B.218. Tapered map with uvtaper = 60kλ. The rms = 15μJy beam−1, the contour levels are at -3, 3 × 2n, n∈ [0, 6], and the beam size is 3.43 × 2.65 kpc. |
 |
Fig. B.219. Pan-STARRS i band image of the host galaxy overlaid with the 90kλ tapered map. Radio map properties are the same as in Fig. B.217. |
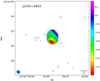 |
Fig. B.220. Spectral index map. The rms = 11μJy beam−1, the contour levels are at -3, 3 × 2n, n∈ [0, 7], and the beam size is 0.27 × 0.24 kpc. |
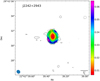 |
Fig. B.221. Spectral index error map. The rms, the contour levels, and the beam size are the same as in Fig. B.220. |
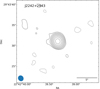 |
Fig. B.222. Tapered map with uvtaper = 90kλ. The rms = 15μJy beam−1, the contour levels are at -3, 3 × 2n, n∈ [0, 7], and the beam size is 0.73 × 0.66 kpc. |
 |
Fig. B.223. Tapered map with uvtaper = 60kλ. The rms = 25μJy beam−1, the contour levels are at -3, 3 × 2n, n∈ [0, 7], and the beam size is 1.06 × 0.92 kpc. |
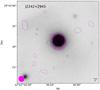 |
Fig. B.224. Pan-STARRS i band image of the host galaxy overlaid with the 90kλ tapered map. Radio map properties are the same as in Fig. B.222. |
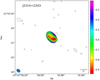 |
Fig. B.225. Spectral index map. The rms = 10μJy beam−1, the contour levels are at -3, 3 × 2n, n∈ [0, 7], and the beam size is 1.70 × 1.27 kpc. |
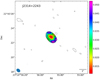 |
Fig. B.226. Spectral index error map. The rms, the contour levels, and the beam size are the same as in Fig. B.225. |
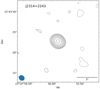 |
Fig. B.227. Tapered map with uvtaper = 90kλ. The rms = 14μJy beam−1, the contour levels are at -3, 3 × 2n, n∈ [0, 7], and the beam size is 4.27 × 3.69 kpc. |
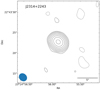 |
Fig. B.228. Tapered map with uvtaper = 60kλ. The rms = 15μJy beam−1, the contour levels are at -3, 3 × 2n, n∈ [0, 7], and the beam size is 6.17 × 5.19 kpc. |
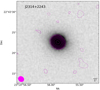 |
Fig. B.229. Pan-STARRS i band image of the host galaxy overlaid with the 90kλ tapered map. Radio map properties are the same as in Fig. B.227. |
All Tables
Measurements from the normal radio map and the 90 and 60kλ tapered maps, and associated rms, for our sample.
Weighted total spectral indices, core spectral indices, spectral indices of regions of interest for our sample, and the non-simultaneous 1.4 - 5.2 GHz spectral index.
All Figures
|
Fig. 1. Redshift distribution of our sample, divided based on the radio morphology classification. Sources with intermediate radio morphology are marked in blue with a dashed edge line, and sources with extended radio morphology are marked in red with a dotted edge line. |
| In the text | |
|
Fig. 2. Logarithmic black hole mass distribution of our sample. The division into sub-samples as well as the colours and edge styles are the same as in Fig. 1. |
| In the text | |
|
Fig. 3. Eddington ratio distribution of our sample. The division into sub-samples as well as the colours and edge styles are the same as in Fig. 1. |
| In the text | |
|
Fig. 4. Distribution of the 5.2 GHz integrated radio luminosities of our sources. The division into sub-samples as well as the colours and edge styles are the same as in Fig. 1. |
| In the text | |
|
Fig. 5. 5.2 GHz flux densities estimated from the 22μm flux densities, and extrapolated from 1.5 GHz using α = −0.7 vs. measured JVLA 5.2 GHz flux densities. The error bars of the flux densities are smaller than the size of the markers and not shown. Sources with the WISE W3–W4 colour > 2.5, that is, sources that are unusually red and most likely to have enhanced star formation, are shown with filled red squares, and sources with the WISE W3–W4 colour < 2.5, that is, sources that are not unusually red, as filled blue circles. The black line denotes equal flux densities. S5.2 GHz CDFS and S5.2 GHz JVLA values close to each other means that the bulk of the radio emission can be explained by star formation processes, whereas the sources lying below the black line have excess radio emission. |
| In the text | |
|
Fig. 6. WISE W3 flux densities vs. JVLA 1.4 GHz flux densities extrapolated from the 5.2 GHz flux densities using the total spectral indices from the α maps. The error bars of the flux densities are smaller than the size of the markers and are not shown. Sources with the WISE W3–W4 colour > 2.5, that is, sources that are unusually red and most likely to have enhanced star formation, are shown with filled red squares, and sources with the WISE W3–W4 colour < 2.5, that is, sources that are not unusually red, as filled blue circles. The black line denotes equal flux densities. Sources above the black line should have more contribution from star formation, whereas the sources below the black line should be dominated by AGN activity. |
| In the text | |
|
Fig. B.1. Spectral index map. The rms = 14μJy beam−1, the contour levels are at -3, 3 × 2n, n∈ [0, 7], and the beam size is 0.23 × 0.17 kpc. |
| In the text | |
|
Fig. B.2. Spectral index error map. The rms, the contour levels, and the beam size are the same as in Fig. B.1. |
| In the text | |
|
Fig. B.3. Tapered map with uvtaper = 90kλ. The rms = 25μJy beam−1, the contour levels are at -3, 3 × 2n, n∈ [0, 7], and the beam size is 0.69 × 0.63 kpc. |
| In the text | |
|
Fig. B.4. Tapered map with uvtaper = 60kλ. The rms = 33μJy beam−1, the contour levels are at -3, 3 × 2n, n∈ [0, 6], and the beam size is 1.01 × 0.94 kpc. |
| In the text | |
|
Fig. B.5. Pan-STARRS i band image of the host galaxy overlaid with the 90kλ tapered map. Radio map properties are the same as in Fig. B.3. |
| In the text | |
|
Fig. B.6. Spectral index map. The rms = 14μJy beam−1, the contour levels are at -3, 3 × 2n, n∈ [0, 8], and the beam size is 3.09 × 0.93 kpc. |
| In the text | |
|
Fig. B.7. Spectral index error map. The rms, the contour levels, and the beam size are the same as in Fig. B.6. |
| In the text | |
|
Fig. B.8. Tapered map with uvtaper = 90kλ. The rms = 22μJy beam−1, the contour levels are at -3, 3 × 2n, n∈ [0, 7], and the beam size is 4.15 × 2.73 kpc. |
| In the text | |
|
Fig. B.9. Tapered map with uvtaper = 60kλ. The rms = 26μJy beam−1, the contour levels are at -3, 3 × 2n, n∈ [0, 7], and the beam size is 5.12 × 3.91 kpc. |
| In the text | |
|
Fig. B.10. Pan-STARRS i band image of the host galaxy overlaid with the normal map. Radio map properties are the same as in Fig. B.6. |
| In the text | |
|
Fig. B.11. Pan-STARRS i band image of the host galaxy overlaid with the 90kλ tapered map. Radio map properties are the same as in Fig. B.8. |
| In the text | |
|
Fig. B.12. Spectral index map. The rms = 10 μJy beam−1, the contour levels are at -3, 3 × 2n, n∈ [0, 5], and the beam size is 0.22 × 0.11 kpc. |
| In the text | |
|
Fig. B.13. Spectral index error map. The rms, the contour levels, and the beam size are the same as in Fig. B.12. |
| In the text | |
|
Fig. B.14. Tapered map with uvtaper = 90kλ. The rms = 14μJy beam−1, the contour levels are at -3, 3 × 2n, n∈ [0, 5], and the beam size is 0.42 × 0.34 kpc. |
| In the text | |
|
Fig. B.15. Tapered map with uvtaper = 60kλ. The rms = 16μJy beam−1, the contour levels are at -3, 3 × 2n, n∈ [0, 5], the beam size is 0.59 × 0.48 kpc. |
| In the text | |
|
Fig. B.16. Pan-STARRS i band image of the host galaxy overlaid with the 90kλ tapered map. Radio map properties are the same as in Fig. B.14. |
| In the text | |
|
Fig. B.17. Pan-STARRS i band image of the host galaxy overlaid with the 90kλ tapered map. Radio map properties are the same as in Fig. B.14. |
| In the text | |
|
Fig. B.18. Spectral index map. The rms = 13μJy beam−1, the contour levels are at -3, 3 × 2n, n∈ [0, 5], and beam size is 1.68 × 0.85 kpc. |
| In the text | |
|
Fig. B.19. Spectral index error map. The rms, the contour levels, and the beam size are the same as in Fig. B.18. |
| In the text | |
|
Fig. B.20. Tapered map with uvtaper = 90kλ. The rms = 17μJy beam−1, the contour levels are at -3, 3 × 2n, n∈ [0, 5], and the beam size is 2.66 × 2.27 kpc. |
| In the text | |
|
Fig. B.21. Tapered map with uvtaper = 60kλ. The rms = 21μJy beam−1, the contour levels are at -3, 3 × 2n, n∈ [0, 5], and the beam size is 3.53 × 3.21 kpc. |
| In the text | |
|
Fig. B.22. Pan-STARRS i band image of the host galaxy overlaid with the 90kλ tapered map. Radio map properties are the same as in Fig. B.20. |
| In the text | |
|
Fig. B.23. Spectral index map. The rms = 13μJy beam−1, the contour levels are at -3, 3 × 2n, n∈ [0, 5], and the beam size is 2.45 × 1.19 kpc. |
| In the text | |
|
Fig. B.24. Spectral index error map. The rms, the contour levels, and the beam size are the same as in Fig. B.23. |
| In the text | |
|
Fig. B.25. Tapered map with uvtaper = 90kλ. The rms = 19μJy beam−1, the contour levels are at -3, 3 × 2n, n∈ [0, 5], and the beam size is 3.65 × 3.01 kpc. |
| In the text | |
|
Fig. B.26. Tapered map with uvtaper = 60kλ. The rms = 23μJy beam−1, the contour levels are at -3, 3 × 2n, n∈ [0, 5], and the beam size is 4.82 × 4.33 kpc. |
| In the text | |
|
Fig. B.27. Pan-STARRS i band image of the host galaxy overlaid with the 90kλ tapered map. Radio map properties are the same as in Fig. B.25. |
| In the text | |
|
Fig. B.28. Spectral index map. The rms = 10μJy beam−1, the contour levels are at -3, 3 × 2n, n∈ [0, 3], and the beam size is 1.55 × 1.42 kpc. |
| In the text | |
|
Fig. B.29. Spectral index error map. The rms, the contour levels, and the beam size are the same as in Fig. B.28. |
| In the text | |
|
Fig. B.30. Tapered map with uvtaper = 90kλ. The rms = 18μJy beam−1, the contour levels are at -3, 3 × 2n, n∈ [0, 3], and the beam size is 4.73 × 4.59 kpc. |
| In the text | |
|
Fig. B.31. Tapered map with uvtaper = 60kλ. The rms = 23μJy beam−1, the contour levels are at -3, 3 × 2n, n∈ [0, 3], and the beam size is 6.66 × 6.46 kpc. |
| In the text | |
|
Fig. B.32. Pan-STARRS i band image of the host galaxy overlaid with the 90kλ tapered map. Radio map properties are the same as in Fig. B.30. |
| In the text | |
|
Fig. B.33. Spectral index map. The rms = 10μJy beam−1, the contour levels are at -3, 3 × 2n, n∈ [0, 8], and the beam size is 1.30 × 0.72 kpc. |
| In the text | |
|
Fig. B.34. Spectral index error map. The rms, the contour levels, and the beam size are the same as in Fig. B.33. |
| In the text | |
|
Fig. B.35. Tapered map with uvtaper = 90kλ. The rms = 11μJy beam−1, the contour levels are at -3, 3 × 2n, n∈ [0, 8], and the beam size is 2.79 × 2.41 kpc. |
| In the text | |
|
Fig. B.36. Tapered map with uvtaper = 60kλ. The rms = 12μJy beam−1, the contour levels are at -3, 3 × 2n, n∈ [0, 8], and the beam size is 4.08 × 3.37 kpc. |
| In the text | |
|
Fig. B.37. Pan-STARRS i band image of the host galaxy overlaid with the 90kλ tapered map. Radio map properties are the same as in Fig. B.35. |
| In the text | |
|
Fig. B.38. Spectral index map. The rms = 10μJy beam−1, the contour levels are at -3, 3 × 2n, n∈ [0, 9], and the beam size is 5.12 × 2.28 kpc. |
| In the text | |
|
Fig. B.39. Spectral index error map. The rms, the contour levels, and the beam size are the same as in Fig. B.38. |
| In the text | |
|
Fig. B.40. Tapered map with uvtaper = 90kλ. The rms = 16μJy beam−1, the contour levels are at -3, 3 × 2n, n∈ [0, 9], and the beam size is 10.05 × 7.77 kpc. |
| In the text | |
|
Fig. B.41. Tapered map with uvtaper = 60kλ. The rms = 19μJy beam−1, the contour levels are at -3, 3 × 2n, n∈ [0, 8], and the beam size is 14.74 × 10.98 kpc. |
| In the text | |
|
Fig. B.42. Pan-STARRS i band image of the host galaxy overlaid with the normal map. Radio map properties are the same as in Fig. B.38. |
| In the text | |
|
Fig. B.43. Pan-STARRS i band image of the host galaxy overlaid with the 90kλ tapered map. Radio map properties are the same as in Fig. B.40. |
| In the text | |
|
Fig. B.44. Spectral index map. The rms = 11μJy beam−1, the contour levels are at -3, 3 × 2n, n∈ [0, 3], and the beam size is 2.31 × 0.80 kpc. |
| In the text | |
|
Fig. B.45. Spectral index error map. The rms, the contour levels, and the beam size are the same as in Fig. B.44. |
| In the text | |
|
Fig. B.46. Tapered map with uvtaper = 90kλ. The rms = 17μJy beam−1, the contour levels are at -3, 3 × 2n, n∈ [0, 2], and the beam size is 3.47 × 2.58 kpc. |
| In the text | |
|
Fig. B.47. Tapered map with uvtaper = 60kλ. The rms = 26μJy beam−1, the contour levels are at -3, 3 × 2n, n∈ [0, 2], and the beam size is 4.41 × 3.82 kpc. |
| In the text | |
|
Fig. B.48. Pan-STARRS i band image of the host galaxy overlaid with the 90kλ tapered map. Radio map properties are the same as in Fig. B.46. |
| In the text | |
|
Fig. B.49. Spectral index map. The rms = 12μJy beam−1, the contour levels are at -3, 3 × 2n, n∈ [0, 5], and the beam size is 0.38 × 0.33 kpc. |
| In the text | |
|
Fig. B.50. Spectral index error map. The rms, the contour levels, and the beam size are the same as in Fig. B.49. |
| In the text | |
|
Fig. B.51. Tapered map with uvtaper = 90kλ. The rms = 16μJy beam−1, the contour levels are at -3, 3 × 2n, n∈ [0, 5], and the beam size is 1.00 × 0.95 kpc. |
| In the text | |
|
Fig. B.52. Tapered map with uvtaper = 60kλ. The rms = 21μJy beam−1, the contour levels are at -3, 3 × 2n, n∈ [0, 5], and the beam size is 1.39 × 1.35 kpc. |
| In the text | |
|
Fig. B.53. Pan-STARRS i band image of the host galaxy overlaid with the 90kλ tapered map. Radio map properties are the same as in Fig. B.51. |
| In the text | |
|
Fig. B.54. Spectral index map. The rms = 11μJy beam−1, the contour levels are at -3, 3 × 2n, n∈ [0, 6], and the beam size is 0.55 × 0.24 kpc. |
| In the text | |
|
Fig. B.55. Spectral index error map. The rms, the contour levels, and the beam size are the same as in Fig. B.54. |
| In the text | |
|
Fig. B.56. Tapered map with uvtaper = 90kλ. The rms = 17μJy beam−1, the contour levels are at -3, 3 × 2n, n∈ [0, 5], and the beam size is 0.99 × 0.72 kpc. |
| In the text | |
|
Fig. B.57. Tapered map with uvtaper = 60kλ. The rms = 22μJy beam−1, the contour levels are at -3, 3 × 2n, n∈ [0, 5], and the beam size is 1.42 × 1.01 kpc. |
| In the text | |
|
Fig. B.58. Pan-STARRS i band image of the host galaxy overlaid with the 90kλ tapered map. Radio map properties are the same as in Fig. B.56. |
| In the text | |
|
Fig. B.59. Spectral index map. The rms = 12μJy beam−1, the contour levels are at -3, 3 × 2n, n∈ [0, 4], and the beam size is 3.92 × 1.24 kpc. |
| In the text | |
|
Fig. B.60. Spectral index error map. The rms, the contour levels, and the beam size are the same as in Fig. B.59. |
| In the text | |
|
Fig. B.61. Tapered map with uvtaper = 90kλ. The rms = 15μJy beam−1, the contour levels are at -3, 3 × 2n, n∈ [0, 4], and the beam size is 5.68 × 4.10 kpc. |
| In the text | |
|
Fig. B.62. Tapered map with uvtaper = 60kλ. The rms = 19μJy beam−1, the contour levels are at -3, 3 × 2n, n∈ [0, 4], and the beam size is 6.98 × 6.07 kpc. |
| In the text | |
|
Fig. B.63. Pan-STARRS i band image of the host galaxy overlaid with the 90kλ tapered map. Radio map properties are the same as in Fig. B.61. |
| In the text | |
|
Fig. B.64. Spectral index map. The rms = 10μJy beam−1, the contour levels are at -3, 3 × 2n, n∈ [0, 9], and the beam size is 0.37 × 0.17 kpc. |
| In the text | |
|
Fig. B.65. Spectral index error map. The rms, the contour levels, and the beam size are the same as in Fig. B.64. |
| In the text | |
|
Fig. B.66. Tapered map with uvtaper = 90kλ. The rms = 12μJy beam−1, the contour levels are at -3, 3 × 2n, n∈ [0, 8], and the beam size is 0.69 × 0.53 kpc. |
| In the text | |
|
Fig. B.67. Tapered map with uvtaper = 60kλ. The rms = 14μJy beam−1, the contour levels are at -3, 3 × 2n, n∈ [0, 8], and the beam size is 0.96 × 0.76 kpc. |
| In the text | |
|
Fig. B.68. Pan-STARRS i band image of the host galaxy overlaid with the 90kλ tapered map. Radio map properties are the same as in Fig. B.66. |
| In the text | |
|
Fig. B.69. Spectral index map. The rms = 10μJy, the contour levels are at -3, 3 × 2n, n∈ [0, 7], and the beam size is 0.46 × 0.36 kpc. |
| In the text | |
|
Fig. B.70. Spectral index error map. The rms, the contour levels, and the beam size are the same as in Fig. B.69. |
| In the text | |
|
Fig. B.71. Tapered map with uvtaper = 90kλ. The rms = 12μJy beam−1, the contour levels are at -3, 3 × 2n, n∈ [0, 7], and the beam size is 1.17 × 1.08 kpc. |
| In the text | |
|
Fig. B.72. Tapered map with uvtaper = 60kλ. The rms = 14μJy beam−1, the contour levels are at -3, 3 × 2n, n∈ [0, 7], and the beam size is 1.63 × 1.53 kpc. |
| In the text | |
|
Fig. B.73. Pan-STARRS i band image of the host galaxy overlaid with the 90kλ tapered map. Radio map properties are the same as in Fig. B.71. |
| In the text | |
|
Fig. B.74. Spectral index map. The rms = 10μJy beam−1, the contour levels are at -3, 3 × 2n, n∈ [0, 6], and the beam size is 1.92 × 1.60 kpc. |
| In the text | |
|
Fig. B.75. Spectral index error map. The rms, the contour levels, and the beam size are the same as in Fig. B.74. |
| In the text | |
|
Fig. B.76. Tapered map with uvtaper = 90kλ. The rms = 13μJy beam−1, the contour levels are at -3, 3 × 2n, n∈ [0, 5], and the beam size is 4.97 × 4.65 kpc. |
| In the text | |
|
Fig. B.77. Tapered map with uvtaper = 60kλ. The rms = 17μJy beam−1, the contour levels are at -3, 3 × 2n, n∈ [0, 5], and the beam size is 6.96 × 6.57 kpc. |
| In the text | |
|
Fig. B.78. Pan-STARRS i band image of the host galaxy overlaid with the 90kλ tapered map. Radio map properties are the same as in Fig. B.76. |
| In the text | |
|
Fig. B.79. Spectral index map. The rms = 35μJy beam−1, the contour levels are at -3, 3 × 2n, n∈ [0, 10], and the beam size is 2.78 × 1.95 kpc. |
| In the text | |
|
Fig. B.80. Spectral index error map. The rms, the contour levels, and the beam size are the same as in Fig. B.79. |
| In the text | |
|
Fig. B.81. Tapered map with uvtaper = 90kλ. The rms = 50μJy beam−1, the contour levels are at -3, 3 × 2n, n∈ [0, 11], and the beam size is 7.66 × 7.28 kpc. |
| In the text | |
|
Fig. B.82. Tapered map with uvtaper = 60kλ. The rms = 80μJy beam−1, the contour levels are at -3, 3 × 2n, n∈ [0, 10], and the beam size is 11.56 × 11.03 kpc. |
| In the text | |
|
Fig. B.83. Pan-STARRS i band image of the host galaxy overlaid with the 90kλ tapered map. Radio map properties are the same as in Fig. B.81. |
| In the text | |
|
Fig. B.84. Spectral index map. The rms = 8μJy beam−1, the contour levels are at -3, 3 × 2n, n∈ [0, 3], and the beam size is 3.14 × 2.00 kpc. |
| In the text | |
|
Fig. B.85. Spectral index error map. The rms, the contour levels, and the beam size are the same as in Fig. B.84. |
| In the text | |
|
Fig. B.86. Tapered map with uvtaper = 90kλ. The rms = 9μJy beam−1, the contour levels are at -3, 3 × 2n, n∈ [0, 3], and the beam size is 7.27 × 6.04 kpc. |
| In the text | |
|
Fig. B.87. Tapered map with uvtaper = 60kλ. The rms = 10μJy beam−1, the contour levels are at -3, 3 × 2n, n∈ [0, 3], and the beam size is 10.12 × 8.55 kpc. |
| In the text | |
|
Fig. B.88. Pan-STARRS i band image of the host galaxy overlaid with the 90kλ tapered map. Radio map properties are the same as in Fig. B.86. |
| In the text | |
|
Fig. B.89. Spectral index map. The rms = 13μJy beam−1, the contour levels are at -3, 3 × 2n, n∈ [0, 4], and the beam size is 3.76 × 2.37 kpc. |
| In the text | |
|
Fig. B.90. Spectral index error map. The rms, the contour levels, and the beam size are the same as in Fig. B.89. |
| In the text | |
|
Fig. B.91. Tapered map with uvtaper = 90kλ. The rms = 36μJy beam−1, the contour levels are at -3, 3 × 2n, n∈ [0, 2], and the beam size is 8.84 × 7.40 kpc. |
| In the text | |
|
Fig. B.92. Tapered map with uvtaper = 60kλ. The rms = 45μJy beam−1, the contour levels are at -3, 3 × 2n, n∈ [0, 2], and the beam size is 12.43 × 10.58 kpc. |
| In the text | |
|
Fig. B.93. Pan-STARRS i band image of the host galaxy overlaid with the 90kλ tapered map. Radio map properties are the same as in Fig. B.91. |
| In the text | |
|
Fig. B.94. Spectral index map. The rms = 10μJy beam−1, the contour levels are at -3, 3 × 2n, n∈ [0, 8], and the beam size is 3.42 × 2.80 kpc. |
| In the text | |
|
Fig. B.95. Spectral index error map. The rms, the contour levels, and the beam size are the same as in Fig. B.94. |
| In the text | |
|
Fig. B.96. Tapered map with uvtaper = 90kλ. The rms = 11μJy beam−1, the contour levels are at -3, 3 × 2n, n∈ [0, 7], and the beam size is 9.70 × 8.81 kpc. |
| In the text | |
|
Fig. B.97. Tapered map with uvtaper = 60kλ. The rms = 12μJy beam−1, the contour levels are at -3, 3 × 2n, n∈ [0, 7], and the beam size is 13.66 × 12.50 kpc. |
| In the text | |
|
Fig. B.98. Pan-STARRS i band image of the host galaxy overlaid with the normal map. Radio map properties are the same as in Fig. B.94. |
| In the text | |
|
Fig. B.99. Pan-STARRS i band image of the host galaxy overlaid with the 90kλ tapered map. Radio map properties are the same as in Fig. B.96. |
| In the text | |
|
Fig. B.100. Spectral index map. The rms = 11μJy beam−1, the contour levels are at -3, 3 × 2n, n∈ [0, 4], and the beam size is 0.97 × 0.85 kpc. |
| In the text | |
|
Fig. B.101. Spectral index error map. The rms, the contour levels, and the beam size are the same as in Fig. B.100. |
| In the text | |
|
Fig. B.102. Tapered map with uvtaper = 90kλ. The rms = 12μJy beam−1, the contour levels are at -3, 3 × 2n, n∈ [0, 5], and the beam size is 2.63 × 2.50 kpc. |
| In the text | |
|
Fig. B.103. Tapered map with uvtaper = 60kλ. The rms = 14μJy beam−1, the contour levels are at -3, 3 × 2n, n∈ [0, 4], and the beam size is 3.71 × 3.50 kpc. |
| In the text | |
|
Fig. B.104. Pan-STARRS i band image of the host galaxy overlaid with the 90kλ tapered map. Radio map properties are the same as in Fig. B.102. |
| In the text | |
|
Fig. B.105. Spectral index map. The rms = 10μJy beam−1, the contour levels are at -3, 3 × 2n, n∈ [0, 7], and the beam size is 2.60 × 2.20 kpc. |
| In the text | |
|
Fig. B.106. Spectral index error map. The rms, the contour levels, and the beam size are the same as in Fig. B.105. |
| In the text | |
|
Fig. B.107. Tapered map with uvtaper = 90kλ. The rms = 12μJy beam−1, the contour levels are at -3, 3 × 2n, n∈ [0, 7], and the beam size is 7.04 × 6.49 kpc. |
| In the text | |
|
Fig. B.108. Tapered map with uvtaper = 60kλ. The rms = 12μJy beam−1, the contour levels are at -3, 3 × 2n, n∈ [0, 7], and the beam size is 9.94 × 9.19 kpc. |
| In the text | |
|
Fig. B.109. Pan-STARRS i band image of the host galaxy overlaid with the 90kλ tapered map. Radio map properties are the same as in Fig. B.107. |
| In the text | |
|
Fig. B.110. Spectral index map. The rms = 10μJy beam−1, the contour levels are at -3, 3 × 2n, n∈ [0, 4], and the beam size is 1.78 × 1.44 kpc. |
| In the text | |
|
Fig. B.111. Spectral index error map. The rms, the contour levels, and the beam size are the same as in Fig. B.110. |
| In the text | |
|
Fig. B.112. Tapered map with uvtaper = 90kλ. The rms = 13μJy beam−1, the contour levels are at -3, 3 × 2n, n∈ [0, 4], and the beam size is 5.00 × 4.35 kpc. |
| In the text | |
|
Fig. B.113. Tapered map with uvtaper = 60kλ. The rms = 14μJy beam−1, the contour levels are at -3, 3 × 2n, n∈ [0, 4], and the beam size is 7.09 × 6.13 kpc. |
| In the text | |
|
Fig. B.114. Pan-STARRS i band image of the host galaxy overlaid with the 90kλ tapered map. Radio map properties are the same as in Fig. B.112. |
| In the text | |
|
Fig. B.115. Spectral index map. The rms = 12μJy beam−1, the contour levels are at -3, 3 × 2n, n∈ [0, 4], and the beam size is 0.02 × 0.02 kpc. |
| In the text | |
|
Fig. B.116. Spectral index error map. The rms, the contour levels, and the beam size are the same as in Fig. B.115. |
| In the text | |
|
Fig. B.117. Tapered map with uvtaper = 90kλ. The rms = 29μJy beam−1, the contour levels are at -3, 3 × 2n, n∈ [0, 4], and the beam size is 0.06 × 0.05 kpc. |
| In the text | |
|
Fig. B.118. Tapered map with uvtaper = 60kλ. The rms = 38μJy beam−1, the contour levels are at -3, 3 × 2n, n∈ [0, 4], and the beam size is 0.08 × 0.08 kpc. |
| In the text | |
|
Fig. B.119. Pan-STARRS i band image of the host galaxy overlaid with the 90kλ tapered map. Radio map properties are the same as in Fig. B.117. |
| In the text | |
|
Fig. B.120. Pan-STARRS i band image of the host galaxy overlaid with the 90kλ tapered map. Radio map properties are the same as in Fig. B.117. |
| In the text | |
|
Fig. B.121. Spectral index map. The rms = 13μJy beam−1, the contour levels are at -3, 3 × 2n, n∈ [0, 3], and the beam size is 0.78 × 0.76 kpc. |
| In the text | |
|
Fig. B.122. Spectral index error map. The rms, the contour levels, and the beam size are the same as in Fig. B.121. |
| In the text | |
|
Fig. B.123. Tapered map with uvtaper = 90kλ. The rms = 14μJy beam−1, the contour levels are at -3, 3 × 2n, n∈ [0, 3], and the beam size is 2.65 × 2.58 kpc. |
| In the text | |
|
Fig. B.124. Tapered map with uvtaper = 60kλ. The rms = 15μJy beam−1, the contour levels are at -3, 3 × 2n, n∈ [0, 3], and the beam size is 3.97 × 3.87 kpc. |
| In the text | |
|
Fig. B.125. Pan-STARRS i band image of the host galaxy overlaid with the 90kλ tapered map. Radio map properties are the same as in Fig. B.123. |
| In the text | |
|
Fig. B.126. Spectral index map. The rms = 10μJy beam−1, the contour levels are at -3, 3 × 2n, n∈ [0, 4], and the beam size is 1.20 × 1.07 kpc. |
| In the text | |
|
Fig. B.127. Spectral index error map. The rms, the contour levels, and the beam size are the same as in Fig. B.126. |
| In the text | |
|
Fig. B.128. Tapered map with uvtaper = 90kλ. The rms = 12μJy beam−1, the contour levels are at -3, 3 × 2n, n∈ [0, 4], and the beam size is 3.56 × 3.48 kpc. |
| In the text | |
|
Fig. B.129. Tapered map with uvtaper = 60kλ. The rms = 13μJy beam−1, the contour levels are at -3, 3 × 2n, n∈ [0, 4], and the beam size is 4.99 × 4.91 kpc. |
| In the text | |
|
Fig. B.130. Pan-STARRS i band image of the host galaxy overlaid with the 90kλ tapered map. Radio map properties are the same as in Fig. B.128. |
| In the text | |
|
Fig. B.131. Spectral index map. The rms = 9μJy beam−1, the contour levels are at -3, 3 × 2n, n∈ [0, 8], and the beam size is 0.15 × 0.12 kpc. |
| In the text | |
|
Fig. B.132. Spectral index error map. The rms, the contour levels, and the beam size are the same as in Fig. B.131. |
| In the text | |
|
Fig. B.133. Tapered map with uvtaper = 90kλ. The rms = 10μJy beam−1, the contour levels are at -3, 3 × 2n, n∈ [0, 8], and the beam size is 0.39 × 0.34 kpc. |
| In the text | |
|
Fig. B.134. Tapered map with uvtaper = 60kλ. The rms = 12μJy beam−1, the contour levels are at -3, 3 × 2n, n∈ [0, 8], and the beam size is 0.56 × 0.48 kpc. |
| In the text | |
|
Fig. B.135. Pan-STARRS i band image of the host galaxy overlaid with the 90kλ tapered map. Radio map properties are the same as in Fig. B.133. |
| In the text | |
|
Fig. B.136. Pan-STARRS i band image of the host galaxy overlaid with the 90kλ tapered map. Radio map properties are the same as in Fig. B.133. |
| In the text | |
|
Fig. B.137. Spectral index map. The rms = 11μJy beam−1, the contour levels are at -3, 3 × 2n, n∈ [0, 6], and the beam size is 1.23 × 1.01 kpc. |
| In the text | |
|
Fig. B.138. Spectral index error map. The rms, the contour levels, and the beam size are the same as in Fig. B.137. |
| In the text | |
|
Fig. B.139. Tapered map with uvtaper = 90kλ. The rms = 17μJy beam−1, the contour levels are at -3, 3 × 2n, n∈ [0, 5], and the beam size is 3.54 × 3.06 kpc. |
| In the text | |
|
Fig. B.140. Tapered map with uvtaper = 60kλ. The rms = 23μJy beam−1, the contour levels are at -3, 3 × 2n, n∈ [0, 5], and the beam size is 5.03 × 4.31 kpc. |
| In the text | |
|
Fig. B.141. Pan-STARRS i band image of the host galaxy overlaid with the 90kλ tapered map. Radio map properties are the same as in Fig. B.139. |
| In the text | |
|
Fig. B.142. Spectral index map. The rms = 12μJy beam−1, the contour levels are at -3, 3 × 2n, n∈ [0, 5], and the beam size is 0.43 × 0.33 kpc. |
| In the text | |
|
Fig. B.143. Spectral index error map. The rms, the contour levels, and the beam size are the same as in Fig. B.142. |
| In the text | |
|
Fig. B.144. Tapered map with uvtaper = 90kλ. The rms = 16μJy beam−1, the contour levels are at -3, 3 × 2n, n∈ [0, 5], and the beam size is 1.38 × 1.01 kpc. |
| In the text | |
|
Fig. B.145. Tapered map with uvtaper = 60kλ. The rms = 21μJy beam−1, the contour levels are at -3, 3 × 2n, n∈ [0, 5], and the beam size is 2.04 × 1.41 kpc. |
| In the text | |
|
Fig. B.146. Pan-STARRS i band image of the host galaxy overlaid with the 90kλ tapered map. Radio map properties are the same as in Fig. B.144. |
| In the text | |
|
Fig. B.147. Spectral index map. The rms = 10μJy beam−1, the contour levels are at -3, 3 × 2n, n∈ [0, 3], and the beam size is 0.53 × 0.42 kpc. |
| In the text | |
|
Fig. B.148. Spectral index error map. The rms, the contour levels, and the beam size are the same as in Fig. B.147. |
| In the text | |
|
Fig. B.149. Tapered map with uvtaper = 90kλ. The rms = 11μJy beam−1, the contour levels are at -3, 3 × 2n, n∈ [0, 4], and the beam size is 1.35 × 1.22 kpc. |
| In the text | |
|
Fig. B.150. Tapered map with uvtaper = 60kλ. The rms = 15μJy beam−1, the contour levels are at -3, 3 × 2n, n∈ [0, 3], and the beam size is 1.91 × 1.72 kpc. |
| In the text | |
|
Fig. B.151. Pan-STARRS i band image of the host galaxy overlaid with the 90kλ tapered map. Radio map properties are the same as in Fig. B.149. |
| In the text | |
|
Fig. B.152. Spectral index map. The rms = 12μJy beam−1, the contour levels are at -3, 3 × 2n, n∈ [0, 6], the beam size is 0.58 × 0.50 kpc. Non-common uv range. |
| In the text | |
|
Fig. B.153. Spectral index error map. The rms, the contour levels, and the beam size are the same as in Fig. B.152. |
| In the text | |
|
Fig. B.154. Tapered map with uvtaper = 90kλ. The rms = 28μJy beam−1, the contour levels are at -3, 3 × 2n, n∈ [0, 5], and the beam size is 1.94 × 1.59 kpc. |
| In the text | |
|
Fig. B.155. Tapered map with uvtaper = 60kλ. The rms = 35μJy beam−1, the contour levels are at -3, 3 × 2n, n∈ [0, 5], and the beam size is 2.66 × 2.27 kpc. |
| In the text | |
|
Fig. B.156. Pan-STARRS i band image of the host galaxy overlaid with the 90kλ tapered map. Radio map properties are the same as in Fig. B.154. |
| In the text | |
|
Fig. B.157. Spectral index map. The rms = 12μJy beam−1, the contour levels are at -3, 3 × 2n, n∈ [0, 6], and the beam size is 0.60 × 0.54 kpc. Common uv range. |
| In the text | |
|
Fig. B.158. Spectral index error map. The rms, the contour levels, and the beam size are the same as in Fig. B.157. |
| In the text | |
|
Fig. B.159. Spectral index map. The rms = 14μJy beam−1, the contour levels are at -3, 3 × 2n, n∈ [0, 9], and the beam size is 12.70 × 3.21 kpc. |
| In the text | |
|
Fig. B.160. Spectral index error map. The rms, the contour levels, and the beam size are the same as in Fig. B.159. |
| In the text | |
|
Fig. B.161. Tapered map with uvtaper = 90kλ. The rms = 16μJy beam−1, the contour levels are at -3, 3 × 2n, n∈ [0, 9], and the beam size is 17.03 × 8.66 kpc. |
| In the text | |
|
Fig. B.162. Tapered map with uvtaper = 60kλ. The rms = 20μJy beam−1, the contour levels are at -3, 3 × 2n, n∈ [0, 9], and the beam size is 22.18 × 12.10 kpc. |
| In the text | |
|
Fig. B.163. Pan-STARRS i band image of the host galaxy overlaid with the normal radio map. Radio map properties are the same as in Fig. B.159. |
| In the text | |
|
Fig. B.164. Pan-STARRS i band image of the host galaxy overlaid with the 90kλ tapered map. Radio map properties are the same as in Fig. B.161. |
| In the text | |
|
Fig. B.165. Spectral index map. The rms = 16μJy beam−1, the contour levels are at -3, 3 × 2n, n∈ [0, 3], and the beam size is 2.20 × 0.73 kpc. |
| In the text | |
|
Fig. B.166. Spectral index error map. The rms, the contour levels, and the beam size are the same as in Fig. B.165. |
| In the text | |
|
Fig. B.167. Tapered map with uvtaper = 90kλ. The rms = 24μJy beam−1, the contour levels are at -3, 3 × 2n, n∈ [0, 3], and the beam size is 2.98 × 2.37 kpc. |
| In the text | |
|
Fig. B.168. Tapered map with uvtaper = 60kλ. The rms = 29μJy beam−1, the contour levels are at -3, 3 × 2n, n∈ [0, 3], and the beam size is 4.09 × 3.39 kpc. |
| In the text | |
|
Fig. B.169. Pan-STARRS i band image of the host galaxy overlaid with the 90kλ tapered map. Radio map properties are the same as in Fig. B.167. |
| In the text | |
|
Fig. B.170. Spectral index map. The rms = 13μJy beam−1, the contour levels are at -3, 3 × 2n, n∈ [0, 7], and the beam size is 2.37 × 0.91 kpc. |
| In the text | |
|
Fig. B.171. Spectral index error map. The rms, the contour levels, and the beam size are the same as in Fig. B.170. |
| In the text | |
|
Fig. B.172. Tapered map with uvtaper = 90kλ. The rms = 14μJy beam−1, the contour levels are at -3, 3 × 2n, n∈ [0, 7], and the beam size is 3.59 × 2.59 kpc. |
| In the text | |
|
Fig. B.173. Tapered map with uvtaper = 60kλ. The rms = 16μJy beam−1, the contour levels are at -3, 3 × 2n, n∈ [0, 7], and the beam size is 4.70 × 3.69 kpc. |
| In the text | |
|
Fig. B.174. Pan-STARRS i band image of the host galaxy overlaid with the 90kλ tapered map. Radio map properties are the same as in Fig. B.172. |
| In the text | |
|
Fig. B.175. Spectral index map. The rms = 12μJy beam−1, the contour levels are at -3, 3 × 2n, n∈ [0, 3], and the beam size is 10.26 × 3.29 kpc. |
| In the text | |
|
Fig. B.176. Spectral index error map. The rms, the contour levels, and the beam size are the same as in Fig. B.175. |
| In the text | |
|
Fig. B.177. Tapered map with uvtaper = 90kλ. The rms = 14μJy beam−1, the contour levels are at -3, 3 × 2n, n∈ [0, 3], and the beam size is 14.72 × 10.18 kpc. |
| In the text | |
|
Fig. B.178. Tapered map with uvtaper = 60kλ. The rms = 15μJy beam−1, the contour levels are at -3, 3 × 2n, n∈ [0, 3], and beam size is 18.48 × 14.72 kpc. |
| In the text | |
|
Fig. B.179. Pan-STARRS i band image of the host galaxy overlaid with the 90kλ tapered map. Radio map properties are the same as in Fig. B.177. |
| In the text | |
|
Fig. B.180. Spectral index map. The rms = 11μJy beam−1, the contour levels are at -3, 3 × 2n, n∈ [0, 3], and the beam size is 6.24 × 2.00 kpc. |
| In the text | |
|
Fig. B.181. Spectral index error map. The rms, the contour levels, and the beam size are the same as in Fig. B.180. |
| In the text | |
|
Fig. B.182. Tapered map with uvtaper = 90kλ. The rms = 13μJy beam−1, the contour levels are at -3, 3 × 2n, n∈ [0, 3], and the beam size is 8.90 × 6.48 kpc. |
| In the text | |
|
Fig. B.183. Tapered map with uvtaper = 60kλ. The rms = 15μJy beam−1, the contour levels are at -3, 3 × 2n, n∈ [0, 3], and the beam size is 11.05 × 9.38 kpc. |
| In the text | |
|
Fig. B.184. Pan-STARRS i band image of the host galaxy overlaid with the 90kλ tapered map. Radio map properties are the same as in Fig. B.182. |
| In the text | |
|
Fig. B.185. Spectral index map. The rms = 16μJy beam−1, the contour levels are at -3, 3 × 2n, n∈ [0, 2], and the beam size is 2.20 × 0.54 kpc. |
| In the text | |
|
Fig. B.186. Spectral index error map. The rms, the contour levels, and the beam size are the same as in Fig. B.185. |
| In the text | |
|
Fig. B.187. Tapered map with uvtaper = 90kλ. The rms = 22μJy beam−1, the contour levels are at -3, 3 × 2n, n∈ [0, 2], and the beam size is 2.90 × 1.62 kpc. |
| In the text | |
|
Fig. B.188. Tapered map with uvtaper = 60kλ. The rms = 22μJy beam−1, the contour levels are at -3, 3, 6, and the beam size is 3.42 × 2.33 kpc. |
| In the text | |
|
Fig. B.189. Pan-STARRS i band image of the host galaxy overlaid with the 90kλ tapered map. Radio map properties are the same as in Fig. B.187. |
| In the text | |
|
Fig. B.190. Spectral index map. The rms = 10μJy beam−1, the contour levels are at -3, 3 × 2n, n∈ [0, 3], and the beam size is 0.53 × 0.33 kpc. |
| In the text | |
|
Fig. B.191. Spectral index error map. The rms, the contour levels, and the beam size are the same as in Fig. B.190. |
| In the text | |
|
Fig. B.192. Tapered map with uvtaper = 90kλ. The rms = 18μJy beam−1, the contour levels are at -3, 3 × 2n, n∈ [0, 3], and the beam size is 1.17 × 1.00 kpc. |
| In the text | |
|
Fig. B.193. Tapered map with uvtaper = 60kλ. The rms = 23μJy beam−1, the contour levels are at -3, 3 × 2n, n∈ [0, 2], and the beam size is 1.66 × 1.40 kpc. |
| In the text | |
|
Fig. B.194. Pan-STARRS i band image of the host galaxy overlaid with the 90kλ tapered map. Radio map properties are the same as in Fig. B.192. |
| In the text | |
|
Fig. B.195. Spectral index map. The rms = 11μJy beam−1, the contour levels are at -3, 3 × 2n, n∈ [0, 2], and the beam size is 0.54 × 0.30 kpc. |
| In the text | |
|
Fig. B.196. Spectral index error map. The rms, the contour levels, and the beam size are the same as in Fig. B.195. |
| In the text | |
|
Fig. B.197. Tapered map with uvtaper = 90kλ. The rms = 15μJy beam−1, the contour levels are at -3, 3 × 2n, n∈ [0, 2], and the beam size is 1.12 × 0.88 kpc. |
| In the text | |
|
Fig. B.198. Tapered map with uvtaper = 60kλ. The rms = 17μJy beam−1, the contour levels are at -3, 3 × 2n, n∈ [0, 2], and the beam size is 1.57 × 1.24 kpc. |
| In the text | |
|
Fig. B.199. Pan-STARRS i band image of the host galaxy overlaid with the 90kλ tapered map. Radio map properties are the same as in Fig. B.197. |
| In the text | |
|
Fig. B.200. Spectral index map. The rms = 11μJy beam−1, the contour levels are at -3, 3 × 2n, n∈ [0, 4], and the beam size is 0.91 × 0.25 kpc. |
| In the text | |
|
Fig. B.201. Spectral index error map. The rms, the contour levels, and the beam size are the same as in Fig. B.200. |
| In the text | |
|
Fig. B.202. Tapered map with uvtaper = 90kλ. The rms = 14μJy beam−1, the contour levels are at -3, 3 × 2n, n∈ [0, 4], and the beam size is 1.26 × 0.79 kpc. |
| In the text | |
|
Fig. B.203. Tapered map with uvtaper = 60kλ. The rms = 16μJy beam−1, the contour levels are at -3, 3 × 2n, n∈ [0, 4], and the beam size is 1.59 × 1.13 kpc. |
| In the text | |
|
Fig. B.204. Pan-STARRS i band image of the host galaxy overlaid with the 90kλ tapered map. Radio map properties are the same as in Fig. B.202. |
| In the text | |
|
Fig. B.205. Spectral index map. The rms = 10μJy beam−1, the contour levels are at -3, 3 × 2n, n∈ [0, 9], and the beam size is 1.60 × 0.84 kpc. |
| In the text | |
|
Fig. B.206. Spectral index error map. The rms, the contour levels, and the beam size are the same as in Fig. B.205. |
| In the text | |
|
Fig. B.207. Tapered map with uvtaper = 90kλ. The rms = 12μJy beam−1, the contour levels are at -3, 3 × 2n, n∈ [0, 9], and the beam size is 3.30 × 2.63 kpc. |
| In the text | |
|
Fig. B.208. Tapered map with uvtaper = 60kλ. The rms = 14μJy beam−1, the contour levels are at -3, 3 × 2n, n∈ [0, 9], and the beam size is 4.69 × 3.74 kpc. |
| In the text | |
|
Fig. B.209. Pan-STARRS i band image of the host galaxy overlaid with the 90kλ tapered map. Radio map properties are the same as in Fig. B.207. |
| In the text | |
|
Fig. B.210. Spectral index map. The rms = 11μJy beam−1, the contour levels are at -3, 3 × 2n, n∈ [0, 9], and the beam size is 0.88 × 0.48 kpc. |
| In the text | |
|
Fig. B.211. Spectral index error map. The rms, the contour levels, and the beam size are the same as in Fig. B.210. |
| In the text | |
|
Fig. B.212. Tapered map with uvtaper = 90kλ. The rms = 17μJy beam−1, the contour levels are at -3, 3 × 2n, n∈ [0, 9], and the beam size is 1.85 × 1.47 kpc. |
| In the text | |
|
Fig. B.213. Tapered map with uvtaper = 60kλ. The rms = 22μJy beam−1, the contour levels are at -3, 3 × 2n, n∈ [0, 9], and the beam size is 2.62 × 2.09 kpc. |
| In the text | |
|
Fig. B.214. Pan-STARRS i band image of the host galaxy overlaid with the 90kλ tapered map. Radio map properties are the same as in Fig. B.212. |
| In the text | |
|
Fig. B.215. Spectral index map. The rms = 10μJy beam−1, the contour levels are at -3, 3 × 2n, n∈ [0, 6], and the beam size is 1.16 × 0.58 kpc. |
| In the text | |
|
Fig. B.216. Spectral index error map. The rms, the contour levels, and the beam size are the same as in Fig. B.215. |
| In the text | |
|
Fig. B.217. Tapered map with uvtaper = 90kλ. The rms = 13μJy beam−1, the contour levels are at -3, 3 × 2n, n∈ [0, 6], and the beam size is 2.45 × 1.87 kpc. |
| In the text | |
|
Fig. B.218. Tapered map with uvtaper = 60kλ. The rms = 15μJy beam−1, the contour levels are at -3, 3 × 2n, n∈ [0, 6], and the beam size is 3.43 × 2.65 kpc. |
| In the text | |
|
Fig. B.219. Pan-STARRS i band image of the host galaxy overlaid with the 90kλ tapered map. Radio map properties are the same as in Fig. B.217. |
| In the text | |
|
Fig. B.220. Spectral index map. The rms = 11μJy beam−1, the contour levels are at -3, 3 × 2n, n∈ [0, 7], and the beam size is 0.27 × 0.24 kpc. |
| In the text | |
|
Fig. B.221. Spectral index error map. The rms, the contour levels, and the beam size are the same as in Fig. B.220. |
| In the text | |
|
Fig. B.222. Tapered map with uvtaper = 90kλ. The rms = 15μJy beam−1, the contour levels are at -3, 3 × 2n, n∈ [0, 7], and the beam size is 0.73 × 0.66 kpc. |
| In the text | |
|
Fig. B.223. Tapered map with uvtaper = 60kλ. The rms = 25μJy beam−1, the contour levels are at -3, 3 × 2n, n∈ [0, 7], and the beam size is 1.06 × 0.92 kpc. |
| In the text | |
|
Fig. B.224. Pan-STARRS i band image of the host galaxy overlaid with the 90kλ tapered map. Radio map properties are the same as in Fig. B.222. |
| In the text | |
|
Fig. B.225. Spectral index map. The rms = 10μJy beam−1, the contour levels are at -3, 3 × 2n, n∈ [0, 7], and the beam size is 1.70 × 1.27 kpc. |
| In the text | |
|
Fig. B.226. Spectral index error map. The rms, the contour levels, and the beam size are the same as in Fig. B.225. |
| In the text | |
|
Fig. B.227. Tapered map with uvtaper = 90kλ. The rms = 14μJy beam−1, the contour levels are at -3, 3 × 2n, n∈ [0, 7], and the beam size is 4.27 × 3.69 kpc. |
| In the text | |
|
Fig. B.228. Tapered map with uvtaper = 60kλ. The rms = 15μJy beam−1, the contour levels are at -3, 3 × 2n, n∈ [0, 7], and the beam size is 6.17 × 5.19 kpc. |
| In the text | |
|
Fig. B.229. Pan-STARRS i band image of the host galaxy overlaid with the 90kλ tapered map. Radio map properties are the same as in Fig. B.227. |
| In the text | |
Current usage metrics show cumulative count of Article Views (full-text article views including HTML views, PDF and ePub downloads, according to the available data) and Abstracts Views on Vision4Press platform.
Data correspond to usage on the plateform after 2015. The current usage metrics is available 48-96 hours after online publication and is updated daily on week days.
Initial download of the metrics may take a while.