Fig. 6.
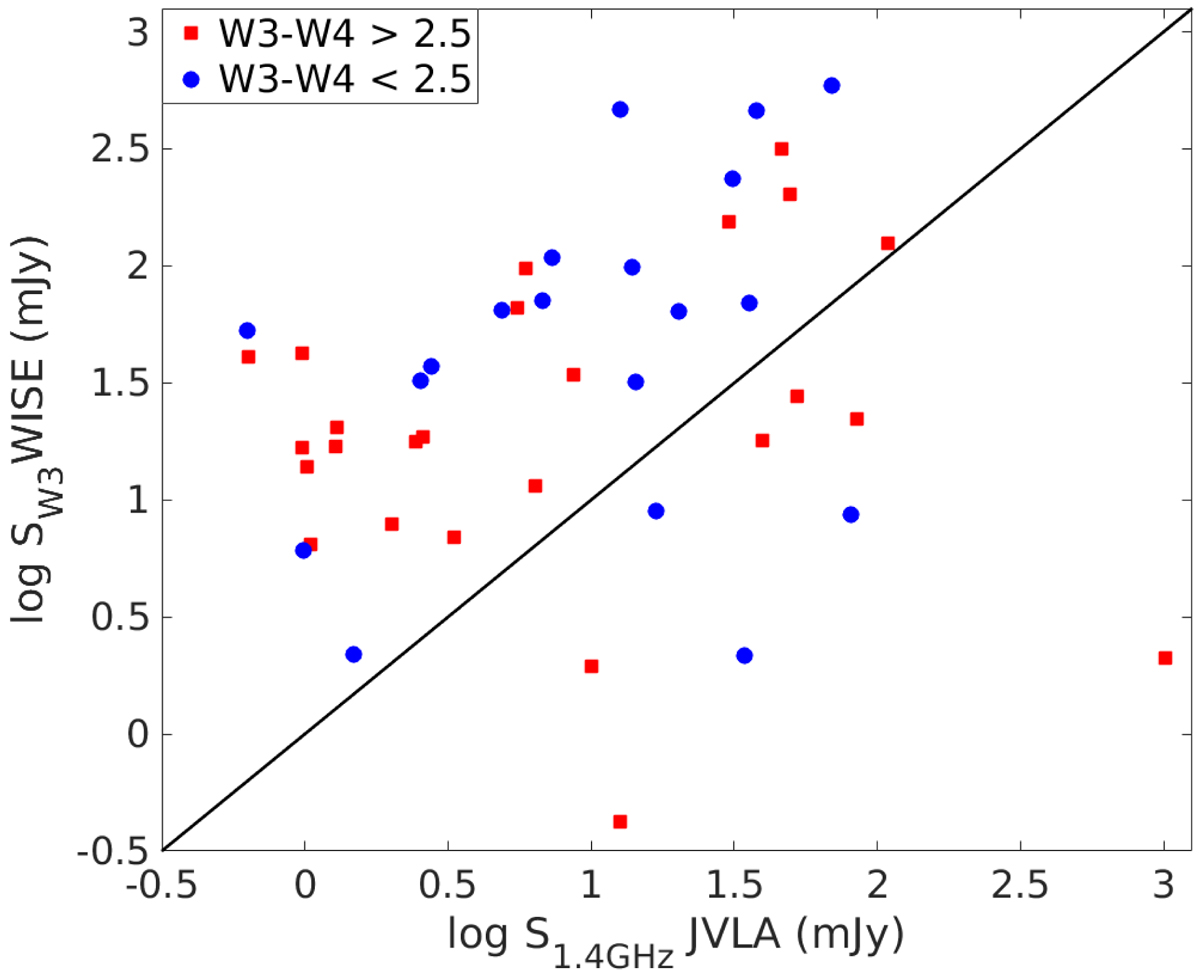
Download original image
WISE W3 flux densities vs. JVLA 1.4 GHz flux densities extrapolated from the 5.2 GHz flux densities using the total spectral indices from the α maps. The error bars of the flux densities are smaller than the size of the markers and are not shown. Sources with the WISE W3–W4 colour > 2.5, that is, sources that are unusually red and most likely to have enhanced star formation, are shown with filled red squares, and sources with the WISE W3–W4 colour < 2.5, that is, sources that are not unusually red, as filled blue circles. The black line denotes equal flux densities. Sources above the black line should have more contribution from star formation, whereas the sources below the black line should be dominated by AGN activity.
Current usage metrics show cumulative count of Article Views (full-text article views including HTML views, PDF and ePub downloads, according to the available data) and Abstracts Views on Vision4Press platform.
Data correspond to usage on the plateform after 2015. The current usage metrics is available 48-96 hours after online publication and is updated daily on week days.
Initial download of the metrics may take a while.