Free Access
Fig. 1.
Download original image
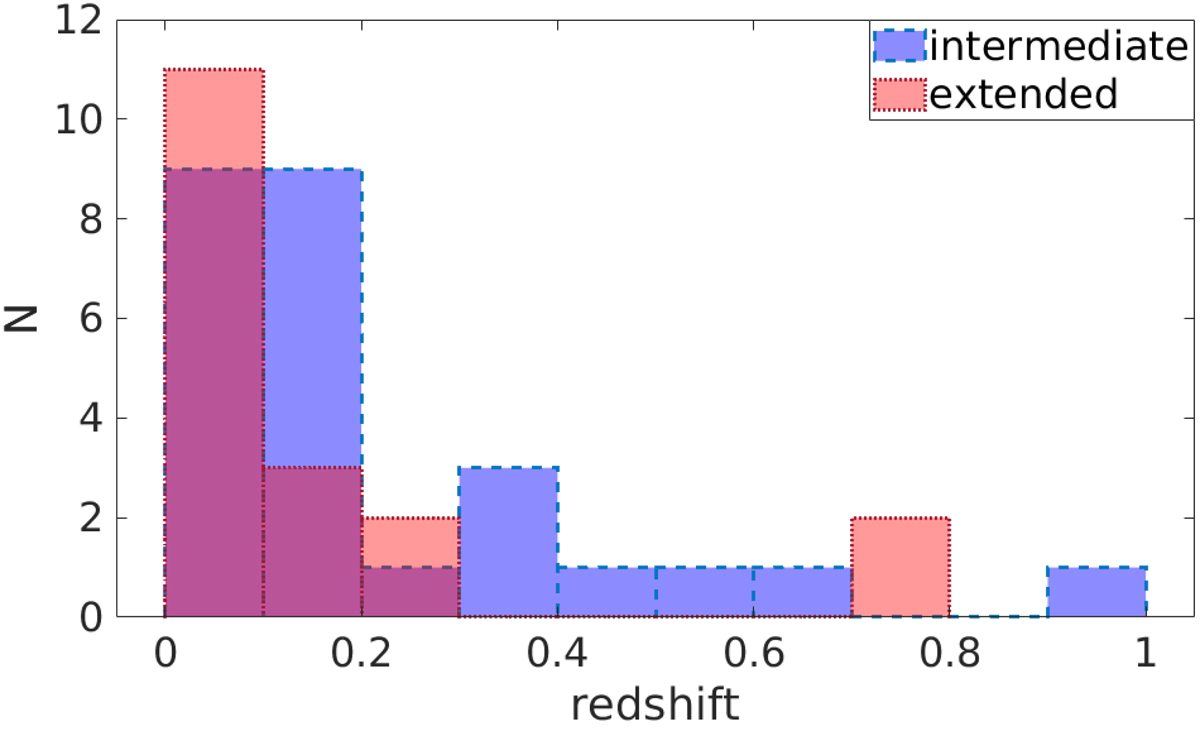
Redshift distribution of our sample, divided based on the radio morphology classification. Sources with intermediate radio morphology are marked in blue with a dashed edge line, and sources with extended radio morphology are marked in red with a dotted edge line.
Current usage metrics show cumulative count of Article Views (full-text article views including HTML views, PDF and ePub downloads, according to the available data) and Abstracts Views on Vision4Press platform.
Data correspond to usage on the plateform after 2015. The current usage metrics is available 48-96 hours after online publication and is updated daily on week days.
Initial download of the metrics may take a while.