| Issue |
A&A
Volume 657, January 2022
|
|
|---|---|---|
| Article Number | L10 | |
| Number of page(s) | 6 | |
| Section | Letters to the Editor | |
| DOI | https://doi.org/10.1051/0004-6361/202142477 | |
| Published online | 11 January 2022 | |
Letter to the Editor
Hidden in plain sight: UVIT and MUSE discovery of a large, diffuse star-forming galaxy
1
Indian Institute of Astrophysics, Koramangala II Block, Bangalore 560034, India
e-mail: This email address is being protected from spambots. You need JavaScript enabled to view it.
2
Pondicherry University, R.V. Nagar, Kalapet, 605014 Puducherry, India
3
Observatoire de Paris, LERMA, College de France, CNRS, PSL University, Sorbonne University, 75014 Paris, France
Received:
19
October
2021
Accepted:
22
December
2021
Abstract
We report the discovery of a nearby large, diffuse galaxy that shows star formation using Ultra Violet Imaging Telescope (UVIT) far-UV observations and archival optical data from Multi-Unit Spectroscopic Explorer (MUSE), Dark Energy Camera Legacy Survey, and InfraRed Survey Facility near-infrared observations. The galaxy was not detected earlier due to its superposition with the background galaxy NGC 6902A. They were together mistakenly classified as an interacting system. NGC 6902A is at a redshift of 0.05554, but MUSE observations indicate that the interacting tail is a separate star-forming foreground galaxy at a redshift of 0.00980. We refer to the new galaxy as UVIT J202258.73–441623.8 (UVIT J2022). The near-infrared observations show that UVIT J2022 has a stellar mass of 8.7 × 10⁸ M⊙. Its inner disk (R < 4 kpc) shows UV and Hα emission from ongoing massive star formation. The rest of the disk is extremely low in luminosity, has a low stellar surface density, and extends out to a radius of R ∼ 9 kpc. The velocity and metallicity distribution maps and the star formation history indicate that UVIT J2022 has undergone three bursts of star formation. The latest episode is ongoing, which is supported by the presence of widespread Hα and UV emission in its inner disk. The galaxy also shows patchy spiral arms in the far UV, and there is a metallicity enhancement along a bar-like feature. UVIT J2022 is thus a unique example of triggered star formation in a diffuse galaxy resulting in the growth of its inner stellar disk. Our study raises the intriguing possibilities that (i) there could be similar diffuse galaxies that have been mistakenly interpreted as interacting galaxies due to their superposition, and (ii) UV or Hα emission could be a way to detect such diffuse galaxies in our local universe.
Key words: galaxies: interactions / galaxies: star formation / techniques: imaging spectroscopy / galaxies: individual: J202258.73–441623.8 / galaxies: individual: NGC 6902A
© ESO 2022
1. Introduction
Low surface brightness galaxies (LSBGs) are defined as galaxies with very diffuse stellar disks that have central surface brightnesses in the B band (μB) fainter than 23 mag arcsec−2 (Impey & Bothun 1997). However, in the past decade, several deep optical surveys have detected LSBGs down to much lower faintness levels of 26 mag arcsec−2 in the r band (Venhola et al. 2018; Lim et al. 2020). The extremely faint and extended LSBGs are called ultra-diffuse galaxies (UDGs). Although the criteria vary in the literature, in general, UDGs have a central g band (μg(0)) surface brightness fainter than 24 mag arcsec−2 and an effective radius larger than 1.5 kpc (van Dokkum et al. 2015). They are classified as either blue (gas-rich) or red (gas-poor) UDGs. The gas-rich UDGs are present in the outskirts of galaxy groups. In contrast, the gas-poor UDGs are found in clusters, which suggests that the environmental processes are dominating (Leisman et al. 2017; Prole et al. 2019). These galaxies make up the tail end of the luminosity function (Koda et al. 2015) and may extend down to much lower levels than we would expect (Fattahi et al. 2020). The common unifying factor for all LSBGs and UDGs is that they have diffuse stellar disks, that is, their disks appear to have low stellar surface densities (Sales et al. 2020), which can be connected to low star formation rates (Rong et al. 2020). Although LSBGs are historically considered to be gas-rich (Honey et al. 2018), UDGs may or may not contain gas (Leisman et al. 2017; Chowdhury 2019).
Another class of galaxies that have very low stellar density disks are the extended ultraviolet (XUV) disk galaxies, which show star formation in their extreme outer disks, where both stellar densities and metallicities are very low (Yadav et al. 2021a). The star formation in these adverse environments may have been triggered by gas inflow from nearby galaxies or cold gas accretion from the cosmic web (Sancisi et al. 2008). Taking this as an example, it is possible that UV or Hα emission from compact star-forming complexes (SFCs) in diffuse galaxies could be one of the ways to detect LSBGs or blue UDGs that may otherwise go unnoticed in larger surveys. Ultraviolet emission is especially important because it traces young O, B stars for 108 years, whereas Hα emission is produced by photoionization from massive stars (M > 10 M⊙) and is sensitive to star formation for only 106 to 107 years (Das et al. 2021). Star formation is, however, difficult in low-density disks as the disk self-gravity is low. Therefore, triggers such as galaxy interactions and flybys are important, as shown in semi-analytical simulations (Somerville et al. 2001; Menci et al. 2005). This Letter reports the serendipitous discovery of a nearby diffuse galaxy that shows intense star formation in its inner disk using Ultra Violet Imaging Telescope (UVIT) and Multi-Unit Spectroscopic Explorer (MUSE) data. It is part of a larger study of star formation in a sample of southern interacting galaxies. This new galaxy lies in the foreground of NGC 6902A, which, as shown in this Letter, had been mistakenly classified as an interacting galaxy. The following sections describe our results and their implications for detecting LSBGs in our nearby universe. We have used flat cosmology with ΩΛ = 0.7, ΩM = 0.3, and H0 = 70 km s−1 Mpc−1.
2. Observations
2.1. Imaging data
We observed NGC 6902A using the UVIT on board Astrosat (Kumar et al. 2012). The UVIT has two telescopes, one for the far ultraviolet (FUV; 1300–1800 Å) and another for the near ultraviolet (NUV; 2000–3000 Å). The UVIT has a field of view of 28′ and spatial resolution of ∼1″. The FUV observations were done in the F148W band (1231–1731 Å). We reduced the UVIT level 1 data using CCDLAB (Postma & Leahy 2017, 2020).
We used archival g, r, and z band data from the Dark Energy Camera Legacy Survey (DECaLS). DECaLS uses the Dark Energy Camera (DECam; Flaugher et al. 2015) mounted on the Victor M. Blanco telescope at the Cerro Tololo Inter-American Observatory (CTIO). DECam has 62 charge-coupled devices with a 2048 × 4096 pixel format each for imaging. It has a field of view of 2.2° in diameter and a pixel scale of 0.262 arcsec pixel−1. DECam can achieve 5σ depth in total exposure times of 166, 134, and 200 s in the g, r, and z bands for an emission line galaxy with a half-light radius of 0.45″.
The near-infrared observations of NGC 6902A were carried out using the SIRIUS camera (Nagayama et al. 2003) on the InfraRed Survey Facility (IRSF) 1.4 m telescope at South African Astronomical Observatory (SAAO) in Sutherland, South Africa. The SIRIUS camera performs simultaneous imaging in the JHK bands. It has a field of view of 7.7′ × 7.7′ (Nagayama 2012). The exposure time of the images is ∼120 min, and they were taken in automatic dithering mode with ∼20″ steps with individual frame exposure times of 30 seconds each. We used the pipeline available for the SIRIUS observations to reduce the data, including corrections for non-linearity, dark subtraction, and flat fielding.
2.2. Integral field unit data
We used MUSE archival data (Bacon et al. 2010). MUSE gives 3D spectroscopic data cubes with high resolution. We used the data from the wide-field mode, which has a field of view of 1′ × 1′ and a spectral resolution of 1750 at 4650 Å to 3750 at 9300 Å. We used the Galaxy IFU Spectroscopy Tool (GIST1 version 3.0.3; Bittner et al. 2019) pipeline to study the properties of UVIT J2022. GIST uses a python-implemented version of GANDALF (Sarzi et al. 2006; Falcón-Barroso et al. 2006; Bittner et al. 2019) and penalized pixel-fitting (pPXF; Cappellari & Emsellem 2004; Cappellari 2017) to provide emission-line properties and stellar kinematics, respectively. We Voronoi-binned the data based on Hα (6558−6568 Å) emission. We used a signal-to-noise ratio (S/N) of 30 for binning the data. We fitted the continuum using a multiplicative eighth-order Legendre polynomial. We removed noisy data that had a S/N of less than 5 before binning the data.
3. Results
The left panel of Fig. 1 shows the DECaLS grz colour image for NGC 6902A, which is classified as an interacting galaxy (de Vaucouleurs et al. 1991a). The south-west outer region of NGC 6902A in the DECaLS colour image shows diffuse blue emission. This south-western region shows prominent SFCs in the FUV image and corresponds to strong Hα emission from the MUSE cube, as shown in the right panel of Fig. 1. NGC 6902A is bright in the K band image, and the disk appears extended in the south-west. However, there is only faint FUV emission and almost no Hα emission from NGC 6902A at the rest-frame wavelength.
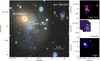 |
Fig. 1. Multi-wavelength images of UVIT J2022. The grz image shows the background galaxy, NGC 6902A, and the foreground galaxy, UVIT J2022. Star-forming regions in UVIT J2022 are prominent in FUV and Hα. The K band image reveals the emission from old stars in NGC 6902A. The + and × symbols in red indicate the kinematic centre of UVIT J2022 and NGC 6902A, respectively. |
This prompted us to investigate the peculiar feature in more detail to determine the cause of the interactions and to understand if this feature is the remnant of another galaxy that went through a merger with NGC 6902A. To do so, we used Hβ, [O III], Hα, and [N II] lines of various SFCs in this region for redshift estimation. The mean redshift calculated from the emission lines for these SFCs is z = 0.00980 ± 0.00018, whereas the redshift of NGC 6902A is z = 0.05554 (da Costa et al. 1991). This means that the diffuse blue emission was, in fact, from a foreground galaxy, which we discovered using FUV, MUSE, and K band data. We have named it UVIT J202258.73–441623.8 (hereafter referred to as UVIT J2022). In the following sections, we described the detailed study we carried out to establish the characteristics and morphology of UVIT J2022.
3.1. Neutral gas content, gas kinematics, and metallicity
To determine the gas content of UVIT J2022, we looked for neutral gas line emission (HI) in the HI Parkes All Sky Survey (HIPASS) database using the location of UVIT J2022 and the appropriate redshift. We found some weak emission associated with the galaxy at an approximate velocity of vsys = 2930 km s−1. The flux value is ∼0.032 Jy beam−1. Since the HIPASS beam is quite large (∼15.5′) and the diameter of UVIT J2022 is ∼1.5′, we can safely assume that all the HI emission lies within the beam. The neutral gas mass, including the contribution from HI gas and helium, is given by  , where DMpc is the distance in Mpc to UVIT J2022, Sν is the flux in Jy, and ΔV is the width of the line, ∼100 km s−1. Excluding the contribution of helium, the HI gas mass is M(HI) = 1.32 × 10⁹ M⊙.
UVIT J2022 is much brighter in Hα than the old stellar disk, which is faint and diffuse in the IRSF K band image. We used Hα to derive the velocity field of this galaxy. Figure 2a shows the Hα velocity map of the galaxy. It indicates galactic rotation with a velocity range of ∼−20 to 20 km s−1. The smaller range in velocity could be due to the face-on orientation of the galaxy.
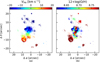 |
Fig. 2. Velocity and metallicity map of UVIT J2022. Panels a and b: Hα velocity map and metallicity map, respectively. The maps show the bins with an amplitude-to-noise ratio of more than 4 in the Hβ, [O III], Hα, and [N II] lines. The origin (0,0) in the maps are the coordinates of Table 1. |
Details of UVIT J2022.
Figure 2b shows the metallicity map of UVIT J2022 derived using the following equation from Pettini & Pagel (2004):
![Mathematical equation: $$ \begin{aligned} 12 + \log (\mathrm{O/H}) = 8.73{-}0.32 \times \log [([{\text{ O}}{\small {{\text{III}}}}]/\mathrm{H}\beta )/([{\text{ N}}{\small {{\text{ II}}}}]/\mathrm{H}\alpha )]. \end{aligned} $$](/articles/aa/full_html/2022/01/aa42477-21/aa42477-21-eq2.gif) (1)
(1)
The metallicity map shows that the galaxy has a higher metallicity along the north-west to south-east direction, which could be due to a small bar-like feature in the stellar disk of UVIT J2022. The SFCs at the edges of the bar also show higher metallicity. Bars are known to funnel gas from the outer to the inner disks, leading to star formation and thus enhancing the inner disk metallicities of galaxies (Combes et al. 2014). The F148W and Hα images also show bright SFCs along and at the edges of the bar.
3.2. Decomposition using GALFIT
We used GALFIT (Peng et al. 2002) to perform the 2D decomposition of NGC 6902A and UVIT J2022 in the r band. Although we did have IRSF K band data, the diffuse nature of the stellar disk made it difficult to quantify the disk properties with good S/N; hence, we used the r band image instead. A good fit was obtained by fitting three Sersic functions to NGC 6902A and two Sersic functions to the foreground galaxy UVIT J2022. The best fit was used to obtain models for both galaxies, and they are shown in Fig. 3. We found that the effective radius, re, of the first Sersic profile in the r band is 7.57 kpc, which probably corresponds to a large diffuse disk. The effective radius for the second Sersic profile in the r band is 2.35 kpc, corresponding to a central stellar bar. However, the bar is not visible in the K band image, which may be due to its diffuse nature. The central disk brightness for the outer diffuse disk in the r band is μ0(r) = 20.13 mag arcsec−2, after correcting for inclination and cosmological dimming. However, there may be contamination due to background galaxy NGC 6902A.
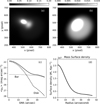 |
Fig. 3. GALFIT decomposition of NGC 6902A and UVIT J2022. Panel a: model obtained from the fitting of NGC 6902A and UVIT J2022 with the 3+2 Sersic component in the r band. Panel b: model image of UVIT J2022. The size scale is the same in panels a and b. However, the grayscale in panel b is different to show the extent of UVIT J2022. Panel c: total model average surface brightness profile of UVIT J2022 in the r band, obtained from GALFIT (solid curve). The dotted and dashed curves show the Sersic profiles for the inner central bar-like structure and disk component, respectively. Panel d: surface density of UVIT J2022. |
To understand the stellar disk in more detail, we used the surface brightness profile (i.e. the magnitude arcsec2 in the z band) to derive the mass density. The mass-to-light ratio assumed for the z band was M/L = 1.4 (Du & McGaugh 2020), which gives a total stellar mass of M(*) = 8.72 × 10⁸ M⊙. Using this stellar mass M(*) in the mass-metallicity relation (Tremonti et al. 2004), the metallicity of UVIT J2022 is ∼8.6 ± 0.1 dex, which is consistent with the metallicity obtained from Eq. (1). The central region shows higher metallicity, possibly because of star formation triggered by the accumulation of gas funnelled from the outer disk into the inner region by the bar. Using the baryonic Tully–Fisher relation (McGaugh et al. 2000), the disk rotation velocity is 86 km s−1. We found the inclination of UVIT J2022 to be around 13° using
 (2)
(2)
where VOBS and VROT are the observed and actual rotation velocity of the galaxy and i represents the inclination of the galaxy.
The mass surface density is shown in panel d of Fig. 3. The inner disk has a stellar mass surface density of Σ(*)≈0.5 to 2.5 × 10⁷ M⊙ kpc−2, whereas the outer disk has Σ(*)≤4 × 10⁶ M⊙ kpc−2. The inner disk extends out to ∼20″, or 4 kpc, and the outer disk extends out to ∼45″, or 9.1 kpc. It is not surprising that only the inner disk shows star formation, as the outer disk is too diffuse and probably does not have enough disk gravity for gas to condense and form stars.
3.3. Star formation history and star formation rate in UV and Hα
Figure 4a shows the star formation history of the galaxy derived from GIST. The galaxy has gone through three bursts of star formation, separated by a few gigayears each. The latest episode of star formation is ongoing in this galaxy; this is evident from the UV and Hα images, which reveal the SFCs. We extracted the SFCs from the FUV F148W and Hα images using the Python library for Source Extraction and Photometry (SEXTRACTOR; Bertin & Arnouts 1996). We used a detection threshold of 5σ, where σ is the global background noise. We detected 15 SFCs in the FUV and 27 SFCs in the Hα, respectively. The number of detected FUV SFCs is lower because the FUV observations are not as deep as the Hα observations, so the fainter SFCs in the Hα may have been missed in the FUV. The spatial resolution of the MUSE Hα image is also higher than that of the UVIT FUV image.
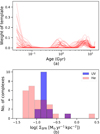 |
Fig. 4. SFH and SFR of UVIT J2022. Top panel: fraction of the stellar light that originates from a stellar population as a function of age. The curves represent individual bins from Sect. 2.2. Bottom panel: histograms of log(ΣSFR) of identified SFCs in UV and Hα. |
We calculated the star formation rate per unit area (ΣSFR) for each of the identified SFCs by performing elliptical aperture photometry on the identified sources using PHOTUTILS, a python ASTROPY package for photometry. We calculated the ΣSFR of each SFC from FUV emission using the method laid out in Salim et al. (2007, see Yadav et al. 2021a for more details) and Hα using that in Calzetti et al. (2007). Figures 4a and b show the star formation history and ΣSFR for the FUV and Hα of UVIT J2022, respectively. The mean log(ΣSFR (M⊙ yr−1 kpc−2)) estimated for UVIT J2022 from the FUV and Hα are −0.74 and −0.68, which is higher than in the XUV regions in galaxies as estimated by Thilker et al. (2007).
4. Discussion
We present the serendipitous discovery of a star-forming galaxy, UVIT J2022, at a redshift of 0.00980 ± 0.00018 (D ≈ 41.86 Mpc), which lies in the foreground of NGC 6902A (z = 0.05554 ± 0.00010, D = 253 Mpc; da Costa et al. 1991). The two had previously been classified as an interacting system (de Vaucouleurs et al. 1991a). However, the MUSE data clearly show that both galaxies are at different redshifts and are not interacting with each other.
NGC 6902A shows signatures of a small perturbation of old stars towards the south-west region in the K band. A few galaxies in the field have similar photometric redshifts, so the perturbed region could be due to a past dry merger. NGC 6902A is morphologically classified as SB(s)m pec in the de Vaucouleurs et al. (1991b) catalogue, and one of the Sersic functions used in our GALFIT decomposition represents a bar, thus confirming the de Vaucouleurs et al. (1991b) catalogue morphology.
Our detection of UVIT J2022 shows that diffuse star-forming galaxies can be missed in surveys but can be detected in UV and Hα observations, so the latter are very important for discovering diffuse LSBGs or UDGs at low redshifts. This is similar to the discovery of XUV disks via UV observations (Thilker et al. 2007). Also, spectroscopic observations are very important for avoiding projection bias and for detecting new galaxies (Yadav et al. 2021b).
The star formation history (Fig. 4) of UVIT J2022 shows that the galaxy has gone through two previous bursts of star formation, and the ongoing third burst is very prominent in the UV and Hα. The bottom panel of Fig. 4 shows that the star formation rate of the extracted SFCs has similar mean values for FUV and Hα emission. UVIT J2022 also has spiral arms and a bar. Figure 2 shows that the spiral arm and bar in UVIT J2022 have enhanced metallicity. There is also higher metallicity in the outer disk than in the inner disk. The metal-enriched gas will increase gas cooling and can lead to further star formation in the central region (Martel et al. 2013), contributing to the buildup of the inner disk. The star formation history (Fig. 4) shows that UVIT J2022 is currently in the phase of rising star formation, so we expect the galaxy to become more luminous. Thus, UVIT J2022 is an example of a diffuse LSBG transforming into a luminous galaxy.
The central disk brightness for the outer diffuse disk in the r band is close to the LSBG cutoff of μ0(r) = 21 mag arcsec−2 (Brown et al. 2001). Hence, although the inner disk is star-forming, the outer disk is diffuse and similar to an LSBG in nature. The effective radius of UVIT J2022 in the r band is 7.57 kpc with a Sersic index of 0.52, which is shallower than exponential decline (n = 1) and similar to spiral galaxies. The Σ(*) of the inner disk is similar to that of the outer disks of XUV galaxies (Das et al. 2020), whereas the Σ(*) of the outer disk is similar to that of dwarf LSBGs. The central surface brightness of UVIT J2022 is close to the limiting value for LSBGs (see Sect. 3.2), which are known to be dark-matter-dominated galaxies (de Blok & McGaugh 1997). However, determining the dark matter mass of UVIT J2022 is difficult because the galaxy is close to face-on. Therefore, the HI line width or Hα velocity field will not give an accurate estimate of the disk rotation velocity. Future deep observations of the HI distribution can perhaps reveal something about the dark matter content. Thus, we conclude that UVIT J2022 is a diffuse, gas-rich LSBG in the process of disk growth via star formation in its inner disk. Its detection raises the possibility of finding similar diffuse systems at low redshifts using star formation tracers such as UV and Hα. It also raises the intriguing question of how star formation is supported in such diffuse disks and whether disk dark matter may be playing a role (Das et al. 2020).
5. Conclusions
This Letter presents the serendipitous discovery of a star-forming galaxy, UVIT J2022, at a redshift of 0.00980 ± 0.00018 lying in the foreground of NGC 6902A, which had mistakenly been classified as an interacting galaxy. Based on a detailed study using UVIT, DECaLS, and MUSE data, the following conclusions are inferred:
-
UVIT J2022 shows ongoing star formation in the UV and Hα. It also shows a spiral arm and a bar-like feature.
-
The mean log(ΣSFR (M⊙ yr−1 kpc−2)) of UVIT J2022 in the FUV and Hα is −0.74 and −0.68, respectively.
-
UVIT J2022 has gone through three starburst phases, and the latest episode of star formation is ongoing.
-
The large outer, diffuse disk is low in surface brightness and has a low stellar density. So this galaxy is an example of a galaxy with an extended outer low surface brightness disk that is transforming into a luminous galaxy.
The discovery of a new foreground galaxy that was mistaken as a tidal feature of a bright background galaxy using powerful instruments such as UVIT and MUSE thus opens a gateway to searching for similar cases, where blue diffuse tidal features in interacting galaxies may not be the remnant of a merger but instead a separate foreground and/or background galaxy. It also shows the power of using star formation tracers such as FUV and Hα emission to detect diffuse galaxies.
Acknowledgments
We thank the anonymous referee for the thoughtful review, which improved the impact and clarity of this work. This Letter has used the data from the UVIT, which is part of the AstroSat mission of the Indian Space Research Organization (ISRO), archived at the Indian Space Science Data Center (ISSDC). This publication has also used near-infrared data from IRSF at SAAO. This Letter has also used the observations collected at the European Southern Observatory under ESO programme 0103.A-0637, run B. This research has also used data from DECaLS at CTIO. This publication has used the NASA/IPAC Extragalactic Database (NED), which is operated by the Jet Propulsion Laboratory, California Institute of Technology, under contract with the National Aeronautics and Space Administration. M.D. acknowledges the support of the Science and Engineering Research Board (SERB) MATRICS grant MTR/2020/000266 for this research.
References
- Bacon, R., Accardo, M., Adjali, L., et al. 2010, in Ground-based and Airborne Instrumentation for Astronomy III, eds. I. S. McLean, S. K. Ramsay, & H. Takami (SPIE), Proc. SPIE, 7735, 773508 [Google Scholar]
- Bertin, E., & Arnouts, S. 1996, A&AS, 117, 393 [NASA ADS] [CrossRef] [EDP Sciences] [Google Scholar]
- Bittner, A., Falcón-Barroso, J., Nedelchev, B., et al. 2019, A&A, 628, A117 [NASA ADS] [CrossRef] [EDP Sciences] [Google Scholar]
- Brown, W. R., Geller, M. J., Fabricant, D. G., & Kurtz, M. J. 2001, AJ, 122, 714 [NASA ADS] [CrossRef] [Google Scholar]
- Calzetti, D., Kennicutt, R. C., Engelbracht, C. W., et al. 2007, ApJ, 666, 870 [Google Scholar]
- Cappellari, M. 2017, MNRAS, 466, 798 [Google Scholar]
- Cappellari, M., & Emsellem, E. 2004, PASP, 116, 138 [Google Scholar]
- Chowdhury, A. 2019, MNRAS, 482, L99 [NASA ADS] [CrossRef] [Google Scholar]
- Combes, F., García-Burillo, S., Casasola, V., et al. 2014, A&A, 565, A97 [NASA ADS] [CrossRef] [EDP Sciences] [Google Scholar]
- da Costa, L. N., Pellegrini, P. S., Davis, M., et al. 1991, ApJS, 75, 935 [NASA ADS] [CrossRef] [Google Scholar]
- Das, M., McGaugh, S. S., Ianjamasimanana, R., Schombert, J., & Dwarakanath, K. S. 2020, ApJ, 889, 10 [Google Scholar]
- Das, M., Yadav, J., Patra, N., et al. 2021, JApA, 42, 85 [NASA ADS] [Google Scholar]
- de Blok, W. J. G., & McGaugh, S. S. 1997, MNRAS, 290, 533 [NASA ADS] [CrossRef] [Google Scholar]
- de Vaucouleurs, G., de Vaucouleurs, A., Corwin, H. G., Jr., et al. 1991a, Third Reference Catalogue of Bright Galaxies [Google Scholar]
- de Vaucouleurs, G., de Vaucouleurs, A., Corwin, H. G., Jr., et al. 1991b, Sky and Telesc., 82, 621 [NASA ADS] [Google Scholar]
- Du, W., & McGaugh, S. S. 2020, AJ, 160, 122 [Google Scholar]
- Falcón-Barroso, J., Bacon, R., Bureau, M., et al. 2006, MNRAS, 369, 529 [Google Scholar]
- Fattahi, A., Navarro, J. F., & Frenk, C. S. 2020, MNRAS, 493, 2596 [NASA ADS] [CrossRef] [Google Scholar]
- Flaugher, B., Diehl, H. T., Honscheid, K., et al. 2015, AJ, 150, 150 [Google Scholar]
- Honey, M., van Driel, W., Das, M., & Martin, J. M. 2018, MNRAS, 476, 4488 [NASA ADS] [CrossRef] [Google Scholar]
- Impey, C., & Bothun, G. 1997, ARA&A, 35, 267 [NASA ADS] [CrossRef] [Google Scholar]
- Koda, J., Yagi, M., Yamanoi, H., & Komiyama, Y. 2015, ApJ, 807, L2 [NASA ADS] [CrossRef] [Google Scholar]
- Kumar, A., Ghosh, S. K., Hutchings, J., et al. 2012, in Space Telescopes and Instrumentation 2012: Ultraviolet to Gamma Ray, eds. T. Takahashi, S. S. Murray, & J. W. A. den Herder, SPIE Conf. Ser., 8443, 84431N [Google Scholar]
- Leisman, L., Haynes, M. P., Janowiecki, S., et al. 2017, ApJ, 842, 133 [NASA ADS] [CrossRef] [Google Scholar]
- Lim, S., Côté, P., Peng, E. W., et al. 2020, ApJ, 899, 69 [CrossRef] [Google Scholar]
- Martel, H., Kawata, D., & Ellison, S. L. 2013, MNRAS, 431, 2560 [Google Scholar]
- McGaugh, S. S., Schombert, J. M., Bothun, G. D., & de Blok, W. J. G. 2000, ApJ, 533, L99 [Google Scholar]
- Menci, N., Fontana, A., Giallongo, E., & Salimbeni, S. 2005, ApJ, 632, 49 [NASA ADS] [CrossRef] [Google Scholar]
- Nagayama, T. 2012, African Skies, 16, 98 [Google Scholar]
- Nagayama, T., Nagashima, C., Nakajima, Y., et al. 2003, in Instrument Design and Performance for Optical/Infrared Ground-based Telescopes, eds. M. Iye, & A. F. M. Moorwood, SPIE Conf. Ser., 4841, 459 [Google Scholar]
- Peng, C. Y., Ho, L. C., Impey, C. D., & Rix, H.-W. 2002, AJ, 124, 266 [Google Scholar]
- Pettini, M., & Pagel, B. E. J. 2004, MNRAS, 348, L59 [NASA ADS] [CrossRef] [Google Scholar]
- Postma, J. E., & Leahy, D. 2017, PASP, 129, 115002 [Google Scholar]
- Postma, J. E., & Leahy, D. 2020, PASP, 132, 054503 [Google Scholar]
- Prole, D. J., van der Burg, R. F. J., Hilker, M., & Davies, J. I. 2019, MNRAS, 488, 2143 [NASA ADS] [Google Scholar]
- Rong, Y., Zhu, K., Johnston, E. J., et al. 2020, ApJ, 899, L12 [CrossRef] [Google Scholar]
- Sales, L. V., Navarro, J. F., Peñafiel, L., et al. 2020, MNRAS, 494, 1848 [Google Scholar]
- Salim, S., Rich, R. M., Charlot, S., et al. 2007, ApJS, 173, 267 [NASA ADS] [CrossRef] [Google Scholar]
- Sancisi, R., Fraternali, F., Oosterloo, T., & van der Hulst, T. 2008, A&ARv, 15, 189 [NASA ADS] [CrossRef] [Google Scholar]
- Sarzi, M., Falcón-Barroso, J., Davies, R. L., et al. 2006, MNRAS, 366, 1151 [Google Scholar]
- Somerville, R. S., Primack, J. R., & Faber, S. M. 2001, MNRAS, 320, 504 [NASA ADS] [CrossRef] [Google Scholar]
- Thilker, D. A., Bianchi, L., Meurer, G., et al. 2007, ApJS, 173, 538 [Google Scholar]
- Tremonti, C. A., Heckman, T. M., Kauffmann, G., et al. 2004, ApJ, 613, 898 [Google Scholar]
- van Dokkum, P. G., Abraham, R., Merritt, A., et al. 2015, ApJ, 798, L45 [NASA ADS] [CrossRef] [Google Scholar]
- Venhola, A., Peletier, R., Laurikainen, E., et al. 2018, A&A, 620, A165 [NASA ADS] [CrossRef] [EDP Sciences] [Google Scholar]
- Yadav, J., Das, M., Patra, N. N., et al. 2021a, ApJ, 914, 54 [Google Scholar]
- Yadav, J., Das, M., Barway, S., & Combes, F. 2021b, A&A, 651, L9 [NASA ADS] [CrossRef] [EDP Sciences] [Google Scholar]
All Tables
All Figures
|
Fig. 1. Multi-wavelength images of UVIT J2022. The grz image shows the background galaxy, NGC 6902A, and the foreground galaxy, UVIT J2022. Star-forming regions in UVIT J2022 are prominent in FUV and Hα. The K band image reveals the emission from old stars in NGC 6902A. The + and × symbols in red indicate the kinematic centre of UVIT J2022 and NGC 6902A, respectively. |
| In the text | |
|
Fig. 2. Velocity and metallicity map of UVIT J2022. Panels a and b: Hα velocity map and metallicity map, respectively. The maps show the bins with an amplitude-to-noise ratio of more than 4 in the Hβ, [O III], Hα, and [N II] lines. The origin (0,0) in the maps are the coordinates of Table 1. |
| In the text | |
|
Fig. 3. GALFIT decomposition of NGC 6902A and UVIT J2022. Panel a: model obtained from the fitting of NGC 6902A and UVIT J2022 with the 3+2 Sersic component in the r band. Panel b: model image of UVIT J2022. The size scale is the same in panels a and b. However, the grayscale in panel b is different to show the extent of UVIT J2022. Panel c: total model average surface brightness profile of UVIT J2022 in the r band, obtained from GALFIT (solid curve). The dotted and dashed curves show the Sersic profiles for the inner central bar-like structure and disk component, respectively. Panel d: surface density of UVIT J2022. |
| In the text | |
|
Fig. 4. SFH and SFR of UVIT J2022. Top panel: fraction of the stellar light that originates from a stellar population as a function of age. The curves represent individual bins from Sect. 2.2. Bottom panel: histograms of log(ΣSFR) of identified SFCs in UV and Hα. |
| In the text | |
Current usage metrics show cumulative count of Article Views (full-text article views including HTML views, PDF and ePub downloads, according to the available data) and Abstracts Views on Vision4Press platform.
Data correspond to usage on the plateform after 2015. The current usage metrics is available 48-96 hours after online publication and is updated daily on week days.
Initial download of the metrics may take a while.