Free Access
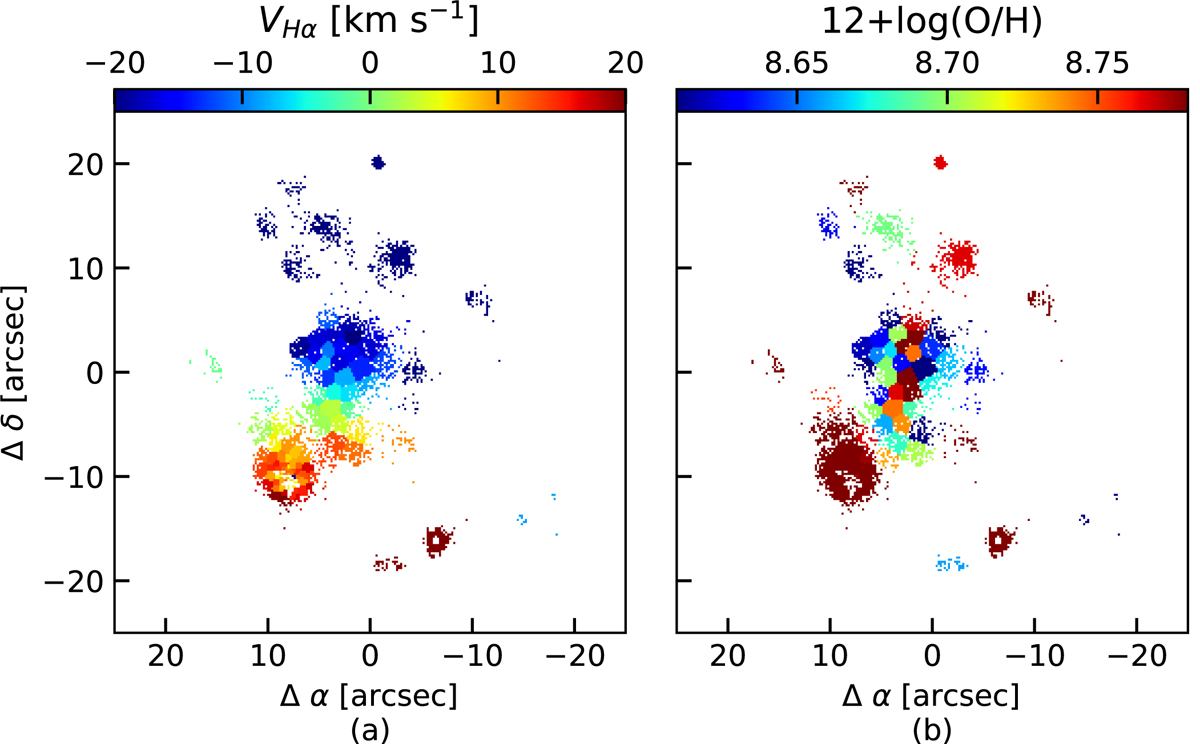
Fig. 2.
Download original image
Velocity and metallicity map of UVIT J2022. Panels a and b: Hα velocity map and metallicity map, respectively. The maps show the bins with an amplitude-to-noise ratio of more than 4 in the Hβ, [O III], Hα, and [N II] lines. The origin (0,0) in the maps are the coordinates of Table 1.
Current usage metrics show cumulative count of Article Views (full-text article views including HTML views, PDF and ePub downloads, according to the available data) and Abstracts Views on Vision4Press platform.
Data correspond to usage on the plateform after 2015. The current usage metrics is available 48-96 hours after online publication and is updated daily on week days.
Initial download of the metrics may take a while.