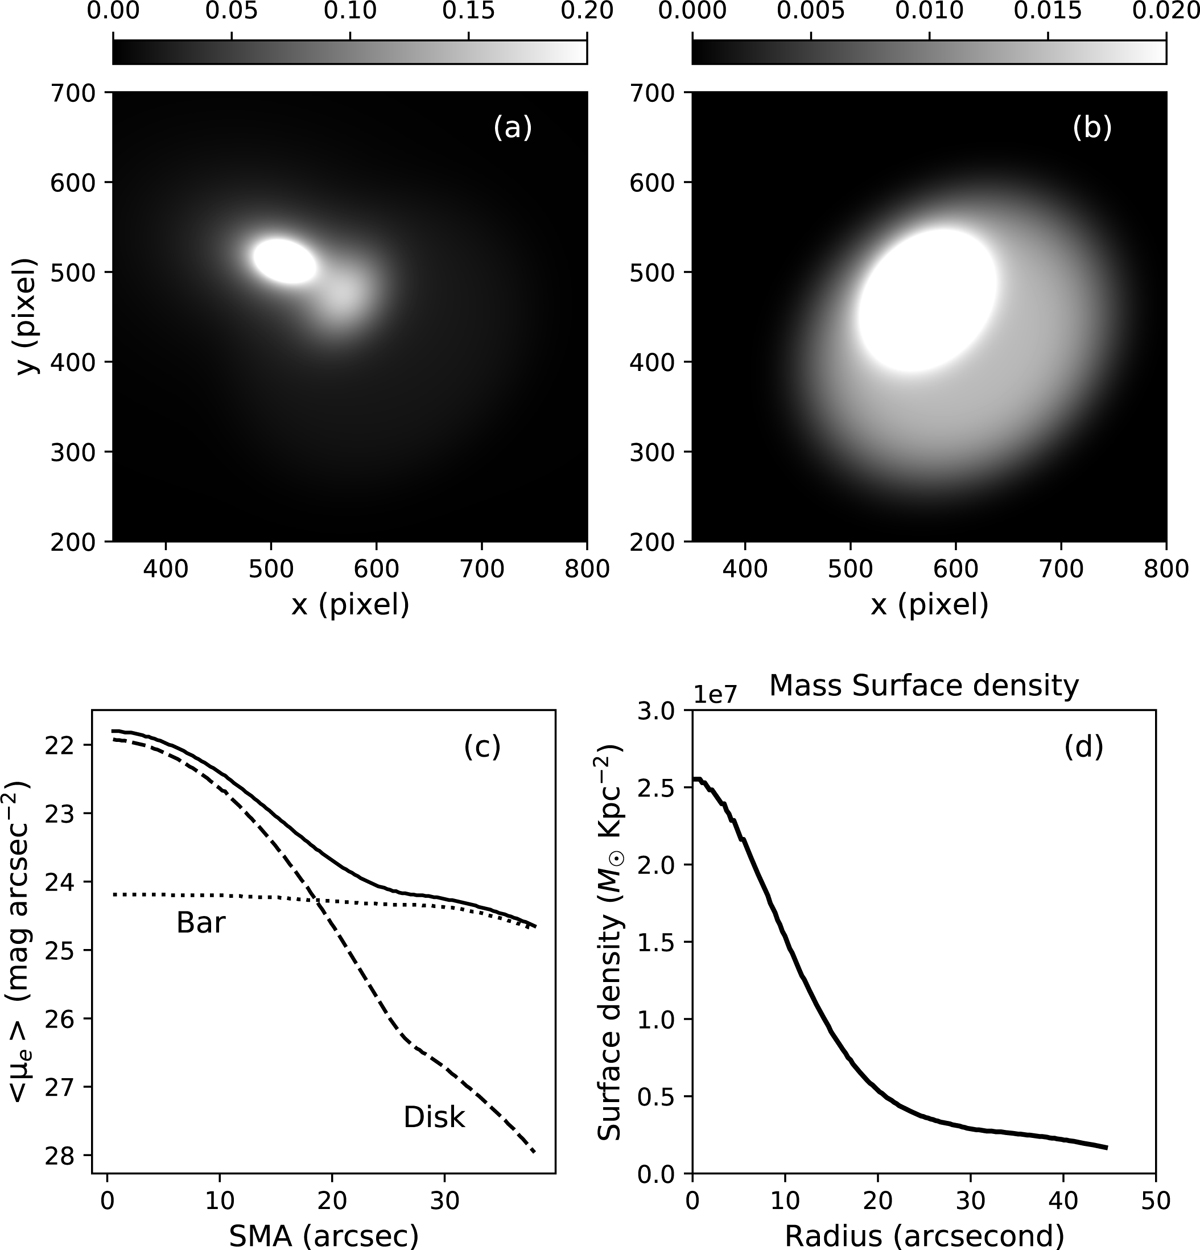
Fig. 3.
Download original image
GALFIT decomposition of NGC 6902A and UVIT J2022. Panel a: model obtained from the fitting of NGC 6902A and UVIT J2022 with the 3+2 Sersic component in the r band. Panel b: model image of UVIT J2022. The size scale is the same in panels a and b. However, the grayscale in panel b is different to show the extent of UVIT J2022. Panel c: total model average surface brightness profile of UVIT J2022 in the r band, obtained from GALFIT (solid curve). The dotted and dashed curves show the Sersic profiles for the inner central bar-like structure and disk component, respectively. Panel d: surface density of UVIT J2022.
Current usage metrics show cumulative count of Article Views (full-text article views including HTML views, PDF and ePub downloads, according to the available data) and Abstracts Views on Vision4Press platform.
Data correspond to usage on the plateform after 2015. The current usage metrics is available 48-96 hours after online publication and is updated daily on week days.
Initial download of the metrics may take a while.