| Issue |
A&A
Volume 656, December 2021
|
|
|---|---|---|
| Article Number | L19 | |
| Number of page(s) | 6 | |
| Section | Letters to the Editor | |
| DOI | https://doi.org/10.1051/0004-6361/202141506 | |
| Published online | 14 December 2021 | |
Letter to the Editor
Revisiting the explodability of single massive star progenitors of stripped-envelope supernovae
1
Département d’Astronomie, Université de Genève, Chemin Pegasi 51, 1290 Versoix, Switzerland
e-mail: ezapartas@gmail.com
2
Department of Physics, Columbia University, New York, NY 10027, USA
3
Center for Computational Astrophysics, Flatiron Institute, 162 5th Ave, New York, NY 10010, USA
4
Center for Interdisciplinary Exploration and Research in Astrophysics (CIERA) and Department of Physics and Astronomy, Northwestern University, 1800 Sherman Avenue, Evanston, IL 60201, USA
5
Department of Physics, Anhui Normal University, Wuhu city, Anhui Province 241000, PR China
6
DARK, Niels Bohr Institute, University of Copenhagen, Jagtvej 128, 2200 Copenhagen, Denmark
Received:
9
June
2021
Accepted:
23
September
2021
Stripped-envelope supernovae (Types IIb, Ib, and Ic) that show little or no hydrogen comprise roughly one-third of the observed explosions of massive stars. Their origin and the evolution of their progenitors are not yet fully understood. Very massive single stars stripped by their own winds (≳25−30 M⊙ at solar metallicity) are considered viable progenitors of these events. However, recent 1D core-collapse simulations show that some massive stars may collapse directly into black holes after a failed explosion, with a weak or no visible transient. In this Letter, we estimate the effect of direct collapse into a black hole on the rates of stripped-envelope supernovae that arise from single stars. For this, we compute single-star MESA models at solar metallicity and map their final state to their core-collapse outcome following prescriptions commonly used in population synthesis. According to our models, no single stars that have lost their entire hydrogen-rich envelope are able to explode, and only a fraction of progenitors left with a thin hydrogen envelope do (IIb progenitor candidates), unless we use a prescription that takes the effect of turbulence into account or invoke increased wind mass-loss rates. This result increases the existing tension between the single-star paradigm to explain most stripped-envelope supernovae and their observed rates and properties. At face value, our results point toward an even higher contribution of binary progenitors to stripped-envelope supernovae. Alternatively, they may suggest inconsistencies in the common practice of mapping different stellar models to core-collapse outcomes and/or higher overall mass loss in massive stars.
Key words: supernovae: general / stars: massive / stars: evolution
© ESO 2021
1. Introduction
Core-collapse supernovae (SNe) mark the explosive death of massive stars. A subset of them show no observational features of hydrogen (H) in their spectra. This indicates that their progenitors had been (almost) fully stripped of their H-rich envelopes before explosion. These so-called stripped-envelope SNe (SESNe) are observationally classified as Type Ib or Ic (SN Ib/c) when they are fully stripped of H, with Ic also lacking signatures of helium (He) in their spectra. Type IIb SNe (SN IIb) are a transitional subclass of SESNe that show H lines only for a few days after the explosion, which subsequently disappear (for a review of SN classification, see Filippenko 1997).
One mechanism proposed for the production of SNe Ib/c is the stripping of the hydrogen-rich envelope of massive single-star progenitors due to their own strong mass loss (e.g., Maeder & Lequeux 1982; Heger et al. 2003; Georgy et al. 2012). These stripped stars might appear as Wolf-Rayet (WR) stars with emission lines, or not, depending on their wind mass-loss rates (e.g., Crowther 2007; Götberg et al. 2018). The loss of the outer layers is the outcome of many possible mass-loss mechanisms throughout the stellar lifetime (for a review, see Smith 2014).
Recently, there has been an ongoing investigation into whether all massive star progenitors of a core-collapse event produce observable transients. Self-consistent simulations that model the core-collapse process, within the neutrino-driven explosion paradigm, have suggested the possibility that the SN shock might stall and be reverted by the infalling material, failing to unbind the outer layers of the star (Herant et al. 1994; Burrows et al. 1995; Fryer & Heger 2000; Janka 2013; Müller 2019; Vartanyan et al. 2021). In this case, in the absence of an extended H-rich envelope (e.g., Quataert et al. 2019; Antoni & Quataert 2021), the expected outcome is the implosion of the collapsing star into a black hole (BH), with only a weak transient (e.g., Nadezhin 1980; Fernández et al. 2018; Ivanov & Fernández 2021) or possibly no transient at all. There have been observational efforts to identify the disappearance of evolved stars without a SN, and thus far there are two potential candidates of red supergiant stars that have been reported missing (Gerke et al. 2015; Adams et al. 2017a,b; Neustadt et al. 2021).
The uncertainty of the outcome of the collapse process is an important general limiting factor in the interpretation of gravitational wave detections (e.g., Belczynski et al. 2016; Bavera et al. 2020), X-ray binary kinematics (e.g., Atri et al. 2019), and SN statistics, all of which are seeing rapid observational advancements with LIGO/Virgo (e.g., Abbott et al. 2021), Gaia (Gaia Collaboration 2018), and large transient surveys (e.g., Perley et al. 2020), respectively. More specifically, robotic surveys such as the Vera C. Rubin Observatory’s Legacy Survey of Space and Time (Ivezić et al. 2019) will provide large samples of transients, including SESNe; however, ab initio simulations of stellar explosions are still sparse, and theoretical rate calculations need to rely on simpler parametric core-collapse models (e.g., O’Connor & Ott 2011; Fryer et al. 2012; Sukhbold & Woosley 2014; Sukhbold et al. 2016; Ertl et al. 2016, 2020; Ebinger et al. 2019; Patton & Sukhbold 2020; Couch et al. 2020). Here, we investigate the consistency between the single-star progenitors self-stripped by their own winds to produce SESNe and a wide range of state-of-the-art parametric explosion models.
The stellar core structure determines the collapse, explosion, and, ultimately, the occurrence of a bright SN transient. Only by parametrizing the complex pre-SN core structure and the multidimensional collapse and explosion dynamics is it possible to explore a wide range of progenitors. One-dimensional (1D) parametric core-collapse models predict a non-monotonic behavior of the properties of this inner core with initial mass, resulting in “islands” of successful explosions in the mass parameter space, which are surrounded by regions of BH formation via direct collapse.
The observed relative rate of SESNe to all core-collapse SNe is ∼1/3 (Smith et al. 2011; Eldridge et al. 2013; Shivvers et al. 2019). This ratio is not easily explained if only single massive stars are considered: A large initial mass is required for them to lose all their H-rich material, which makes them disfavored by the initial mass function (e.g., Smith et al. 2011) and generally makes it harder for them to explode successfully. If even a fraction of them do not produce a transient at collapse, it would increase the significance of the inconsistency between the observed rates and the assumption that most SESNe come from single massive progenitors. Our rate of massive single stars successfully exploding as SESNe provides an independent constraint to be taken into account in the interpretation of observational data and of the outcome of population synthesis and parametric SN explosion simulations1.
2. Method
In this study we estimated the rate of successful hydrogen-poor SN explosions from isolated stars using the software framework POSYDON (Fragos et al., in prep.)2. Our default results are based on a grid of 96 single-star models at solar metallicity (Z⊙ = 0.0142; Asplund et al. 2009). The grid spans initial masses from 10 to 120 M⊙, with a spacing of 1 M⊙ between 10–25 M⊙, 0.5 M⊙ between 25–55 M⊙ to more accurately capture the transition to partially and fully stripped stars, and logarithmically spaced above 55 M⊙. The stellar models evolved using the MESA 1D stellar evolution code (Paxton et al. 2011, 2013, 2015; Paxton et al. 2018, 2019, version 11701) from zero-age main sequence up to carbon core depletion. At that evolutionary stage the star has less than a few years until its core collapses, and its surface chemical profile is not expected to vary significantly until the end. This would change in the case of possible episodic mass loss in the remaining stages, which we do not account for but discuss in Sect. 4. We briefly summarize here some of the key physical assumptions as well as certain variations of them that we explore.
In our default model we assumed standard “Dutch” wind mass-loss prescriptions in various evolutionary phases, following Vink et al. (2000) for main-sequence stars and switching to de Jager et al. (1988) whenever an evolved star expands and its effective temperature drops below 104 K. We assumed a mass-loss rate, following Nugis & Lamers (2000), when the surface H mass fraction drops below 0.4. We also experimented with scaling up wind mass loss by 1.5.
We adopted the Ledoux criterion for convective instability, with a mixing length parameter of αMLT = 1.93 (Choi et al. 2016). In our default model we assumed an exponential convective overshooting only during the main-sequence phase, with fov = 4.15 × 10⁻² and f0, ov = 8 × 10⁻³, calibrated following Claret & Torres (2017) to produce main-sequence evolutionary tracks similar to the step overshooting of Brott et al. (2011). We also studied a population with models where there is the same over- and undershooting in shell burning regions, as well as one with a lower core overshooting of fov = 1.6 × 10⁻² during main sequence (Choi et al. 2016). All the above assumptions regarding overshooting lead to lower helium and carbon-oxygen core masses. We assumed zero stellar rotation in our default simulation, but we also explored a variation where we assumed that stars are born at 40% of their critical rotation, allowing for rotational chemical mixing (Chaboyer & Zahn 1992; Heger et al. 2000) and angular momentum transport (Spruit 2002).
We defined as possible progenitors of SNe Ib or SNe Ic (SN Ib/c “candidates”) all stars that expel their H-rich envelopes prior to carbon depletion (Menv = 0) and are left only with H-deficient “helium” stellar cores, with a boundary defined by the low hydrogen mass fraction of XH < 10−2. We refrained from differentiating between SN Ib and SN Ic progenitors due to the uncertainty in the expected surface structure and abundances that lead to each subclass (Dessart et al. 2012, although see also Modjaz et al. 2016). We also assumed that a successfully exploding star with a thin H-rich layer, 0 < Menv ≤ 0.5 M⊙, will produce a SN IIb (e.g., Maund et al. 2004; Van Dyk et al. 2011; Bersten et al. 2012).
To determine whether a star will produce a successful explosion, we mapped its structure at carbon depletion to its “explodability” properties, following various prescriptions available in the literature from Fryer et al. (2012), Sukhbold et al. (2016), Patton & Sukhbold (2020), and Couch et al. (2020). Fryer et al. (2012) introduced two prescriptions, “rapid” and “delayed” (henceforth F12+rapid and F12+delayed, respectively), to determine the final compact remnant type and mass, based on their final carbon-oxygen core mass, MCO. The main difference between the two prescriptions for our study is that F12+rapid produces a possibly physical mass gap between neutron stars and BHs in the 2−5 M⊙ mass range.
The outcome of the collapse of Sukhbold et al. (2016) pre-SN models has been calibrated against the well-studied SN 1987A progenitor. From the different SN engine calibrations available, we followed their most optimistic options for successful explosions of “N20” and “S19.8” (S16+N20 and S16+S19.8, respectively). In our study, following Román-Garza et al. (2021), for every star in our population we assumed the same explodability outcome as the Sukhbold et al. (2016) model with the closest final helium core mass, MHe. This is referred to as the “hybrid” method in Patton et al. (2021). For simplicity, we neglected the rare occurrence of any fallback-powered explosions during BH formation.
Couch et al. (2020, henceforth C20) included the effect of turbulence during the collapse simulated in 1D (see also Mabanta & Murphy 2018; Mabanta et al. 2019). They applied their explosion model to the progenitors from Sukhbold et al. (2016), so we followed the same hybrid approach as in the S16+N20 and S16+S19.8 prescriptionss, assuming an explodability outcome based on the final helium core mass. We used a value of αΛ = 1.2 for the free parameter that describes the effect of turbulence, consistent with their favored range. As already noted by C20, the explosion outcomes are radically different from the results of Sukhbold et al. (2016) and Ertl et al. (2016).
In the Patton & Sukhbold (2020) prescription, the carbon abundance and core mass at carbon ignition determine the explodability of the pre-SN core. The carbon abundance is sensitive to the assumed 12C(α, γ)16O reaction rate (in our case, from Cyburt et al. 2010)3, which is notoriously uncertain (e.g., Holt et al. 2019; Farmer et al. 2020). Patton & Sukhbold (2020) study CO core masses up to 10 M⊙; they argue that with higher core masses it is even more difficult to explode and that the formation of a BH is most likely (Sukhbold et al. 2016; Ertl et al. 2020). We thus followed the same assumption here. We could then map our models to the explodability parametrization of Ertl et al. (2016), arguing that it captures the results from 3D simulations more accurately compared to the compactness parametrization of O’Connor & Ott (2011). We mapped to the N20 calibration option of Ertl et al. (2016) to determine the outcome of the collapse process (SN engine P20E16+N20), although we verified that the results are similar for the other options as well.
To get the statistical properties of a population, we performed a linear interpolation on the final physical quantities used in the SN prescriptions. These quantities are needed to determine the explodability outcome and the H-rich envelope mass for a population of 10 000 single stars, drawn from a Kroupa (2001) initial mass function over a range of 8−120 M⊙.
3. Results
Figure 1 shows the final total, He-core, and CO-core masses as a function of the initial masses of the stars. The final total and core masses are determined by the interplay between (i) the increasing mass-loss rates, (ii) the shorter lifetime, and (iii) the bigger mass reservoir and the relatively more massive cores of stars with higher initial masses. We see that, on average, stars with higher initial masses have higher final total and core masses. For our default grid of stellar simulations (Fig. 1a), stars with initial masses of approximately 70 M⊙ reach a peak final mass of ∼35 M⊙. For even higher initial masses, the final mass drops to around 13 M⊙ due to the increased wind mass-loss rate.
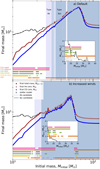 |
Fig. 1. Final total mass (Mfinal; black), helium core mass (MHe; maroon), and carbon-oxygen core mass (MCO; blue) as a function of initial mass (Minitial) for our default grid (top) and our grid with winds boosted by a factor of 1.5 (bottom). We also depict the stellar models (white crosses) that we interpolate between. In the background, we shade the mass ranges for final stellar structures that could give rise to SNe IIb if they explode at collapse (with 0 < Menv ≤ 0.5 M⊙; light blue shading) and WR stars that may produce SNe Ib/c (with Menv = 0, blue shading). We also mark the models that lead to successful explosions, according to the FR12-rapid, FR12-delayed, S16-N20, S16−S19.8, P20E16+N20, and C20 SN engines (horizontal magenta, brown, gray, light green, light orange, and dark orange bands of arbitrary y value). In the inset plots we show the final envelope mass (Menv) for models with initial masses of 15−40 M⊙. |
For a fixed set of stellar physics assumptions, there is a minimum initial-mass threshold, Mmin, WR, above which single stars lose their H-rich envelopes before collapse, making them candidates for exploding as SNe Ib/c. Type IIb SNe can occur in a thin mass range between Mmin, IIb and Mmin, WR. These parameters are sensitive to stellar physical assumptions, especially the strength of stellar winds. In our default models, we find Mmin, IIb ∼ 25 M⊙ and Mmin, WR ∼ 30 M⊙, consistent with previous theoretical and observational estimates that place Mmin, WR between 20 and 40 M⊙ (Heger et al. 2003; Crowther et al. 2006; Georgy et al. 2012; Renzo et al. 2017; Sravan et al. 2019). In Table 1 we report on the values of these parameters and the formation rates of SN Ib/c and SN IIb candidates for all our stellar simulations.
Minimum initial mass for SN Ib/c and IIb candidate stars (Mmin, WR and Mmin, IIb, respectively), their formation rate for each stellar simulation, and the fraction of them that successfully explode in SNe Ib/c and IIb, respectively, for different SN engines.
In Fig. 1 we also depict the range of initial masses that lead to successful SNe for various SN engines (horizontal, colored bands). FR12+rapid and FR12+delayed engines (magenta and brown, respectively), which are solely based on the final mass of the carbon-oxygen core (blue line), result in explosions only for initial stellar masses below ∼28 M⊙ in our default model. Only a few SN IIb candidates are in this range and successfully explode, whereas all fully stripped candidates of SNe Ib/c are predicted to collapse into a BH.
S16+N20 and S16+19.8 (gray and light green, respectively) as well as P20E16+N20 (orange) show a more abrupt behavior, as expected from the nonlinearity of the inner core structure with initial mass (Sukhbold et al. 2016; Ertl et al. 2016). These SN engines disfavor explosions of initially very massive stars and do not predict any SNe Ib/c or even SNe IIb.
In Table 1 we also show the expected fraction of candidates of SESNe that will successfully explode, following a Kroupa (2001) initial mass function, for all the combinations of different physical assumptions during the stellar evolution (columns) and SN engines (rows). None of the explosion models, expect that from C20, produce any SNe Ib/c, regardless of the assumptions during the stellar evolution, with the exception of the increased wind mass-loss rate as we discuss below. F12+rapid and F12+delayed in our default model predict that ∼15% of partially stripped candidates (with 0 < Menv ≤ 0.5 M⊙) will successfully explode as SNe IIb. This fraction is sensitive to the assumed maximum Menv, increasing to ≳60% for F12+rapid and F12+delayed when the assumed range for SNe IIb is 0 ≤ Menv < 1.0 M⊙, although the fraction of successful SNe IIb remains negligible for the other engines, even in this case.
The C20 engine predicts a very different picture compared with the other SN prescriptions, resulting in all SESN progenitors exploding. This is because in that study they find that in the models with higher initial stellar masses of ≳30−50 M⊙ from Sukhbold et al. (2016), it is easier to make them explode. These stars have the highest core masses in Sukhbold et al. (2016), ∼15 M⊙. Combining this with the higher core masses found in our models leads to explosions from all SESNe for αΛ ≥ 1.2. Couch et al. (2020) find an island of BH formation from initially lower mass progenitors, of around 10−15 M⊙, which form 3−4 M⊙ final helium cores; this can be found in our results as well. Their results are drastically different compared to Sukhbold et al. (2016) and Ertl et al. (2016), possibly pointing toward the importance of turbulence. In a way, turbulence may be the key factor for solving the issue, although it creates artifacts in the SN II and compact object formation landscapes. We stress, however, that the C20 model leads to low mass BHs of ≲10 M⊙, especially for high αΛ values, which is not consistent with the BH masses in some Galactic BH X-ray binaries (e.g., Miller-Jones et al. 2021).
The main reason for the dearth of successful SESN explosions for all SN engines apart from that of C20 is the high final core masses. The exact final values are dependent on stellar parameters, including stellar winds, convective core overshooting, the inclusion of the effect of shell convective over- and undershooting, and rotation, but these high final masses are generally consistent with other theoretical and observational results (e.g., Georgy et al. 2012; Spera et al. 2015; Sander et al. 2019). The nonoccurrence of SNe Ib/c is a persistent result in our simulations that do not include effects of turbulence in the collapse process, as in C20, independent of mild initial rotation or the amount of shell overshooting during the post-main-sequence evolution.
Only in our grid of increased wind strength (1.5 times higher compared to our default model; Fig. 1b, last column of Table 1) do we find a small fraction of fully stripped progenitors that successfully explode, even for engines different than that of C20. Higher wind mass-loss rates result in a decreased Mmin, WR, increasing the number of SESN candidates that originate from lower initial masses compared to the default simulations. It also leads to less massive final cores compared to default simulations, which on average favors successful explosions and neutron star formations according to all SN engines. We additionally find successful SNe Ib/c originating from stars of ≳60 M⊙ with final masses of ∼7−8 M⊙, although this group is very sensitive to wind mass-loss uncertainties. A higher fraction of SN IIb candidates also explode for models with increased winds. Still, even in this case, the fraction of successful SN Ib/c explosions compared to all fully stripped cadidate stars remains below 5% for SN engines that take the compactness of the inner core into account (S16+N20, S16+19.8, and Pat20E16+N20). It is interesting to note that the C20 engine in the case of high winds does not lead to successful explosions from all stripped-envelope candidates, which was the case with all other stellar assumptions. This is because the lower final cores of these stellar models are found in the mass range in which inducing explosions is found to be difficult when the turbulence effect is included.
4. Discussion and conclusions
In this Letter we estimate the effect of the non-explodability of massive single-star SN progenitors on the statistics of SESNe, using various up-to-date core-collapse prescriptions. We find that, unless high wind mass loss is invoked, all fully stripped stars that could produce SNe Ib/c will collapse into a BH with a faint transient, or none at all, for all but one of the SN engines considered in this study. A significant fraction of single-star candidate progenitors of IIb SNe are expected to not produce transient events either. In contrast, the fraction of stripped-envelope candidates that successfully explode is as high as 100% for the C20 SN engine that includes the effects of turbulence.
There are several caveats to our results. Since our stellar models stop at core carbon depletion, we cannot directly quantify the explodability of each model at the onset of core collapse. We aim to explore the general trend for a range of masses with various SN engines rather than predict self-consistently the outcome of the collapse. The mapping of our stellar structure properties to the outcome of their collapse is less uncertain in the case of the Pat20E16+N20 engine because this model additionally takes the core carbon abundance into account. For this mapping, the main source of uncertainty seems to originate from stellar evolution processes prior to carbon ignition: prior mass loss (Renzo et al. 2017), internal mixing (Limongi & Chieffi 2018), and the efficiency of the nuclear reaction rates that affect the abundances in the carbon core (Tur et al. 2007; Farmer et al. 2020). We note that this engine predicts the lowest fraction of successful SESN explosions for all stellar simulations. In the other SN engines considered, we implicitly assume that the explodability outcomes from Fryer et al. (2012) and Sukhbold et al. (2016) apply for stars with the same carbon and helium core masses, respectively, despite their progenitor models being computed using different stellar codes and physical assumptions.
Previous studies have shown that the suggested explodability metrics depend on metallicity and rotation (e.g., O’Connor & Ott 2011), the adopted stellar wind mass-loss rates (even if these only act early during a star’s evolution; Renzo et al. 2017), overshooting (Davis et al. 2019), and the occurrence of convective shell mergers (e.g., Vartanyan et al. 2021). Other parameters might play a significant role in shaping the density structure of the core at the onset of core collapse. Studying the complex impact of each stellar physics assumption on the core-collapse outcome is beyond the scope of this Letter.
A major caveat common to explodability studies that span a large parameter range is that these are only feasible with semi-analytic (e.g., Fryer et al. 2012; Mandel & Müller 2020; Schneider et al. 2021) and/or 1D parametrized explosion simulations (e.g., O’Connor & Ott 2011; Ertl et al. 2016, 2020; Sukhbold et al. 2016; Ebinger et al. 2019). However, it has become increasingly clear that multidimensional effects (e.g., neutrino-driven convection, standing accretion shock instability, and lepton emission asymmetry) are key to the success of explosions (e.g., Janka 2012, for a review) and that asymmetries are necessary to produce natal kicks (e.g., Janka 2013, 2017). Recent multidimensional simulations of core collapse can result in successful shock revival even when 1D parametrized results might suggest complete fallback in a failed explosion (Chan et al. 2018, 2020; Ott et al. 2018; Kuroda et al. 2018; Burrows et al. 2019; Vartanyan et al. 2019; Powell & Müller 2020). In the case of a successful shock revival, we might expect a visible electromagnetic transient. In any case, these simulations are computationally challenging and expensive, and thus there are not yet any prescriptions for an extended mass range of progenitors.
In addition, we focused only on the paradigm of neutrino-driven explosions. While other explosion mechanisms have been proposed (e.g., MacFadyen & Woosley 1999; Janka 2012; Gilkis et al. 2016; Soker 2019), no criterion to assess the outcome across a large range of initial masses exists to our knowledge. We also note that possible faint electromagnetic transients in the case of a “failed SN” and BH formation due to the loss of gravitational mass to neutrinos (Fernández et al. 2018; Ivanov & Fernández 2021) seem quite improbable for compact, stripped-envelope stars, for which little to no ejection is expected.
In this study we have restricted ourselves to solar metallicity models; as such, our results do not apply directly to the observed SESN sample, as these include events from a range of metallicity environments (e.g., Graur et al. 2017). However, in lower metallicities, SN IIb and Ib/c stellar candidates would be on average less numerous and of higher final mass due to their lower wind mass-loss rates (e.g., Vink et al. 2001; Smith 2014). Therefore, these progenitors would also have on average larger final core masses that correspond to less explosive structures for most of the SN engines discussed here.
We show that one possible way to increase the number of SESN progenitors from single stars at a given metallicity would be to increase the stellar wind mass-loss rates (e.g., van Loon 2006; Beasor & Davies 2018). However, observational evidence and theoretical arguments thus far point toward potentially lower wind mass-loss rates than adopted in this study (e.g., Smith 2014; Neijssel et al. 2021; Higgins et al. 2021). In addition, changing the wind mass-loss rates can have an impact on the core structure and its explodability (e.g., Renzo et al. 2017). Another possibility is for eruptive mass loss (luminous blue variable eruptions; e.g., Conti & Ebbets 1977) or episodic mass loss linked to the late phases of massive stellar evolution (e.g., Arnett & Meakin 2011; Quataert & Shiode 2012) to strip a star of its final H-rich envelope, although these processes may instead lead to Type IIn SNe due to interaction with circumstellar material.
If indeed only a small portion of massive, single, stripped stars contribute to the statistics of SESNe, it would significantly change their theoretically expected rates and properties. As we cannot empirically constrain the rate of failed SNe from WR stars, their explodability fraction is not an observationally testable parameter but will affect the observed rate of SESN transients. Assuming that all SESNe originate from single stars, our finding – that the majority of single stars that end up stripped of their H-rich envelopes do not explode – is inconsistent with their observed relative rate compared to hydrogen-rich Type II events of ∼1/3 (Smith et al. 2011; Eldridge et al. 2013; Shivvers et al. 2019). This is because theoretically expected single SESN progenitors are very rare, even if we assume that all massive stars are able to explode (∼0.15 to all SNe, for Mmin, WR = 31 M⊙ as our default model and assuming Type II explosions from stars with initial masses of between 8 and 31 M⊙ ). So the findings discussed in this study aggravate the possible rate discrepancy (something that is qualitatively mentioned in Smith et al. 2011). The empirical absolute rate of SESNe depends on the star-forming rate of the host galaxies of the progenitors and thus is not easily constrained; however, the fact that we do detect these types of transients obviously cannot be explained by single massive single-star progenitors if their explodability rate is ∼0%.
Our results alone are not necessarily a motivation to revise single-star mass-loss rates or their explodability properties, since the binary progenitors of SESNe are a suggested alternative path for SNe Ib/c and SNe IIb (e.g., Podsiadlowski et al. 1992; De Donder & Vanbeveren 1998; Yoon et al. 2010; Eldridge et al. 2013; Zapartas et al. 2017; Sravan et al. 2019, 2020). This scenario helps explain their low ejecta masses and short timescales (e.g., Drout et al. 2011; Lyman et al. 2016; Modjaz et al. 2016), their relatively high occurrence rate (e.g., Eldridge et al. 2013; Graur et al. 2017; Shivvers et al. 2019), the difficulty to directly image their progenitors (e.g., Eldridge et al. 2013, although see Yoon et al. 2012; Van Dyk et al. 2019), and the detection of binary companions at SN IIb sites (Maund et al. 2004; Fox et al. 2014; Ryder et al. 2018). Within the framework of this study, our results suggest that binary progenitors may be the dominant formation channel for SESNe. Evolution in a binary system offers two advantages over single-star progenitors. First, binary interactions do not have a minimum mass threshold for removing the H-rich envelope (Podsiadlowski et al. 1992; Eldridge et al. 2013; Yoon et al. 2017; Götberg et al. 2018; Sravan et al. 2018, 2020), allowing progenitors of initial masses of ∼10−25 M⊙ (which have lower final cores and thus will explode in most cases) to produce SESNe. Secondly, binary stripping seems to affect the final core structure and chemical composition, on average increasing the explodability of binary stripped stars compared to single stars of the same initial mass or even the same carbon core mass (Schneider et al. 2021; Laplace et al. 2021; Vartanyan et al. 2021). Binaries might also provide paths to SESNe through mergers or by increasing the mass of binary secondaries enough for them to wind-strip (e.g., Yoon et al. 2012; Zapartas et al. 2017; Hirai et al. 2020). However, the explodability of such progenitors requires further study.
Very recently, Patton et al. (2021) carried out a study in a similar direction, focusing on the compact object remnant masses produced by these prescriptions.
Acknowledgments
We thank Sean Couch for sharing the data to reproduce Couch et al. (2020) SN prescription. E. Z. acknowledges support from the Swiss Government Excellence Scholarship (ESKAS No. 2019.0091). This work was supported by the Swiss National Science Foundation Professorship grant (project number PP00P2 176868; PI Tassos Fragos). J. J. A. and S. C. are supported by CIERA and A. D., J. G. S., and K. A. R. are supported by the Gordon and Betty Moore Foundation through grant GBMF8477. The computations were performed in part at the University of Geneva on the Baobab and Yggdrasil computer clusters and at Northwestern University on the Trident computer cluster (the latter funded by grant GBMF8477).
References
- Abbott, R., Abbott, T. D., Abraham, S., et al. 2021, ApJ, 913, L7 [NASA ADS] [CrossRef] [Google Scholar]
- Adams, S. M., Kochanek, C. S., Gerke, J. R., & Stanek, K. Z. 2017a, MNRAS, 469, 1445 [NASA ADS] [CrossRef] [Google Scholar]
- Adams, S. M., Kochanek, C. S., Gerke, J. R., Stanek, K. Z., & Dai, X. 2017b, MNRAS, 468, 4968 [NASA ADS] [CrossRef] [Google Scholar]
- Antoni, A., & Quataert, E. 2021, MNRAS, submitted, [arXiv:2107.09068] [Google Scholar]
- Arnett, W. D., & Meakin, C. 2011, ApJ, 741, 33 [NASA ADS] [CrossRef] [Google Scholar]
- Asplund, M., Grevesse, N., Sauval, A. J., & Scott, P. 2009, ARA&A, 47, 481 [NASA ADS] [CrossRef] [Google Scholar]
- Atri, P., Miller-Jones, J. C. A., Bahramian, A., et al. 2019, MNRAS, 489, 3116 [NASA ADS] [CrossRef] [Google Scholar]
- Bavera, S. S., Fragos, T., Qin, Y., et al. 2020, A&A, 635, A97 [NASA ADS] [CrossRef] [EDP Sciences] [Google Scholar]
- Beasor, E. R., & Davies, B. 2018, MNRAS, 475, 55 [NASA ADS] [CrossRef] [Google Scholar]
- Belczynski, K., Holz, D. E., Bulik, T., & O’Shaughnessy, R. 2016, Nature, 534, 512 [NASA ADS] [CrossRef] [Google Scholar]
- Bersten, M. C., Benvenuto, O. G., Nomoto, K., et al. 2012, ApJ, 757, 31 [Google Scholar]
- Brott, I., Evans, C. J., Hunter, I., et al. 2011, A&A, 530, A116 [NASA ADS] [CrossRef] [EDP Sciences] [Google Scholar]
- Burrows, A., Hayes, J., & Fryxell, B. A. 1995, ApJ, 450, 830 [NASA ADS] [CrossRef] [Google Scholar]
- Burrows, A., Radice, D., & Vartanyan, D. 2019, MNRAS, 485, 3153 [NASA ADS] [CrossRef] [Google Scholar]
- Chaboyer, B., & Zahn, J.-P. 1992, A&A, 253, 173 [Google Scholar]
- Chan, C., Müller, B., Heger, A., Pakmor, R., & Springel, V. 2018, ApJ, 852, L19 [NASA ADS] [CrossRef] [Google Scholar]
- Chan, C., Müller, B., & Heger, A. 2020, MNRAS, 495, 3751 [NASA ADS] [CrossRef] [Google Scholar]
- Choi, J., Dotter, A., Conroy, C., et al. 2016, ApJ, 823, 102 [Google Scholar]
- Claret, A., & Torres, G. 2017, ApJ, 849, 18 [Google Scholar]
- Conti, P. S., & Ebbets, D. 1977, ApJ, 213, 438 [CrossRef] [Google Scholar]
- Couch, S. M., Warren, M. L., & O’Connor, E. P. 2020, ApJ, 890, 127 [NASA ADS] [CrossRef] [Google Scholar]
- Crowther, P. A. 2007, ARA&A, 45, 177 [Google Scholar]
- Crowther, P. A., Hadfield, L. J., Clark, J. S., Negueruela, I., & Vacca, W. D. 2006, MNRAS, 372, 1407 [Google Scholar]
- Cyburt, R. H., Amthor, A. M., Ferguson, R., et al. 2010, ApJS, 189, 240 [NASA ADS] [CrossRef] [Google Scholar]
- Davis, A., Jones, S., & Herwig, F. 2019, MNRAS, 484, 3921 [NASA ADS] [CrossRef] [Google Scholar]
- De Donder, E., & Vanbeveren, D. 1998, A&A, 333, 557 [NASA ADS] [Google Scholar]
- de Jager, C., Nieuwenhuijzen, H., & van der Hucht, K. A. 1988, A&AS, 72, 259 [NASA ADS] [Google Scholar]
- Dessart, L., Hillier, D. J., Li, C., & Woosley, S. 2012, MNRAS, 424, 2139 [NASA ADS] [CrossRef] [Google Scholar]
- Drout, M. R., Soderberg, A. M., Gal-Yam, A., et al. 2011, ApJ, 741, 97 [NASA ADS] [CrossRef] [Google Scholar]
- Ebinger, K., Curtis, S., Fröhlich, C., et al. 2019, ApJ, 870, 1 [NASA ADS] [Google Scholar]
- Eldridge, J. J., Fraser, M., Smartt, S. J., Maund, J. R., & Crockett, R. M. 2013, MNRAS, 436, 774 [NASA ADS] [CrossRef] [Google Scholar]
- Ertl, T., Janka, H.-T., Woosley, S. E., Sukhbold, T., & Ugliano, M. 2016, ApJ, 818, 124 [NASA ADS] [CrossRef] [Google Scholar]
- Ertl, T., Woosley, S. E., Sukhbold, T., & Janka, H. T. 2020, ApJ, 890, 51 [CrossRef] [Google Scholar]
- Farmer, R., Renzo, M., de Mink, S. E., Fishbach, M., & Justham, S. 2020, ApJ, 902, L36 [CrossRef] [Google Scholar]
- Fernández, R., Quataert, E., Kashiyama, K., & Coughlin, E. R. 2018, MNRAS, 476, 2366 [CrossRef] [Google Scholar]
- Filippenko, A. V. 1997, ARA&A, 35, 309 [NASA ADS] [CrossRef] [Google Scholar]
- Fox, O. D., Azalee Bostroem, K., Van Dyk, S. D., et al. 2014, ApJ, 790, 17 [NASA ADS] [CrossRef] [Google Scholar]
- Fryer, C. L., & Heger, A. 2000, ApJ, 541, 1033 [NASA ADS] [CrossRef] [Google Scholar]
- Fryer, C. L., Belczynski, K., Wiktorowicz, G., et al. 2012, ApJ, 749, 91 [Google Scholar]
- Gaia Collaboration (Brown, A. G. A., et al.) 2018, A&A, 616, A1 [NASA ADS] [CrossRef] [EDP Sciences] [Google Scholar]
- Georgy, C., Ekström, S., Meynet, G., et al. 2012, A&A, 542, A29 [NASA ADS] [CrossRef] [EDP Sciences] [Google Scholar]
- Gerke, J. R., Kochanek, C. S., & Stanek, K. Z. 2015, MNRAS, 450, 3289 [Google Scholar]
- Gilkis, A., Soker, N., & Papish, O. 2016, ApJ, 826, 178 [NASA ADS] [CrossRef] [Google Scholar]
- Götberg, Y., de Mink, S. E., Groh, J. H., et al. 2018, A&A, 615, A78 [NASA ADS] [CrossRef] [EDP Sciences] [Google Scholar]
- Graur, O., Bianco, F. B., Modjaz, M., et al. 2017, ApJ, 837, 121 [CrossRef] [Google Scholar]
- Heger, A., Langer, N., & Woosley, S. E. 2000, ApJ, 528, 368 [NASA ADS] [CrossRef] [Google Scholar]
- Heger, A., Fryer, C. L., Woosley, S. E., Langer, N., & Hartmann, D. H. 2003, ApJ, 591, 288 [CrossRef] [Google Scholar]
- Herant, M., Benz, W., Hix, W. R., Fryer, C. L., & Colgate, S. A. 1994, ApJ, 435, 339 [NASA ADS] [CrossRef] [Google Scholar]
- Higgins, E. R., Sander, A. A. C., Vink, J. S., & Hirschi, R. 2021, MNRAS, 505, 4874 [NASA ADS] [CrossRef] [Google Scholar]
- Hirai, R., Sato, T., Podsiadlowski, P., Vigna-Gómez, A., & Mandel, I. 2020, MNRAS, 499, 1154 [CrossRef] [Google Scholar]
- Holt, R. J., Filippone, B. W., & Pieper, S. C. 2019, Phys. Rev. C, 99, 055802 [NASA ADS] [CrossRef] [Google Scholar]
- Ivanov, M., & Fernández, R. 2021, ApJ, 911, 6 [CrossRef] [Google Scholar]
- Ivezić, Ž., Kahn, S. M., Tyson, J. A., et al. 2019, ApJ, 873, 111 [Google Scholar]
- Janka, H.-T. 2012, Ann. Rev. Nucl. Part. Sci., 62, 407 [Google Scholar]
- Janka, H.-T. 2013, MNRAS, 434, 1355 [Google Scholar]
- Janka, H.-T. 2017, ApJ, 837, 84 [Google Scholar]
- Kroupa, P. 2001, MNRAS, 322, 231 [NASA ADS] [CrossRef] [Google Scholar]
- Kuroda, T., Kotake, K., Takiwaki, T., & Thielemann, F.-K. 2018, MNRAS, 477, L80 [NASA ADS] [CrossRef] [Google Scholar]
- Laplace, E., Justham, S., Renzo, M., et al. 2021, A&A, 656, A58 [NASA ADS] [CrossRef] [EDP Sciences] [Google Scholar]
- Limongi, M., & Chieffi, A. 2018, ApJS, 237, 13 [NASA ADS] [CrossRef] [Google Scholar]
- Lyman, J. D., Bersier, D., James, P. A., et al. 2016, MNRAS, 457, 328 [Google Scholar]
- Mabanta, Q. A., & Murphy, J. W. 2018, ApJ, 856, 22 [CrossRef] [Google Scholar]
- Mabanta, Q. A., Murphy, J. W., & Dolence, J. C. 2019, ApJ, 887, 43 [NASA ADS] [CrossRef] [Google Scholar]
- MacFadyen, A. I., & Woosley, S. E. 1999, ApJ, 524, 262 [NASA ADS] [CrossRef] [Google Scholar]
- Maeder, A., & Lequeux, J. 1982, A&A, 114, 409 [NASA ADS] [Google Scholar]
- Mandel, I., & Müller, B. 2020, MNRAS, 499, 3214 [NASA ADS] [CrossRef] [Google Scholar]
- Maund, J. R., Smartt, S. J., Kudritzki, R. P., Podsiadlowski, P., & Gilmore, G. F. 2004, Nature, 427, 129 [NASA ADS] [CrossRef] [Google Scholar]
- Miller-Jones, J. C. A., Bahramian, A., Orosz, J. A., et al. 2021, Science, 371, 1046 [Google Scholar]
- Modjaz, M., Liu, Y. Q., Bianco, F. B., & Graur, O. 2016, ApJ, 832, 108 [NASA ADS] [CrossRef] [Google Scholar]
- Müller, B. 2019, Ann. Rev. Nucl. Part. Sci., 69, 253 [CrossRef] [Google Scholar]
- Nadezhin, D. K. 1980, Ap&SS, 69, 115 [NASA ADS] [CrossRef] [Google Scholar]
- Neijssel, C. J., Vinciguerra, S., Vigna-Gómez, A., et al. 2021, ApJ, 908, 118 [NASA ADS] [CrossRef] [Google Scholar]
- Neustadt, J. M. M., Kochanek, C. S., Stanek, K. Z., et al. 2021, MNRAS, 508, 516 [NASA ADS] [CrossRef] [Google Scholar]
- Nugis, T., & Lamers, H. J. G. L. M. 2000, A&A, 360, 227 [NASA ADS] [Google Scholar]
- O’Connor, E., & Ott, C. D. 2011, ApJ, 730, 70 [Google Scholar]
- Ott, C. D., Roberts, L. F., da Silva Schneider, A., et al. 2018, ApJ, 855, L3 [NASA ADS] [CrossRef] [Google Scholar]
- Patton, R. A., & Sukhbold, T. 2020, MNRAS, 499, 2803 [NASA ADS] [CrossRef] [Google Scholar]
- Patton, R. A., Sukhbold, T., & Eldridge, J. J. 2021, MNRAS, submitted, [arXiv:2106.05978] [Google Scholar]
- Paxton, B., Bildsten, L., Dotter, A., et al. 2011, ApJS, 192, 3 [Google Scholar]
- Paxton, B., Cantiello, M., Arras, P., et al. 2013, ApJS, 208, 4 [Google Scholar]
- Paxton, B., Marchant, P., Schwab, J., et al. 2015, ApJS, 220, 15 [Google Scholar]
- Paxton, B., Schwab, J., Bauer, E. B., et al. 2018, ApJS, 234, 34 [NASA ADS] [CrossRef] [Google Scholar]
- Paxton, B., Smolec, R., Schwab, J., et al. 2019, ApJS, 243, 10 [Google Scholar]
- Perley, D. A., Fremling, C., Sollerman, J., et al. 2020, ApJ, 904, 35 [NASA ADS] [CrossRef] [Google Scholar]
- Podsiadlowski, P., Joss, P. C., & Hsu, J. J. L. 1992, ApJ, 391, 246 [Google Scholar]
- Powell, J., & Müller, B. 2020, MNRAS, 494, 4665 [NASA ADS] [CrossRef] [Google Scholar]
- Quataert, E., & Shiode, J. 2012, MNRAS, 423, L92 [NASA ADS] [CrossRef] [Google Scholar]
- Quataert, E., Lecoanet, D., & Coughlin, E. R. 2019, MNRAS, 485, L83 [NASA ADS] [CrossRef] [Google Scholar]
- Renzo, M., Ott, C. D., Shore, S. N., & de Mink, S. E. 2017, A&A, 603, A118 [NASA ADS] [CrossRef] [EDP Sciences] [Google Scholar]
- Román-Garza, J., Bavera, S. S., Fragos, T., et al. 2021, ApJ, 912, L23 [CrossRef] [Google Scholar]
- Ryder, S. D., Van Dyk, S. D., Fox, O. D., et al. 2018, ApJ, 856, 83 [NASA ADS] [CrossRef] [Google Scholar]
- Sander, A. A. C., Hamann, W. R., Todt, H., et al. 2019, A&A, 621, A92 [NASA ADS] [CrossRef] [EDP Sciences] [Google Scholar]
- Schneider, F. R. N., Podsiadlowski, P., & Müller, B. 2021, A&A, 645, A5 [NASA ADS] [CrossRef] [EDP Sciences] [Google Scholar]
- Shivvers, I., Filippenko, A. V., Silverman, J. M., et al. 2019, MNRAS, 482, 1545 [Google Scholar]
- Smith, N. 2014, ARA&A, 52, 487 [NASA ADS] [CrossRef] [Google Scholar]
- Smith, N., Li, W., Filippenko, A. V., & Chornock, R. 2011, MNRAS, 412, 1522 [NASA ADS] [CrossRef] [Google Scholar]
- Soker, N. 2019, Res. Astron. Astrophys., 19, 095 [Google Scholar]
- Spera, M., Mapelli, M., & Bressan, A. 2015, MNRAS, 451, 4086 [NASA ADS] [CrossRef] [Google Scholar]
- Spruit, H. C. 2002, A&A, 381, 923 [CrossRef] [EDP Sciences] [Google Scholar]
- Sravan, N., Marchant, P., Kalogera, V., & Margutti, R. 2018, ApJ, 852, L17 [NASA ADS] [CrossRef] [Google Scholar]
- Sravan, N., Marchant, P., & Kalogera, V. 2019, ApJ, 885, 130 [NASA ADS] [CrossRef] [Google Scholar]
- Sravan, N., Marchant, P., Kalogera, V., Milisavljevic, D., & Margutti, R. 2020, ApJ, 903, 70 [NASA ADS] [CrossRef] [Google Scholar]
- Sukhbold, T., & Woosley, S. E. 2014, ApJ, 783, 10 [NASA ADS] [CrossRef] [Google Scholar]
- Sukhbold, T., Ertl, T., Woosley, S. E., Brown, J. M., & Janka, H.-T. 2016, ApJ, 821, 38 [Google Scholar]
- Tur, C., Heger, A., & Austin, S. M. 2007, ApJ, 671, 821 [NASA ADS] [CrossRef] [Google Scholar]
- Van Dyk, S. D., Li, W., Cenko, S. B., et al. 2011, ApJ, 741, L28 [Google Scholar]
- Van Dyk, S. D., Zheng, W., Maund, J. R., et al. 2019, ApJ, 875, 136 [Google Scholar]
- van Loon, J. T. 2006, ASP Conf. Ser., 353, 211 [NASA ADS] [Google Scholar]
- Vartanyan, D., Burrows, A., & Radice, D. 2019, MNRAS, 489, 2227 [NASA ADS] [CrossRef] [Google Scholar]
- Vartanyan, D., Laplace, E., Renzo, M., et al. 2021, ApJ, 916, L5 [NASA ADS] [CrossRef] [Google Scholar]
- Vink, J. S., de Koter, A., & Lamers, H. J. G. L. M. 2000, A&A, 362, 295 [Google Scholar]
- Vink, J. S., de Koter, A., & Lamers, H. J. G. L. M. 2001, A&A, 369, 574 [NASA ADS] [CrossRef] [EDP Sciences] [Google Scholar]
- Yoon, S.-C., Woosley, S. E., & Langer, N. 2010, ApJ, 725, 940 [Google Scholar]
- Yoon, S.-C., Dierks, A., & Langer, N. 2012, A&A, 542, A113 [NASA ADS] [CrossRef] [EDP Sciences] [Google Scholar]
- Yoon, S.-C., Dessart, L., & Clocchiatti, A. 2017, ApJ, 840, 10 [NASA ADS] [CrossRef] [Google Scholar]
- Zapartas, E., de Mink, S. E., Van Dyk, S. D., et al. 2017, ApJ, 842, 125 [CrossRef] [Google Scholar]
All Tables
Minimum initial mass for SN Ib/c and IIb candidate stars (Mmin, WR and Mmin, IIb, respectively), their formation rate for each stellar simulation, and the fraction of them that successfully explode in SNe Ib/c and IIb, respectively, for different SN engines.
All Figures
|
Fig. 1. Final total mass (Mfinal; black), helium core mass (MHe; maroon), and carbon-oxygen core mass (MCO; blue) as a function of initial mass (Minitial) for our default grid (top) and our grid with winds boosted by a factor of 1.5 (bottom). We also depict the stellar models (white crosses) that we interpolate between. In the background, we shade the mass ranges for final stellar structures that could give rise to SNe IIb if they explode at collapse (with 0 < Menv ≤ 0.5 M⊙; light blue shading) and WR stars that may produce SNe Ib/c (with Menv = 0, blue shading). We also mark the models that lead to successful explosions, according to the FR12-rapid, FR12-delayed, S16-N20, S16−S19.8, P20E16+N20, and C20 SN engines (horizontal magenta, brown, gray, light green, light orange, and dark orange bands of arbitrary y value). In the inset plots we show the final envelope mass (Menv) for models with initial masses of 15−40 M⊙. |
| In the text | |
Current usage metrics show cumulative count of Article Views (full-text article views including HTML views, PDF and ePub downloads, according to the available data) and Abstracts Views on Vision4Press platform.
Data correspond to usage on the plateform after 2015. The current usage metrics is available 48-96 hours after online publication and is updated daily on week days.
Initial download of the metrics may take a while.