| Issue |
A&A
Volume 655, November 2021
|
|
|---|---|---|
| Article Number | A6 | |
| Number of page(s) | 25 | |
| Section | Stellar structure and evolution | |
| DOI | https://doi.org/10.1051/0004-6361/202141017 | |
| Published online | 28 October 2021 | |
Gas and dust from extremely metal-poor AGB stars
1
INAF, Observatory of Rome, Via Frascati 33, 00077 Monte Porzio Catone (RM), Italy
e-mail: This email address is being protected from spambots. You need JavaScript enabled to view it.
2
INAF, Astrophysics and Space Science Observatory, Via Piero Gobetti 93/3, 40129 Bologna, Italy
3
Dipartimento di Matematica e Fisica, Università degli Studi Roma Tre, Via della Vasca Navale 84, 00100 Roma, Italy
4
Kavli Institute for the Physics and Mathematics of the Universe, Todai Institutes for Advanced Study, the University of Tokyo, Kashiwa, 277-8583 (Kavli IPMU, WPI), Japan
5
INFN. Sezione di Perugia, via A. Pascoli s/n, 06125 Perugia, Italy
6
INAF – Istituto di Astrofisica e Planetologia Spaziali, Via Fosso del Cavaliere 100, 00133 Roma, Italy
7
Dipartimento di Fisica e Astronomia ‘Galileo Galilei’, Università di Padova, Vicolo dell’Osservatorio 3, 35122 Padova, Italy
8
Konkoly Observatory, Research Centre for Astronomy and Earth Sciences, Konkoly Thege Miklós út 15-17, 1121 Budapest, Hungary
9
ELTE Eötvös Loránd University, Institute of Physics, Pázmány Péter sétány 1/A, Budapest 1117, Hungary
10
School of Physics and Astronomy, Monash University, Clayton, VIC 3800, Australia
11
Nordita, KTH Royal Institute of Technology and Stockholm University Hannes Alfvens väg 12, 114 21 Stockholm, Sweden
12
Instituto de Astrofisica de Canarias (IAC), 38200 La Laguna, Tenerife, Spain
13
Departamento de Astrofisica, Universidad de La Laguna (ULL), 38206 La Laguna, Tenerife, Spain
Received:
7
April
2021
Accepted:
9
August
2021
Abstract
Context. The study of stars that evolve through the asymptotic giant branch (AGB) proves crucial in several astrophysical contexts because these objects provide important feedback to the host system in terms of the gas that is poured into the interstellar medium after being exposed to contamination from nucleosynthesis processes, and in terms of the dust that forms in their wind. Most of the studies conducted so far have been focused on AGB stars with solar and sub-solar chemical composition, whereas the extremely metal-poor domain has been poorly explored.
Aims. We study the evolution of extremely metal-poor AGB stars with metallicities down to [Fe/H] = −5 to understand the main evolutionary properties and the efficiency of the processes able to alter their surface chemical composition, and to determine the gas and dust yields.
Methods. We calculated two sets of evolutionary sequences of stars in the 1−7.5 M⊙ mass range that evolved from the pre-main sequence to the end of the AGB phase. To explore the extremely metal-poor chemistries, we adopted the metallicities Z = 3 × 10⁻⁵ and Z = 3 × 10⁻⁷, which correspond to [Fe/H] = −3 and [Fe/H] = −5, respectively. The results from stellar evolution modelling were used to calculate the yields of the individual chemical species. We also modelled dust formation in the wind to determine the dust produced by these objects.
Results. The evolution of AGB stars in the extremely metal-poor domain we explored proves highly sensitive to the initial mass of the star. M ≤ 2 M⊙ stars experience several third-dredge-up events, which favour the gradual surface enrichment of 12C and the formation of significant quantities of carbonaceous dust, ∼0.01 M⊙. The 13C and nitrogen yields are found to be significantly smaller than in previous explorations of low-mass metal-poor AGB stars because the proton ingestion episodes experienced during the initial AGB phases are weaker. M ≥ 5 M⊙ stars experience hot bottom burning, and their surface chemistry reflects the equilibria of a very advanced proton-capture nucleosynthesis; little dust production takes place in their wind. Intermediate-mass stars experience both third dredge-up and hot bottom burning: they prove efficient producers of nitrogen, which is formed by proton captures on 12C nuclei of primary origin dredged up from the internal regions.
Key words: stars: abundances / stars: AGB and post-AGB / stars: evolution
© ESO 2021
1. Introduction
The past decades have witnessed a growing interest in the evolution of the stars that evolve through the asymptotic giant branch (AGB). This evolutionary phase, which follows core helium burning and precedes the white dwarf cooling, is crossed by all stars with an initial mass in the 0.8−8 M⊙ range. The exact values of the threshold mass limits are sensitive to the metallicity and to the still-debated extension of the convective core during the main-sequence phase.
Asymptotic giant branch stars have attracted the interest of the astrophysical community because of the important role they play in different contexts, such as the chemical evolution of the Milky Way (Romano et al. 2010), the chemical patterns observed in star-forming galaxies in the Local Universe (Vincenzo et al. 2016), the formation of multiple populations in globular clusters (Ventura et al. 2001; D’Ercole et al. 2008), and the contribution to the overall dust budget in the Local Universe and at high redshift (Valiante et al. 2009). Important areas in which AGB stars have proven useful include inferring the masses of galaxies at high redshifts, owing to their high infrared luminosities (Maraston et al. 2006), and the interpretation of the chemical composition of planetary nebulae (Ventura et al. 2015).
Various research groups have decided to develop libraries of AGB models, which provide the evolution of the main physical and chemical properties of the stars as they evolve through the AGB and global quantities, such as the gas yields. The most widely used libraries include the FRUITY database (Cristallo et al. 2011, 2015) and the MONASH models (Karakas 2010, 2014; Karakas & Lattanzio 2014; Karakas & Lugaro 2016).
After the potential role of AGB stars as important dust manufactures was proposed, some research groups included the description of dust formation in the winds of AGB stars. This opened the possibility of simulating the evolution of the spectral energy distribution at infrared wavelengths and to provide dust yields from stars of different masses and metallicities (Ventura et al. 2012, 2014b, 2018; Dell’Agli et al. 2019; Nanni et al. 2013, 2014). These models have recently been used to characterise the evolved stellar populations of the Magellanic Clouds (Dell’Agli et al. 2014a; Dell’Agli et al. 2014b; Dell’Agli et al. 2015a; Dell’Agli et al. 2015b; Nanni et al. 2016, 2018, 2019; Nanni 2019) and of Local Group galaxies (Dell’Agli et al. 2016; Dell’Agli et al. 2018; Dell’Agli et al. 2019).
A feature common to all the studies conducted so far is the fact that they are limited to stars of metallicity above 10−4, with the only exceptions of an early exploration by Campbell & Lattanzio (2008, CL08), who studied M < 3 M⊙ stars in the very metal-poor domain down to almost zero metallicity, and the recent work by Gil-Pons et al. (2021, GP21), who presented detailed models of M > 3 M⊙ stars of metallicity Z = 10−5. AGB models in the extremely metal-poor domain are scarce because it is difficult to obtain observations of very low-metallicity evolved stars and these computations are intrinsically difficult, considering that the number of thermal pulses (TP) experienced is much higher than in the metal-rich counterparts (Lau et al. 2008) and the occurrence of hard-to-model phenomena, such as dual-shell flashes (Campbell & Lattanzio 2008).
Nevertheless, the availability of extremely metal-poor AGB models is highly important in the context of galactic archaeology because the comparison between theoretical gas yields and the observations of carbon-enhanced metal-poor (CEMP) stars in the halo and dwarf galaxies might shed new light on the chemistry of the early Universe. Furthermore, the gas yields from stars in the very metal-poor domain would be a valuable input for the chemical evolution models, which can currently only rely on AGB models with [Fe/H] > −2.15. This is a major limitation, especially for studies of the most metal-poor galaxies known, namely, the ultrafaint dwarf galaxies (UFDs), which are now found in high numbers in and around the haloes of larger galaxies such as the Milky Way and Andromeda. The bulk of the stars in the UFDs have metallicities between [Fe/H] = −3.2 and [Fe/H] = −2.0 (Simon 2019). This piece of observational evidence, combined with theoretical expectation that low- and intermediate-mass star formation is favoured in UFDs at the expense of massive stars (Yan et al. 2020) makes it clear why detailed modelling of extremely metal-poor AGB stars is much needed.
The main motivation of this work is to fill this gap by presenting detailed results from AGB modelling, extended to extremely metal-poor chemistries. We calculated a set of models of metallicity Z = 3 × 10⁻⁵, which corresponds to [Fe/H] = −3. This is the lowest chemical composition currently available in the database of massive stars presented by Limongi & Chieffi (2018, hereafter LC18), which for the first time allows presenting gas yields from chemically homogeneous model stars spanning the 1−120 M⊙ mass range. To explore lower metallicities and to understand the trend of the stellar properties and of the gas and dust yields with metallicity, we also present a set of Z = 3 × 10⁻⁷ AGB model stars.
The paper is organised as follows: the numerical ingredients we used to calculate the stellar evolutionary sequences and to model dust formation, and the physical assumption we adopted in the computations are given in Sect. 2. The evolutionary phases before the AGB and the AGB phase itself are discussed in Sects. 3 and 4, respectively. The gas yields are commented on in Sect. 5. In Sect. 6, the results obtained in this work are compared with previous investigations available in the literature. The relevance of our study for the interpretation of the chemical composition of CEMP stars is discussed in Sect. 7. The dust budget of the AGB stars is discussed in Sect. 8. Finally, the conclusions are given in Sect. 9.
2. Physical and numerical input
2.1. Stellar evolution modelling
The stellar models presented and discussed in this work were calculated by means of the ATON code for stellar evolution (Ventura et al. 1998). An exhaustive description of the numerical details of the code and the most recent updates can be found in Ventura et al. (2013). We recall the physical and chemical input most relevant for the results obtained in this work.
2.1.1. Chemical composition
We calculated two sets of models with metallicities Z = 3 × 10⁻⁵ and Z = 3 × 10⁻⁷. The initial helium mass fraction was assumed Y = 0.25 in both cases. We used the solar mixture by Asplund et al. (2009), with the exception of the distribution of 12C and the α−elements, which were taken from Cayrel et al. (2004). With these assumptions, the two metallicities given above correspond to [Fe/H] = −3, −5.
The evolutionary sequences were run from the pre-main sequence to the late phases, preceding the begin of the post-AGB phase. Low-mass models (M < 2 M⊙) experiencing the helium flash were evolved from the horizontal branch, starting from the core mass and surface chemical composition calculated until the tip of the red giant branch (RGB).
2.1.2. Equation of state
Tables of the equation of state were generated in the (gas) pressure-temperature plane, according to the OPAL EOS (2005). They were overwritten in the pressure-ionisation regime by the EOS by Saumon et al. (1995) and were extended to the high-density, high-temperature domain according to the treatment by Stolzmann & Blöcker (2000).
2.1.3. Convection
The temperature gradient within regions unstable to convection was calculated through the full spectrum of turbulence (FST) model (Canuto & Mazzitelli 1991). Overshoot of convective eddies within radiatively stable regions was modelled by assuming that the velocity of convective elements decays exponentially beyond the neutrality point, fixed with the Schwartzschild criterion. The overshoot scale (hereinafter OS), that is, the e-folding distance of the velocity decays during the core-burning (hydrogen and helium) phases and during the AGB phase, was taken as 0.02HP and 0.002HP, respectively; HP is the pressure scale height at the formal convective border. The latter values reflect the calibrations discussed in Ventura et al. (1998) and Ventura et al. (2014b), respectively.
2.1.4. Mass loss
The mass-loss rate during the phases in which the star is oxygen rich was determined through the mass-loss period relation by Vassiliadis & Wood (1993). For carbon stars, we used the Vassiliadis & Wood (1993) recipe when C−O < 8.4. We indicate with C−O the carbon excess with respect to oxygen, defined as C−O = 12 + log[(n(C)−n(O))/n(H)], where n(X) is the abundance by number of species X, whereas for higher carbon excesses, we adopted the mass-loss description from the Berlin group (Wachter et al. 2002, 2008).
2.1.5. Opacities
The radiative opacities were calculated according to the OPAL release in the version documented by Iglesias & Rogers (1996). The molecular opacities in the low-temperature regime (T < 104 K) were calculated with the AESOPUS tool (Marigo & Aringer 2009). The opacities were constructed self-consistently by following the changes in the chemical composition of the envelope, particularly of the individual abundances of carbon, nitrogen, and oxygen.
2.1.6. Nuclear network
The nuclear network includes 30 elements (up to 31P) and 64 reactions. The rates of the 3α reactions were taken from Fynbo et al. (2005), those for the proton-capture process by 14N by Formicola et al. (2004). The other reactions were taken from the REACLIB dataset.
2.2. Dust production
We modelled the formation and growth of dust particles in the wind of AGB stars according to the schematisation proposed by the Heidelberg group (Ferrarotti & Gail 2006), similarly to previous works by our team (Ventura et al. 2012, 2014b, 2015; Ventura et al. 2016) and as was used in a series of papers by Nanni et al. (2013, 2014, 2016, 2018), Nanni (2019), and Nanni et al. (2020). All the relevant equations are collected in Ventura et al. (2012). We briefly describe the method below.
Dust particles are assumed to form and grow in the wind, which expands isotropically from the photosphere of the star. In carbon-rich environments, we consider the formation of solid carbon and silicon carbide (SiC), whereas in the winds of oxygen-rich stars, we assume that the dust species that form are silicates and alumina dust (Al2O3); solid iron is formed in either case. Each solid compound is characterised by a key species, defined among the least abundant of the chemical elements entering the formation reaction from gaseous molecules to solid particles: for the species considered here, the key species are silicon (silicates and SiC), carbon (solid carbon), aluminium (alumina dust), and iron (solid iron). Each dust species starts to form in the region in which the growth rate exceeds the vaporisation rate. The former is connected with the thermal velocity of the key species and the sticking coefficient, which represents the tendency of the gaseous molecules to stick to the already formed solid grains. The vaporisation rate depends on the thermodynamic properties of the dust species, mainly on the formation enthalpies of the solid compounds and of the gaseous molecules involved in the formation reaction (Ferrarotti & Gail 2006).
The dynamics of the wind is described by the momentum equation, where the acceleration is determined by the competition between gravity and radiation pressure acting on the newly formed dust grains. The coupling between grain growth and wind dynamics is given by the extinction coefficients, describing absorption and scattering of the radiation by dust particles. For the species considered here, the extinction coefficients were found by using the optical constants from Zubko et al. (1996) (amorphous carbon), Pegourie (1988) (SiC), Begemann et al. (1994) (alumina dust), Ossenkopf et al. (1992) (silicates), and Ordal et al. (1988) (solid iron).
The modelling of dust formation, as described above, allows determining the size reached by the grains of the various species, an estimate of the surface fraction of gaseous silicon, carbon, aluminium, and iron condensed into dust (see Eqs. (20)–(23) and (34)–(35) in Ferrarotti & Gail (2006)) and the dust production rate for each dust species. The latter depends on the gas mass-loss rate, the surface mass fractions of the chemical elements listed above, and the fraction of the latter species condensed into dust (see Sect. 5.2 in Ferrarotti & Gail 2006).
3. Evolutionary phases before the AGB
The main properties of the stellar models we present are listed in Table 1 and concern both the pre-AGB and the AGB phases. The different columns of Table 1 report the duration of the most important evolutionary phases and some quantities characterising the AGB evolution, such as the maximum luminosity reached, the variation in core mass, and the fraction of the AGB lifetime during which the star evolves as a C-star.
Main properties of the model stars for the (initial) mass range 1−7.5 M⊙ and metallicities Z = 3 × 10⁻⁵ (upper part of the table) and Z = 3 × 10⁻⁷ (lower part).
Before the beginning of the series of thermal pulses, all the model stars evolve across the two main core nuclear burning phases, whose timescale, as is evident from the numbers in the second and third column of Table 1, is sensitive to the stellar mass.
The duration of the core hydrogen-burning phase of the Z = 3 × 10⁻⁵ stars increases from τH ∼ 38 Myr for M = 7.5 M⊙ to τH ∼ 5.3 Gyr for M = 1 M⊙. All the stars with initial mass M ≥ 1.25 M⊙ develop a convective core, which disappears towards the final stages of core H-burning. Z = 3 × 10⁻⁷ stars evolve slightly faster, with τH spanning the 34.5 Myr–5.1 Gyr range for the same mass range.
The conditions under which helium is ignited in the core depends on the stellar mass, with M ≤ 1.5 M⊙ stars experiencing the helium flash, whereas their M ≥ 2 M⊙ counterparts undergoing quiescent helium burning. The duration of this evolutionary phase, τHe, exhibits a non-linear behaviour with the mass of the star. In the Z = 3 × 10⁻⁵ (Z = 3 × 10⁻⁷) case τHe first increases, from 72 (64) Myr for solar-mass stars to 120 (200) Myr, for 2 M⊙ (1.5 M⊙); in the higher-mass domain, τHe decreases with the mass of the star down to 4.1 (3.9) Myr for M = 7.5 M⊙.
The evolution of the surface chemistry of the stars can be potentially altered by the two dredge-up episodes, occurring during the RGB ascending (first dredge-up, hereafter FDU) and after the end of the core helium-burning phase (second dredge-up, SDU), when the surface convection penetrates inwards, reaching the internal regions of the star. The modification of the surface chemistry consequent to FDU and SDU are reported in Table 2 for all the stars considered.
Modification of the surface mass fractions of the individual species as a consequence of the first and second dredge-up episodes for model stars with a metallicity Z = 3 × 10⁻⁵ (upper part of the table) and Z = 3 × 10⁻⁷ (lower part of the table).
The effects of FDU are found in M ≤ 2 M⊙ stars, with the drop (∼20−30%) in the surface mass fraction of 12C and the parallel increase in the abundances of 13C (by a factor ∼2) and 14N (within a factor ∼3); contamination of the surface regions with CN-processed matter is confirmed by the depletion (by a factor ∼2) in the surface 15N. Traces of mild, full CNO processing are also found, with the enhancement of the surface 17O (at most by a factor ∼5) and the depletion of the surface 18O (∼30−50%) (the threshold mass of 2 M⊙ holds for the Z = 3 × 10⁻⁵ metallicity. In the Z = 3 × 10⁻⁷ case, the effects of the first dredge-up are found in M ≤ 1.5 M⊙ stars).
Unlike the first dredge-up episode, SDU is efficient in modifying the surface chemical composition of all the stars, particularly those of higher mass (Boothroyd & Sackmann 1999). The most noticeable effect of this event is the rise in surface helium, which increases by δY ∼ 0.02 in low-mass stars and reaches values as high as Y = 0.36 in the M ≥ 6 M⊙ domain. Regarding the species participating in the CNO nucleosynthesis, the increase in surface 14N (up to a factor ∼20 in the 7.5 M⊙ model star) and the depletion of surface 16O is remarkable, which is left practically unchanged by the FDU. Further species affected by the SDU are sodium, whose mass fraction increases by a factor ∼5 in the highest mass models, and 27Al, which becomes twice more abundant in the surface regions. The increase in the mass fraction of the latter species is mainly due to matter contaminated by proton captures by the heavy magnesium isotopes 25Mg and 26Mg, whose surface abundance is decreased by ∼10% as a consequence of SDU in stars with an initial mass above ∼4 M⊙. On the other hand, 24Mg is practically unaffected by the SDU.
The outcome of helium burning in the central regions of the stars is the formation of a CO core, which is supported by the pressure of degenerate electrons. In M ≥ 7 M⊙ stars, off-centre ignition of carbon in conditions of partial degeneracy takes place: the main episode of carbon burning is followed by the formation of a convective flame that moves inwards until it reaches the centre of the star, which causes the formation of an ONe core (Garcia-Berro & Iben 1994; Siess 2006; Doherty et al. 2010). The 7 M⊙ limit holds for Z = 3 × 10⁻⁵; in the Z = 3 × 10⁻⁷ case, off-centre carbon ignition takes place for M ≥ 6 M⊙. The stars that develop an ONe core experience a deep SDU event, which is commonly referred to as dredge-out. In this case, the ignition of a helium-burning shell, which follows the exhaustion of helium in the central zone, is accompanied by the formation of a convective region, which moves outwards until it merges with the descending convective envelope (Iben et al. 1997; Siess 2007). Unlike the classic SDU, the surface chemistry in this case is heavily affected by the results of helium-burning nucleosynthesis, which is reflected in a significant increase in the surface abundance of 12C.
After experiencing the SDU (or dredge-out in the stars experiencing carbon ignition), the stars will move to the next step of their evolutionary history, the AGB phase. This is characterised by a series of thermal pulses, with the shell ignition of helium in conditions of thermal instability (Schwarzschild & Härm 1965), and the gradual loss of the external envelope. One of the most relevant quantities for the AGB evolution is the core mass of the star (Paczyński 1970), defined as the mass of the H- and He-free region, whose initial value is reported in Col. 8 of Table 1 for all the model stars. We note the little variation of the (initial) core mass for stars experiencing the helium flash and the generally increasing trend with the mass of the star up to a value of the order of ∼1.3 M⊙ for the highest masses we investigated.
4. Evolution across the asymptotic giant branch
The variation in physical properties of the stars and the changes in the surface chemical composition taking place during the AGB phase are highly sensitive to the initial mass of the star (see e.g. Karakas & Lattanzio 2014). We introduce an approximate classification among a) low-mass stars (initial mass below 2 M⊙), whose surface abundance is only affected by third dredge-up (TDU), b) 2−5 M⊙ stars, which experience both TDU and hot bottom burning (HBB), and c) massive AGBs (M ≥ 5 M⊙), in which the surface chemical composition reflects the effects of HBB. In the following we discuss the evolution of the three groups separately. Our analysis is driven by the results shown in Figs. 1–3, where we report for three model stars that are taken as representative of each of the groups the variation in the most relevant chemical and physical properties. The evolutionary sequences for all the stars investigated in the present work are available online1.
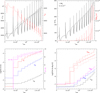 |
Fig. 1. Evolution of the 1.5 M⊙ model star with metallicity Z = 3 × 10⁻⁵ as a function of the time, counted from the beginning of the TP-AGB phase. The top-left panel reports the variation in luminosity (solid black scale on the left) and of the effective temperature (dashed red scale on the right). The evolution of the stellar radius (scale on the left) and of the mass-loss rate (scale on the right) are shown in the top right panel, as solid black and dashed red lines, respectively. The variation in CNO surface abundances is shown in the bottom left panels, where the different lines refer to the mass fractions of 12C (red), 14N (black), 16O (blue), and (C–O) (dashed magenta scale on the right; see text for the definition). The bottom right panel reports the variation in surface mass fractions of 22Ne (red line), 23Na (blue), 25Mg (magenta), and 27Al (black). The dotted (dashed) black line in the top left panel connects the luminosity values taken in the middle of each inter-pulse of a model star of the same initial mass and metallicity, calculated by assuming that during the AGB phase, the OS is a factor 2 lower (higher) than in the standard case. The same holds for the dotted and dashed magenta lines in the bottom left panel, indicating the evolution of the surface (C−O), and the red lines in the bottom right panel, which refer to the surface 22Ne. |
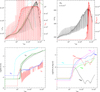 |
Fig. 2. Evolution of the 4 M⊙ model star with a metallicity Z = 3 × 10⁻⁵ as a function of the time, counted from the beginning of the TP-AGB phase. The top left panels reports the variation in luminosity (solid black track, scale on the left) and of the temperature at the base of the convective envelope (red lines, scale on the right), whereas the top right panel shows the evolution of the stellar radius (scale on the left) and of the mass-loss rate (red, scale on the right). The variation in CNO surface abundances is shown in the bottom left panels, where the different lines refer to the mass fractions of 12C (red), 14N (black), and 16O (blue). The bottom right panel reports the variation in surface mass fractions of various elements involved in the Ne-Na-Mg-Al-Si nucleosynthesis. The long-dashed and dotted-dashed green lines in the left panels refer to the evolution of the luminosity (top, left panel) and surface 14N (bottom, left) of a model star calculated by assuming a Blöcker (1995) mass-loss rate, with the free parameter entering the formula taken as ηR = 0.005 and ηR = 0.02, respectively. The dashed cyan lines in the same panels refer to the luminosity and the surface 14N of a model star calculated by doubling the OS. |
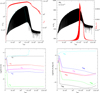 |
Fig. 3. Evolution of the 6 M⊙ model star with a metallicity Z = 3 × 10⁻⁵ as a function of the time, counted from the beginning of the TP-AGB phase. The top panels reports the same quantities as in the corresponding panels of Fig. 2, but the lines corresponding to the temperature at the bottom of the convective envelope and of the mass-loss rate refer to the inter-pulse phases for readability. The bottom panels, showing the variation in surface chemistry, use the same colour-coding as in Fig. 2. The dashed cyan lines in the left panels refer to the luminosity (top) and the surface 14N of a model star calculated by doubling the OS. |
4.1. Low-mass AGB stars
The evolution of low-mass stars in the metal-free or in the extremely metal-poor domain might be affected by violent episodes of proton ingestion, during which protons from the external regions of the star are transported into hot regions owing to the formation and expansion of convective zones, triggered by the ignition of helium burning. The first of these events occurs during the core He flash (Fujimoto et al. 2000), when the convective zone that formed at the ignition of the flash expands outwards until it reaches H-rich material. As a consequence, hydrogen is transported to regions of high temperature, which triggers an H flash and the split of the convective shell into two regions. During the following phases, the surface convective regions reach layers that were previously exposed to helium burning, so that the envelope is enriched in carbon and the star becomes a carbon star. As discussed in Sect. 2.1, we did not model the helium flash of low-mass stars, rather we resumed the computations from the HB; however, this is likely not a major issue for the results presented in the following, as Fujimoto et al. (1990) and Fujimoto et al. (2000) showed that the development of the double flash at the ignition of helium burning in the core occurs only in ultra-metal poor ([Fe/H] ≤ −8), M < 1 M⊙ stars (see also Fig. 4 in CL08), thus in a range of mass and metallicity that we did not explore.
Similar episodes related to violent ignition of hydrogen burning are found in stellar models of higher mass and metallicity during the AGB phase. In this case, the pulse-driven convective zone extends past the He/H discontinuity and transports H-rich material into hot regions of the star, where the violent ignition of hydrogen favours the occurrence of an H flash, concomitant with the He flash. In this case, the subsequent inward penetration of the envelope also reaches layers that are touched by 3α nucleosynthesis, with the consequent carbon enrichment of the surface. This physical mechanism is discussed in detail by CL08, who showed that such a deep mixing is expected to take place in M ≤ 3 M⊙ stars with a metallicity ([Fe/H] < −3). During these deep TDU events, very high neutron densities are attained, with the efficient activation of s-process nucleosynthesis (Cristallo et al. 2009; Fujimoto et al. 2000; Iwamoto et al. 2004; Suda et al. 2004; Choplin et al. 2021).
The core H flash taking place at the ignition of the helium flash and the violent ignition of hydrogen occurring during thermal pulses have the same physical origin. This origin is related to the significant expansion of the convective shell that formed as a consequence of thermally unstable ignition of helium that reaches regions of the star with some hydrogen, which is transported to hot regions. CL08 therefore proposed the name “dual-core flash” for both mechanisms.
Figure 1 shows the evolution of a model star of initial mass 1.5 M⊙ and metallicity Z = 3 × 10⁻⁵, in terms of the variation of luminosity, effective temperature, radius, mass-loss rate, and surface abundance of the CNO elements and other species involved in the Ne-Na and Mg-Al nucleosynthesis. As discussed previously, the evolution of low-mass AGB stars in the metal-poor domain we explored is characterised by the ingestion of protons from the envelope in the convective shell that formed as a consequence of the first TP, followed by a deep TDU episode, which causes the star to reach the C-star stage.
The luminosity, shown in the top left panel of Fig. 1, increases from ∼2000 L⊙ to ∼4500 L⊙ owing the growth in the core mass, which is the driver of this evolutionary phase. The results reported in the bottom left panel of Fig. 1 show that 16O is also dredged up to the surface after each TDU episode, although to a lower extent than 12C, and some 14N synthesised through proton capture in the upper regions of the pulse driven convective shell (Straniero et al. 1995). Further effects of TDU are the gradual increase in the surface mass fraction of other species involved in the α−capture nucleosynthesis activated at each TP, primarily 22Ne, 25Mg, and 26Mg, and of those synthesised by proton captures, mainly 23Na and 27Al (see the bottom right panel of Fig. 1).
The progressive increase in the overall surface metallicity caused by the repeated TDU events favours the general expansion of the external regions of the star. The stellar radius increases until it reaches a size of about 300 R⊙, as shown in the top right panel of Fig. 1. This is accompanied by a gradual cooling of the surface layers, with the effective temperature decreasing from ∼4700 K at the first TP to ∼3400 K during the final AGB phases. This is hown in the top left panel of Fig. 1.
The expansion of the star and the increase in luminosity determine a significant increase in the mass-loss rate, which is almost null during the first TP and increases until it reaches almost 10−5 M⊙ yr−1 at the very end of the AGB evolution (see the top right panel of Fig. 1). Unlike low-mass stars of higher metallicity, which experience significant mass loss since the first TP (Karakas 2010; Ventura et al. 2016), in the low-metallicity models we studied the mass-loss is initially negligible and only becomes relevant during the last two to three inter-pulse periods. This is due to the small surface opacity of these stars, which causes the stars to evolve at smaller radii than the higher-metallicity counterparts. They are therefore exposed to lower mass-loss rates. Only after a significant increase in the overall surface metallicity (primarily 12C) takes place does mass loss assume significant values.
An important consequence of this behaviour is that the average chemistry of the gas ejected by low-mass stars into the interstellar medium reflects the final surface chemical composition because almost the entire envelope is lost during the last two inter-pulse phases. The final surface C/O spans the 3–14 (6–24) range in low-mass AGBs with a metallicity Z = 3 × 10⁻⁵ (Z = 3 × 10⁻⁷) and is generally higher the lower the mass of the star. This apparently anomalous behaviour is motivated be the fact that stars of higher mass experience deeper TDU episodes, with the result that a significant increase in surface 16O takes place. The trend for surface 12C enrichment with mass is more straightforward, with M = 1 M⊙ stars ending up with surface mass fractions of about 0.005, 2 M⊙ stars reaching X(12C) ∼ 0.02, and 1.25−1.5 M⊙ stars exhibiting an intermediate behaviour.
The overall duration of the TP-AGB phase for this class of stars (see Table 1) is about 1 Myr. There is no clear trend between the initial mass of the star and the AGB timescales because the effect of the higher luminosities attained by higher-mass stars, which would shorten the evolutionary timescales, is compensated for by the higher mass of the envelope, which requires a higher number of TP before the external mantle is entirely lost.
4.2. Intermediate-mass AGBs
In this group we include the stars that experience both TDU and HBB, thus the variation in surface chemical composition is determined by the balance between these two mechanisms. The (initial) mass range spanned by these stars is 2 M⊙ < M < 5 M⊙ (2 M⊙ < M < 4 M⊙) for the Z = 3 × 10⁻⁵ (Z = 3 × 10⁻⁷) model stars. The lower limit is related to the fact that a minimum core mass of about 0.8 M⊙ is required to activate HBB (Ventura et al. 2013). On the other hand, stars with initial masses higher than the upper limit given above, which are discussed in the following sub-section, experience negligible TDU, thus their surface chemistry is almost entirely influenced by HBB.
Figure 2 reports the evolution of a 4 M⊙ model star with a metallicity Z = 3 × 10⁻⁵. The top panels show the most relevant physical quantities, that is, luminosity, temperature at the base of the envelope, stellar radius, and mass-loss rate, whereas the bottom panels show the change in the surface chemical composition.
The top left panel of Fig. 2 shows the typical imprinting of HBB, which favours a fast increase in luminosity (Blöcker & Schöenberner 1991). In this particular case, it rises to ∼7 × 10⁴ L⊙. The temperature at the base of the envelope rapidly grows to ∼108 K. The luminosity of the star, in analogy with higher-metallicity models undergoing HBB, decreases during the final AGB phases because the gradual loss of the envelope weakens the HBB, until it is completely turned of (see e.g. Ventura et al. 2013). This behaviour causes an overall contraction of the external regions, whose extension decreases to ∼400 R⊙ after reaching a peak value of ∼600 R⊙. It also causes a decrease in the mass-loss rate towards the end of the AGB phase.
From the variation in surface 12C, shown in the bottom left panel of Fig. 2, we deduce that TDU begins first, after 10 TP, whereas the effects of HBB appear 4-5 TP later. Initially, the surface of the stars becomes increasingly enriched in carbon, whereas during later phases, the 12C that is dredged up after each TDU is later converted into 14N by HBB. 16O is only marginally affected by HBB in this specific case, thus the effects of TDU are more relevant for this species, and the surface abundance of 16O gradually increases, eventually reaching values ∼20 times higher than the initial mass fraction. These stars never become carbon stars, and the final C/O ratios are below unity (see Table 1). As discussed in Iwamoto (2009, hereafter I09), for instance, the most relevant outcome of the TDU+HBB nucleosynthesis that we show in the bottom left panel of Fig. 2, is the remarkable increase in surface 14N. the final value is three orders of magnitude higher than the initial quantity. The freshly synthesised nitrogen is of primary origin because as stated previously, it is mostly produced by proton-capture reactions by 12C nuclei, produced in the 3α-burning shell.
The HBB temperatures are sufficiently high to activate the Mg-Al nucleosynthesis, as confirmed by the gradual depletion of the surface 24Mg shown in the bottom right panel of Fig. 2. This nuclear activity is reflected in a significant increase in the surface mass fraction of the two heavier magnesium isotopes and in the synthesis of 27Al and 28Si. Production of 23Na through proton capture by the 22Ne nuclei that were originally present in the surface regions of the star and by those transported to the surface by TDU also takes place (see the bottom right panel of Fig. 2). Some 28Si production occurs during the AGB lifetime, with an overall increase of about a factor 4.
To understand the chemistry of the gas ejected by this class of stars during the AGB lifetime, it is crucial to combine the results shown in the bottom panels of Fig. 2. The panels report the time variation in the chemical composition of the surface. The evolution of the mass-loss rate is reported in the top right panel of the same figure. Ṁ is sensitive to the period of the star, thus to the stellar radius. The latter quantity is heavily affected by the increase in surface metallicity and the parallel rise in the luminosity, which cause the star to assume an increasingly expanded configuration: the stellar radius steadily increases by a factor ∼3 from the beginning of the AGB phase until the luminosity peak is reached. As shown in the top right panel of Fig. 2, during the phases slightly before the luminosity peak, the mass of the envelope begins to be lost in a significant way. This process continues until the whole external mantle is consumed, with mass-loss rates in the 4 × 10⁻⁵ − 10−4 M⊙ yr−1 range: all the envelope is lost during the final about ten inter-pulse phases, after the surface chemistry was severely modified by the combined effects of TDU and HBB.
4.3. Massive AGB stars
We discuss the most massive of the stars that experience the AGB phase, whose surface chemistry reflects the effects of HBB, without a contribution from TDU. We refer to the stars of initial mass above ∼4 M⊙, including the objects that develop a core composed of oxygen and neon that we discussed in Sect. 3.
Similarly to the intermediate-mass stars discussed earlier in this section, the evolution of massive AGBs is characterised by the significant increase in overall luminosity, which starts with the ignition of HBB, and in the temperature at the base of the convective envelope. In the case reported in Fig. 3, a 6 M⊙ model star with Z = 3 × 10⁻⁵, the luminosity reaches L ∼ 1.5 × 10⁵ L⊙, whereas the temperature at the bottom of the envelope rises to almost 150 MK. Also similar to the lower-mass counterparts is the general behaviour of the luminosity, which decreases after reaching a peak value. This is owing to the gradual loss of the stellar envelope.
The most important difference with respect to the intermediate-mass model stars is that the overall surface metallicity is approximately constant and the relative distribution among the different species reflects the equilibria of the proton-capture nucleosynthesis experienced at the bottom of the convective envelope. This is of considerable importance for the evolution of the star because the low metallicity prevents a significant expansion of the external layers, keeping the radii of these stars comparable to those of the intermediate-mass counterparts presented in the previous section, despite the higher luminosities (this is visible in the comparison between the radius variations reported in the top right panels of Figs. 2 and 3). The behaviour of the radius is reflected in the mass-loss rates, which are extremely low until the peak luminosity is reached, with the consequence that the stars experience more TP before the envelope is entirely lost. The timescales of the TP-AGB phase of massive AGBs are consequently longer than those of slightly lower-mass stars experiencing TDU. This causes the local maximum in the values reported in Col. 5 of Table 1, found at 5 M⊙ (4 M⊙) for Z = 3 × 10⁻⁵ (Z = 3 × 10⁻⁷).
On the chemical side, the composition of the gas ejected by massive AGBs (see the bottom panels of Fig. 3) reflects the surface chemistry of the star during the final phases, characterised by extremely small quantities of 16O and 24Mg, exposed to strong depletion by proton-capture reactions at the base of the outer convective region: the final 16O and 24Mg are 2 and 4 orders of magnitude smaller than the initial abundances, respectively. 12C is also extensively destroyed by HBB, although the depletion factor, ∼10, is lower than that of 16O. This is the typical situation in the presence of a very hot CNO cycling. The idea that massive AGBs produce oxygen- and magnesium-poor ejecta was earlier explored by Ventura et al. (2013), who studied AGB models for a metallicity Z = 3 × 10⁻⁴, and by Siess (2010), who found strong signatures of 16O and 24Mg depletion in the ejecta of ∼8 M⊙ stars with a metallicity Z = 10−4. In this case, the situation is more extreme because the investigated metallicities are lower and the HBB temperatures are accordingly hotter.
These stars will evolve as carbon stars for almost the entire AGB phase because HBB is activated. This nuclear activity at the bottom of the envelope is reflected in an enhancement of the surface 14N, although the relative increase is significantly smaller than in the intermediate-mass stars because in this case, without a contribution from TDU, the 12C and 16O nuclei used to synthesise 14N are entirely of secondary origin.
For the other species, the temperatures of the internal regions of the convective envelope are so hot that they favour a very advanced nucleosynthesis. The mass fractions of the heavier magnesium isotopes, sodium and aluminium, are lower than the initial quantities, whereas some 28Si production takes place.
4.4. Overall view of the AGB evolution and the change in surface chemistry
The results discussed so far are presented in Figs. 1–3. They outline that the evolution of metal-poor AGBs is driven by various factors and is sensitive to the delicate interplay between the various mechanisms that can alter the surface chemistry. The onset of fast mass-loss is indeed driven by the metal enrichment of the surface regions, which leads to a rapid loss of the envelope, which ends the AGB phase (Marigo 2002; Constantino et al. 2014). We discuss below the role played by the mass of the star and the metallicity on the main aspects of the AGB phase and on the chemical composition of the gas ejected into the interstellar medium.
Figure 4 shows the variation in luminosity and in temperature at the bottom of the convective envelope during the AGB phase of stars of different initial mass and metallicity Z = 3 × 10⁻⁵ (left panels) and Z = 3 × 10⁻⁷ (right). The luminosity (reported in the top panels) and Tbce (bottom panels) are shown as a function of the core mass and of the current mass of the star, respectively.
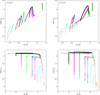 |
Fig. 4. Variation in luminosity of the model stars of metallicity Z = 3 × 10⁻⁵ (top left) and Z = 3 × 10⁻⁷ (top right) as a funnction of the core mass. The different lines refer to stars with an intial mass 1 M⊙ (orange), 1.5 M⊙ (grey), 2 M⊙ (cyan) 2.5 M⊙ (red), 3 M⊙ (blue), 4 M⊙ (light green), 5 M⊙ (magenta), 6 M⊙ (black), and 7.5 M⊙ (dark green). The dashed lines indicate the core mass – luminosity relation by Paczyński (1970). The bottom panels report the evolution of the temperature at the bottom of the convective envelope of the same model stars as shown in the top panels as a function of the current mass of the star. |
The luminosities span the 2 × 10³ − 2 × 10⁵ L⊙ range. The peak luminosities are higher with higher initial mass of the star. This reflects the well-known result of AGB evolution modelling: more massive stars evolve at higher luminosities because the core mass is higher.
The results shown in the bottom panels of Fig. 4 indicate that the temperature at the base of the surface convective regions, similarly to the luminosity, is extremely sensitive to the initial mass of the star. For both metallicities, the gap between M > 2 M⊙ stars, which experience HBB, is evident. They reach temperatures above 50 MK. Stars of lower mass evolve at Tbce below 30 MK.
The vertical trends visible in the first part of each track, particularly in the model stars exposed to HBB, correspond to the series of thermal pulses experienced during the initial and middle part of the AGB evolution, when the core mass and Tbce increase, while the mass remains approximately constant owing to the negligible mass-loss rates. In the Z = 3 × 10⁻⁷ case, we note that the Tbce versus initial mass trend presents a turning point around 5 M⊙, with the stars of higher mass evolving at cooler Tbce. This is because the luminosities of the most massive stars are so high that strong mass-loss occurs since the early AGB phases, which prevents significant growth in the core mass and prevents the convective envelope from reaching very high temperatures in the innermost layers.
To discuss the change in the surface chemical composition of metal-poor AGB stars, which is relevant for understanding the contamination of the interstellar medium expected from these sources, we report in Figs. 5 and 6 the behaviour of 14N, 16O, 27Al, and 28Si to focus on the species involved in the CNO cycling and in the Mg-Al nucleosynthesis, respectively. We again use the current mass of the star as abscissa to have an idea of the average chemical composition of the ejected gas.
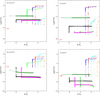 |
Fig. 5. Evolution of the surface mass fraction of nitrogen (top panels) and oxygen (bottom) as a function of the (current) stellar mass of the Z = 3 × 10⁻⁵ (left) and Z = 3 × 10⁻⁷ (right) model stars. The colour-coding is the same as in Fig. 4. Red arrows on the left side of each panel indicate the initial mass fractions. |
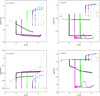 |
Fig. 6. Evolution of the surface mass fraction of 27Al (top panels) and 28Si (bottom) as a function of the (current) stellar mass of the Z = 3 × 10⁻⁵ (left) and Z = 3 × 10⁻⁷ (right) model stars. The colour-coding is the same as in Fig. 4. Red arrows on the left side of each pane indicate the initial mass fractions. |
The change in the surface 16O exhibits a dichotomous behaviour: the stars experiencing TDU produce oxygen during the AGB lifetime, whereas those exposed to HBB only destroy it, releasing gas that is almost oxygen free. The largest production of 16O, of about a factor ∼103 (105) in the Z = 3 × 10⁻⁵ (Z = 3 × 10⁻⁷) case, is found in the most massive models that do not experience HBB, because of the repeated TDU episodes that gradually increase the surface 16O. 14N is produced in all cases, with the largest enhancement, between 3 and 5 orders of magnitude, according to the metallicity, taking place in 2 M⊙ < M < 5 M⊙ stars, where the 12C that is dredged up to the surface is converted into 14N by HBB operating during the following inter-pulse phase.
The difference between the surface chemistry of models experiencing TDU and those suffering HBB alone is also clear in the evolution of the surface 27Al, shown in the top panels of Fig. 6. In the former model stars, 27Al is synthesised owing to the ignition of the Mg-Al nucleosynthesis at the base of the envelope, which starts with the depletion of the surface 24Mg and the dredge-up of 25Mg and 26Mg produced by α−capture nucleosynthesis during the TP (see the bottom right panel of Fig. 2). Conversely, massive AGBs experience a very advanced proton-capture nucleosynthesis in the innermost regions of the convective envelope, in such a way that the 27Al content of matter lost by the star is on the average lower than in the gas from which the star formed.
The behaviour of 28Si is extremely sensitive to mass and metallicity. The stars producing most 28Si are those experiencing both TDU and HBB. In the massive AGBs domain production of 28Si takes place through the activation of the Mg-Al-Si nuclosynthesis at the base of the envelope. For Z = 3 × 10⁻⁷, the temperatures of the HBB nucleosynthesis are so high that the gas ejecta are silicon poor.
4.5. Role of metallicity
The comparison of the results obtained for Z = 3 × 10⁻⁵ and Z = 3 × 10⁻⁷ and those published in previous investigations allow us to understand how the evolutionary properties of AGB stars are sensitive to the metallicity. Such an analysis was presented for the metal-poor domain by Dell’Agli et al. (2019, hereafter D19), whereas for higher metallicities, we refer to the studies by Ventura et al. (2013) and Ventura et al. (2018).
To facilitate comparison of the variation in the surface chemical composition of stars of different metallicity, we show in Fig. 7 the chemical composition of the ejecta, averaged over the whole AGB phase, of stars of different mass for the two metallicities investigated here and for the Z = 3 × 10⁻⁴ model stars discussed in D19. Overall, these results refer to a metallicity range extending over 3 orders of magnitude. The masses shown in the figure were chosen in order to represent the three groups discussed in Sects. 4.1–4.3.
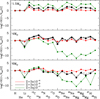 |
Fig. 7. Ratio of the average abundances of different chemical species in the ejecta of AGB stars with an initial mass 1.5 M⊙ (top panel), 4 M⊙ (middle panel), and 6 M⊙ (bottom panel) and the initial mass fractions. The different lines refer to the Z = 3 × 10⁻⁵ (black) and Z = 3 × 10⁻⁷ (green) model stars we investigated and to the Z = 3 × 10⁻⁴ (red) models published in D19. Dotted (dashed) lines in the panels refer to the results of Z = 3 × 10⁻⁵ models obtained by assuming an overshoot parameter a factor 2 lower (higher) than in the standard case. Long-dashed and dot-dashed lines in the middle panel indicate the results of the evolution of a 4 M⊙ model star with Z = 3 × 10⁻⁵, obtained by modelling mass loss according to Blöcker (1995) by assuming a value of the free parameter of ηR = 0.005 and ηR = 0.02, respectively. |
The threshold mass required to activate HBB in our metallicity domain is ∼2 M⊙, the same as for Z = 1−3 × 10⁻⁴ (Dell’Agli et al. 2019). This is consistent with the results obtained by CL08, who reported that 2 M⊙ model stars experience HBB for [Fe/H] ≤ −4. This threshold mass is significantly lower than in higher-metallicity model stars: recent studies showed that only M ≥ 3.5 M⊙ stars reach HBB conditions in the solar (Ventura et al. 2018), super-solar (Ventura et al. 2020), and slightly sub-solar (Ventura et al. 2014a) case, whereas for the Z = 10−3 chemistry, this mass threshold is ∼3 M⊙ (Ventura et al. 2013). These differences are connected with the higher steepness of the core mass versus initial mass relation in lower-metallicity stars because the threshold in the core mass required to activate HBB is ∼0.8 M⊙, almost regardless of the metallicity (Ventura et al. 2013).
D19 discussed the sensitivity of the strength of HBB to the metallicity, outlining that both Tbce and luminosity increase when Z decreases. The Tbce versus mass relation was shown to become increasingly steeper as Z decreases. The most massive AGBs reach temperatures at the base of the envelope above 140 MK during the AGB phase. Our results confirm this trend. The highest temperatures are Tbce ∼ 170 MK for Z = 3 × 10⁻⁵ and Tbce ∼ 195 MK Z = 3 × 10⁻⁷. Given the tight relation between Tbce and luminosity of the stars experiencing HBB, the peak luminosities are also correlated with metallicity, the highest values being 2.4 × 10⁵ L⊙ and 2.15 × 10⁵ L⊙ for the 7.5 M⊙ model star of metallicity Z = 3 × 10⁻⁷ and Z = 3 × 10⁻⁵, respectively (see Table 1).
The degree of the nucleosynthesis taking place at the bottom of the convective envelope, and consequently the variation in surface chemical composition, is sensitive to Tbce. The clearest effect of metallicity is shown in the bottom panel of Fig. 7, showing the average chemical composition of the gas expelled from stars with an initial mass of 6 M⊙, whose surface chemistry is determined almost exclusively by HBB. While the ejecta of Z = 3 × 10⁻⁴ stars are enriched in some of the species involved in the advanced p-capture nucleosynthesis, such as 23Na, 27Al, and 28Si, at lower metallicities, all the species from neon to silicon are destroyed by HBB. This is evident in the Z = 3 × 10⁻⁷ case and particularly in the behaviour of 24Mg, which is consumed almost in its entirely in the surface regions of the star. 12C and 16O are also exposed to proton capture when HBB is activated. The results regarding these species for the 6 M⊙ stars are less sensitive to the metallicity than the heavier elements, however, because of the effects of the dredge-out experienced by the 6 M⊙, Z = 3 × 10⁻⁷ star (see the discussion in Sect. 3), which increases the overall CNO and consequently the equilbrium abundances of all the CNO species. The lines corresponding to the different metallicities in the bottom panel of Fig. 7 are therefore extremely close, in correspondence with the CNO elements.
The results shown in the middle panel of Fig. 7 outline notable differences between the 4 M⊙ stars witha metallicity Z = 3 × 10⁻⁷ and the counterparts of same mass and higher Z. As in the case of 6 M⊙ stars discussed earlier, the ejecta of the most metal-poor model stars exhibit a far stronger signature of HBB. This is partly due to the hotter Tbces, but an additional reason for this difference is that the chemistry of the most metal-poor 4 M⊙ stars is only affected by HBB, whereas in the Z = 3 × 10⁻⁴ and Z = 3 × 10⁻⁵ cases, the action of TDU increases the mass fractions of the various chemical species we considered.
The evolution of the stars that do not experience HBB that we discussed in Sect. 4.1 is driven by the gradual enrichment in the surface 12C, which eventually leads to the formation of carbon stars. D19 found that 1−2 M⊙ stars evolved as carbon stars for a fraction of the AGB lifetime in the 50−75% range for metallicities Z = 1−3 × 10⁻⁴. Our results for the Z = 3 × 10⁻⁵ chemistry are similar to those of D19, whereas for the lowest metallicity Z = 3 × 10⁻⁷, we find slightly higher percentages because the initial fraction of 16O is smaller, which facilitates the achievement of the C-star stage.
In terms of carbon enrichment, we find consistently with D19 that the results are not particularly sensitive to the metallicity because the 12C that is dredged up to the surface is of primary origin, thus independent of Z. The different lines shown in the top panel of Fig. 7, reporting the production factor of the various species for the three metallicities analysed in our discussion, share the same trend. The values are higher the lower the metallicity. This is connected with the lower initial mass fractions of all the species but hydrogen and helium in lower-Z stars.
4.6. Effect of convection and mass-loss modelling
It is generally recognised that the results from AGB modelling are sensitive to the description of some physical phenomena that are still unknown from first principles. The two most relevant are convection and mass loss (Karakas & Lattanzio 2014).
In determining the convective temperature gradient, the FST modelling we adopted was shown to lead to stronger HBB conditions than in the results based on the mixing length theory (MLT), in the model stars achieving temperatures at the base of the envelope exceeding ∼30 MK (Ventura & D’Antona 2005a). In the metallicity domain explored here, this is reflected in initial masses above 2 M⊙. The nucleosynthesis at the bottom of the convective envelope experienced by model stars calculated by adopting MLT modelling for turbulent convection is less advanced than in their FST counterparts, which is also reflected in lower luminosities and slower evolution (Ventura & D’Antona 2005a). These arguments are reconsidered in Sect. 6, where our findings are compared with MLT-based computations form other research groups. No significant differences are expected between the FST and the MLT results for low-mass stars discussed in Sect. 4.1.
Still in the convection modelling context, a further source of uncertainty is associated with the treatment of convective borders. This source rules the extension of additional mixing, the depth of TDU, thus the amount of 12C and of material processed by helium-burning nucleosynthesis that is convected to the surface after each TDU event. In our computations, as discussed in Sect. 2.1, we adopted an OS lOV = 0.002HP, calibrated against the observations of carbon stars in the Magellanic Clouds (Ventura et al. 2014b).
To test how changes in this quantity are reflected in the results obtained in the low-mass stars domain, we ran evolutionary sequences of a 1.5 M⊙ model star based on lOV = 0.001HP and lOV = 0.004HP, which represents a change of a factor 2 with respect to the standard assumption. These results are indicated in Fig. 1 with dotted and dashed lines, which refer to the lOV = 0.001HP and lOV = 0.004HP cases, respectively. For readability, we only show the results regarding the luminosity and the surface (C−O) and 22Ne. A change in the assumed lOV is reflected in the extent of each TDU event, that is, in the amount of material that is transported to the surface regions after each TP. We find that doubling (halving) the OS results in a ∼40% increase (decrease) in the surface (C−O) and a factor 2 increase (decrease) in the 22Ne accumulated in the surface regions. For the other chemical species, we find ∼30% changes in the final abundances. The choice regarding lOV also affects the general evolution of the star because a deeper TDU decreases the core mass of the star, which therefore evolves at lower luminosities and consequently on slower timescales: this is shown in the top left panel of Fig. 1, where we note a clear difference between the various results. The luminosity increases faster in the lOV = 0.001HP case. These differences do not significantly affect the overall duration of the AGB phase, which are similar within 10% in the three cases, because, as discussed in Sect. 4.1, most of the mass is lost in the very final TPs.
The stars experiencing HBB are described in Sects. 4.2 and 4.3. The only additional case that we explore in the analysis of the effects of the treatment of convective borders is lOV = 0.004HP . We do not expect to find significant differences between the lOV = 0.001HP and lOV = 0.002HP cases because the TDU experienced by these stars was found to be extremely weak in the latter case, as discussed in Sect. 4.2. The finding with the lOV = 0.004HP assumption is indicated with dashed cyan lines in the left panels of Fig. 2 and in Fig. 3.
In the 4 M⊙ and 6 M⊙ cases, doubling the OS associated with the penetration of the convective bubbles into the radiatively stable regions favours a deeper TDU with respect to the standard case, with the transportation of larger quantities of 12C to the surface. The variation in surface 12C shows no significant difference between the two cases because of the action of HBB, which destroys the surface 12C through proton fusion. On the other hand, the production of 14N is enhanced by a factor ∼5, as we show in the bottom left panels of Figs. 2 and 3. The choice of more additional mixing from the borders of the convective zones also affects the general physical evolution of the stars because the increase in surface metallicity favours the expansion of the star and the rise in the mass-loss rate: the models calculated with a higher lOV evolve faster, and the overall duration of the AGB phase is ∼10% shorter. This is visible in the run of the luminosity, reported in the top left panels of Figs. 2 and 3
The description of mass loss is a great problem in AGB modelling because our knowledge of this physical mechanism and the relevant impact on the AGB evolution is poor (Ventura & D’Antona 2005b). Most of the calibrations presented so far are based on stars with a significantly higher metallicity than those explored here, which suggests that implications relative to a possible sensitivity of mass-loss on the chemical composition should be considered (Pauldrach et al. 1989). In the low-mass domain, the description of mass loss adopted here is at the same level of accuracy as for model stars of higher metallicity because these stars experience a significant increase in surface metallicity that is related to the effects of TDU. These effects enrich the external regions with primary carbon that is produced in the 3α burning shell. The surface metal enrichment is practically independent of metallicity, which has only an indirect effect that still was considered in the treatment by Wachter et al. (2008) that we adopted here. It is connected with the hotter effective temperatures of metal-poor stars when compared to the higher-Z counterparts. These stars produce large quantities of carbonaceous dust (see the discussion in Sect. 8) for most of their life. Their mass loss is accordingly driven by the radiation pressure effects on the dust grains, which is considered in the determination of the rates given by Wachter et al. (2008) that we used in our analysis.
The case of the stars experiencing HBB is more complicated. No significant increase in the overall metallicity takes place, as discussed in Sects. 4.2 and 4.3. We adopted the description by Vassiliadis & Wood (1993), consisting of a direct relation between Ṁ and pulsation period. This was found through an analysis of CO microwave observations of AGB stars. In this description, the metallicity of the star enters through the period, which is generally shorter the lower Z. An alternative description of mass loss of bright AGB stars is given by Blöcker (1995), based on dynamical models of the winds of M-type stars. To explore the sensitivity of the results on the mass-loss description, we considered two 4 M⊙ models based on the Blöcker (1995) treatment of mass loss, in which the free parameter entering the Blöcker (1995) formula was taken as ηR = 0.005 and ηR = 0.022. These results are shown in Fig. 2 as dot-dashed green (ηR = 0.02) and long-dashed (ηR = 0.005) lines.
The results obtained with the Blöcker (1995) description are found to bracket those obtained with the Vassiliadis & Wood (1993) treatment. The ηR = 0.02 model experiences a significantly higher mass-loss rate than the Vassiliadis & Wood (1993) counterpart. This is an effect of the steep sensitivity of Ṁ on the luminosity of the star included in the Blöcker (1995) formula. As a consequence, the peak luminosity is ∼30% lower and the TP-AGB phase is ∼30% shorter. The variation in surface chemistry is also affected by the consumption of the envelope, which is faster because the number of TDU events is smaller. This does not affect the species that are exposed to proton captures during HBB, such as 12C, but has serious consequences for the species that are synthesised when HBB is activated, such as 14N, whose final surface mass fraction is ∼30% lower than in the Vassiliadis & Wood (1993) case. In stars of higher mass, we do not expect significant dissimilarities on the chemical side because their chemistry is almost entirely determined by HBB, with little contribution from TDU. On the other hand, when ηR = 0.005 is assumed in the Blöcker (1995) recipe, the mass-loss rates are generally lower than in the Vassiliadis & Wood (1993) case and the evolutionary timescales are longer. The difference is within ∼30%. The HBB is slightly stronger, but the main effect on the surface chemistry is once more due to the higher production of primary nitrogen, related to the higher number of TDUs: the final 14N is ∼50% higher than in the Vassiliadis & Wood (1993) case.
It is important to underline that while these numerical explorations can provide a broad estimate of how our results are sensitive to the mass-loss description, the Blöcker (1995) description can be hardly be applied to massive AGBs in the metallicity domain that we explored: the Blöcker (1995) prescription is based on dynamical models of the winds of massive AGB stars, which considers the effects of radiation pressure on the dust particles. In our context, however, very poor dust formation is expected to take place in the circumstellar envelope of M-type stars because gaseous silicon is scarce.
5. Gas yields
We discuss the yields of the different chemical species of the model stars. We followed the classical definition of the stellar yield, that is, the yield of a given element i is the net amount of a newly produced element that is ejected in the interstellar medium by a star during its life:
![Mathematical equation: $$ \begin{aligned} Y_i=\int {[X_i-X_i^\mathrm{init}]}\dot{M} \mathrm {dt.} \end{aligned} $$](/articles/aa/full_html/2021/11/aa41017-21/aa41017-21-eq1.gif)
The integral is calculated over the entire stellar lifetime,  is the mass fraction of species i at the beginning of the evolution, and Ṁ is the mass-loss rate. If the element is destroyed in the stellar interior, then the yield is negative. The yields for the main chemical species of all the model stars presented in this work are available online3.
Figures 8 and 9 show the gas yields of the models presented here as a function of the initial mass of the star. We also show the yields from massive stars presented by LC18, which were evolved from the same chemical composition as the Z = 3 × 10⁻⁵ models investigated here. This allows a more exhaustive analysis on the relative impact of stars of different mass on the chemical evolution of the host galaxy. LC18 presented an exhaustive discussion of the role of rotation on the internal mixing of massive stars and the related effects on the gas yields by comparing results obtained by varying the assumed equatorial velocity from zero to 300 Km s−1. The results reported in Figs. 8 and 9 are given in terms of the range of values of the yields of a star of a given mass corresponding to different rotational velocities.
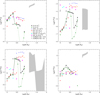 |
Fig. 8. Yields (solar masses, see the definition in Sect. 5) of the chemical species involved in CNO cycling are shown as a function of the initial mass of the star for the metallicities Z = 3 × 10⁻⁵ (black points) and Z = 3 × 10⁻⁷ (green squares). The corresponding yields from GP21, Karakas (2010), and Doherty et al. (2014) are indicated with blue triangles, red diamonds, and orange crosses, respectively. Shaded areas on the right side of the panels indicate the values covered by the yields from Limongi & Chieffi (2018) for different initial rotation velocities. The values of the mass for which the points or the shadowing is missing indicate that the corresponding yields are negative. |
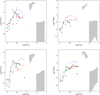 |
Fig. 9. Yields of sodium (top, left panel), 24Mg (top right), 27Al (bottom left), and 28Si (bottom right) as a function of the initial mass of the star. The symbols and the colour-coding are the same as in Fig. 8. |
5.1. CNO yields
The yields reported in Fig. 8 refer to the CNO species. In the low-mass domain, the 12C yields (see the top left panel of the figure) of the AGB stars exhibit a growing trend with initial mass of the star, ranging from a few 10−3 M⊙ for 1 M⊙ stars to almost 0.1 M⊙ for 2 M⊙ stars because the number of TPs, hence of the TDU events that take place during the AGB phase, is higher the higher the initial mass of the star. We note that the 12C yields are not particularly sensitive to the metallicity in this mass domain because the 12C that is dredged up from the helium-burning shell is of primary origin and is much larger than the 12C quantity (and more generally, than the overall C+N+O) that is initially present in the star.
The sudden drop in the 12C yields for M > 2 M⊙ is connected with the ignition of HBB, which destroys the surface carbon. For the massive AGB stars, the 12C yields are negative because the HBB equilibria are shifted to 12C mass fractions lower than in the gas from which the stars formed. This is visible in the time variation of the surface 12C of the 6 M⊙ model star, for instance, shown in the bottom left panel of Fig. 3. This trend is reversed at M ≥ 7 M⊙ because as discussed in Sect. 3, these stars experience the dredge-out mechanism, which favours a significant increase in surface 12C during the phases preceding the series of thermal pulses: the 12C yields are positive in this mass domain, with numerical values of about 10−5 − 10−4 M⊙, much lower than in M < 2 M⊙ stars. The action of HBB causes the drop in the 12C yields, thus interrupting the growing trend with mass, which would ideally connect the yields of M ≤ 2 M⊙ stars with those from 13−25 M⊙ stars calculated by LC18, which span the 0.2−1 M⊙ range.
The trends with mass of the yields of 13C and 14N are similar. For both elements, the largest yields of about 10−4 M⊙ and ∼0.02 M⊙, respectively, are provided by the intermediate-mass stars, which experience both TDU and HBB. For 14N, these findings are fully consistent with the results shown in the top panels of Fig. 5. The quoted values are not sensitive to the metallicity even in this case because the chain of reactions leading to the synthesis of 13C and 14N begins by proton captures on 12C nuclei. These are mostly of primary origin at the low metallicities we considered. In the domain of massive AGBs, the metallicity is more relevant because these stars experience negligible TDU, thus the equilibrium abundances of the various species are mainly sensitive to the initial overall C+N+O (see again top panels of Fig. 5). The rise in the trend of the 13C (top right panel of Fig. 8) and 14N (bottom left panel) yields with mass, which is seen in the domain of massive AGBs, is due to the occurrence of dredge-out, which increases the overall C+N+O in the surface regions and thus causes higher equilibrium abundances of the CNO species during the AGB phase.
The 14N yields of the intermediate-mass models presented here are within the range of values of those of the 13−25 M⊙ model stars by LC18. The 14N yields of the non-rotating models by LC18 are ∼2 orders of magnitude lower than those reported here, whereas the yields corresponding to the rotating models, of about 0.1 M⊙, are a factor of ∼10 higher. The same holds for 13C, with the difference that the gap between the largest yields by LC18 and those presented here is reduced to a factor ∼2.
The 16O yields can also be interpreted on the basis of the efficiency of the physical processes that can change the surface chemistry, and are consistent with the results shown in the bottom panels of Fig. 5. Some 16O production occurs in the low-mass domain owing to the dredge-up of oxygen nuclei from the 3α burning shell. The largest yields, slightly above 10−2 M⊙, are produced by ∼2 M⊙ stars (see the cyan tracks in the bottom panels of Fig. 5). On the other hand, the 16O ejecta of massive AGBs are oxygen poor. The gas from Z = 3 × 10⁻⁷ stars is almost oxygen free. As expected, the 16O yields, ∼0.01 M⊙ at most, are much lower than the corresponding yields of the 13−25 M⊙ model stars by LC18, which are higher than 1 M⊙ on average.
5.2. Sodium
We now turn to the chemical species that are not involved in CNO cycling. We start with sodium, whose yields are shown in the top left panel of Fig. 9. The surface sodium is extremely sensitive to the relative importance of the different mechanisms that can modify the surface chemical composition. The effects of HBB on the surface sodium change according to the temperature at the base of the envelope: when Tbce < 70 MK, sodium is produced through proton capture by 22Ne nuclei, whereas for higher temperatures, sodium is destroyed because the destruction channel through proton capture prevails (Mowlavi 1999). Therefore the 23Na yields exhibit a positive trend with mass only in the M < 3 M⊙ mass domain, with the maximum yield being slightly above 10−4 M⊙. In higher-mass stars, the temperatures at the base of the envelope are hotter than the 70 MK threshold given above (see the bottom panels of Fig. 4 and the values of the highest temperatures reached, reported in Col. 7 of Table 1), thus the trend with mass is reversed and the sodium yields are eventually negative. In all the model stars with initial mass M < 5 M⊙, which experience several TDU events, most of the sodium is indeed of primary origin because a large fraction of the 22Ne converted into sodium is produced by a chain of reactions taking place in the 3α burning shell that is formed at the ignition of each thermal pulse. Compared to LC18, the sodium yields presented here are systematically smaller than those corresponding to the 12−25 M⊙ stars: the largest yields of sodium, corresponding to 2.5 M⊙ stars, are between 2 and ∼30 times smaller than in LC18.
5.3. Elements involved in the Mg-Al-Si chain
The very advanced degree of the nucleosynthesis experienced by intermediate and massive AGB stars in the extremely low-metallicity domain investigated here is even more evident in the behaviour of the yields of 24Mg, 27Al, and 28Si, shown in the top right, bottom left, and bottom right panels of Fig. 9, respectively. For 24Mg and 27Al, the yields become negative in the M > 3 M⊙ mass domain, whereas for 28Si, this behaviour is found only in the lowest-metallicity models.
The yields for 24Mg and 28Si presented here are ∼3 orders of magnitude smaller than the 12−25 M⊙ stars by LC18. Conversely, the 27Al yields of 2−5 M⊙ stars, of about 10−4 M⊙, fall inside the range of values spanned by the LC18 models and are ∼20 times smaller than the highest values of the LC18 work.
5.4. Need for gas yields from extremely metal-poor low- and intermediate-mass stars
As mentioned in the Introduction, detailed yields for extremely metal-poor stars such as those we present are especially useful for studying the chemical evolution of small galaxies. The metallicity of large galaxies such as the Milky Way increases fast, and only a few LIMS are formed with Z ≤ 10−5. Their effects on the global galactic evolution are therefore almost negligible. In small galaxies, on the other hand, the less efficient star formation, together with a galaxy-wide IMF likely skewed in favour of low- and intermediate-mass stars means that the extremely metal-poor low- and intermediate-mass stars have non-negligible effects on the evolution of particular elements.
For example, in Fig. 10 we show the predicted evolution of the nitrogen-to-oxygen abundance ratio in the interstellar medium of a dwarf galaxy with a stellar mass of ∼2 × 10⁶ M⊙. The adopted chemical evolution model is an updated version of the model used in Romano & Starkenburg (2013) and Romano et al. (2015) to describe the evolution of the Sculptor dwarf spheroidal and Böotes I ultrafaint dwarf, respectively. Here, it is not used to follow the evolution of a specific galaxy; rather, it is only used for illustration purposes. The modelled dwarf galaxy forms stars with a low efficiency (ν = 0.25 Gyr−1) according to a Kennicutt-Schmidt star formation law,  , with k = 1 (see Romano et al. 2015, their Sect. 3.1, for details). The dashed (red) line shows the results in the log(N/O)–log(O/H)+12 plane that are obtained assuming the same nucleosynthesis prescriptions as model MWG-11 of Romano et al. (2019), that is, the yields of Ventura et al. (2013, 2020) for low- and intermediate-mass stars and those of LC18 for massive stars (which are assumed to rotate fast below [Fe/H] = −1 dex and do not rotate at all above this metallicity threshold). The solid (black) line is the very same model, implementing the yields for AGB stars we presented for Z < 0.0003 (Z = 0.0003 was the lowest metallicity value considered by Ventura et al. 2013). Including the new yields, specifically referring to the most metal-poor stars, clearly produces sizeable effects on the model predictions, that is, log(N/O) values ∼0.1 dex higher are expected in the interstellar medium at the end of the evolution. For illustration purposes, the green squares in Fig. 10 show the spread in log(N/O) data for dwarf irregular galaxies. It appears that part of the spread could be due to the presence or absence of a sizeable fraction of low- and intermediate-mass stars that formed at the lowest metallicities as a consequence of the different histories of mass assembly and star formation in the different galaxies, which are likely to follow very different evolutionary paths (see e.g. Tolstoy et al. 2009).
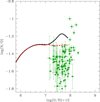 |
Fig. 10. Evolution of the N/O abundance ratio in a dwarf galaxy with stellar mass 2 × 10⁶ M⊙, modelled according to the method documented in Romano & Starkenburg (2013) and Romano et al. (2015) (see text for details of the various assumptions). The dashed red line indicates the results obtained by Romano et al. (2019), who extrapolated the yields of very metal-poor low- and intermediate-mass stars from those corresponding to the higher-metallicity counterparts (Z = 3 × 10⁻⁴). The black lines refers to the results obtained when our yields are considered. Green squares with error bars are data for low-mass star-forming galaxies from Berg et al. (2012) and Izotov et al. (2012). |
Finally, it is important to stress that our considerations above are based on the outputs of galactic chemical evolution models that assume instantaneous recycling approximation (IRA). Hydrodynamical simulations that take the inhomogeneities of the interstellar medium (see, e.g., Emerick et al. 2020) into account could come to different conclusions, especially regarding the effect of the yield sets we presented on the early evolution of the Galactic halo.
6. Comparison with previous investigations
As discussed in the introduction, the very metal-poor metallicity domain investigated here has very rarely been treated in the literature. CL08 presented primordial to extremely metal-poor star yields up to 3 M⊙. Although limited in mass, this is currently the most extended exploration in terms of metallicity range. I09 published AGB models with metallicity [Fe/H] = −3 in the 1−6 M⊙ mass range. More recent results were presented by GP21, who studied Z = 10−5 model stars with a mass in the 3−8 M⊙ range and in the FRUITY database developed by S. Cristallo, who included Z = 2 × 10⁻⁵ stars with an initial mass of 1.3, 1.5, and 2 M⊙. At slightly higher metallicities, we also consider Karakas (2010, hereafter K10), who described the evolution of Z = 10−4, 1−6 M⊙ stars, and Doherty et al. (2014, hereafter D14), who investigated the evolutionary properties of Z = 10−4 stars undergoing the super-AGB evolution. The gas yields from these works are compared with the results obtained in our investigation in Fig. 8 and 9. For the results from CL08, we only show the results corresponding to the metallicities close to those discussed by us, namely [Fe/H] = −5.5 and [Fe/H] = −3.
In the low-mass domain, below 3 M⊙, our results are overall extremely similar to those of K10, except for a slight discrepancy in the 16O yields, which are higher in our case. In the 1−1.5 M⊙ mass range, the model stars by I09, CL08, and those in the FRUITY database follow a different behaviour, with the signatures of CNO cycling evident in the large yields of 13C (see the top right panel of Fig. 8) and 14N (bottom left panel of Fig. 8). This is connected with the occurrence of a few hydrogen-ingestion episodes found in the latter works, which trigger a fast increase in the abundances of CNO elements in the early AGB phases. Ventura et al. (2018, 2020) found consistency between the ATON and MONASH results of low-mass stars of solar and super-solar chemical composition, which suggests that the treatment of convective borders leads to similar results in the two cases. In our analysis, the interpretation is more complicated: these results indicate that the extent of mixing, particularly of proton-ingestion episodes, is similar, but this might partly be due to the fact that the metallicity of the K10 models is close to the threshold Z below which proton-ingestion is expected to take place.
The comparison of AGB models of intermediate and high mass is generally more complicated than in the low-mass case because the surface chemical enrichment is determined by the detailed interplay between TDU and HBB. In the 3−7 M⊙ mass domain, we compare our results preferably with those from GP21 because they are the most recent and are based on a metallicity close to the higher Z stars we discussed. We restrict the comparison to the GP21 models based on the Vassiliadis & Wood (1993) prescription for mass loss, which is the same as we adopted here.
By comparing the results reported in Table 1 with those in Table 1 of GP21, we note the following: (a) the core masses at the beginning of the AGB phase are rather similar, with practically no difference for 3 M⊙ and differences within 0.05 M⊙ for M ∼ 6−7 M⊙. (b) Significant differences characterise the temperatures at the bottom of the convective envelope, which in our models are between 20 Mk (for 3 M⊙ stars) and 50 Mk (for 7 M⊙) hotter than in GP21. (c) The TDU is very efficient in the models by GP21, characterised by λ ∼ 0.8−1, whereas in our case, we find that the TDU is generally less efficient in this mass domain and tends to vanish for M ≥ 5 M⊙. (d) As a consequence of the higher luminosities and Tbce, the model stars presented here evolve faster than in GP21, with a factor ∼3 difference in the duration of the TP-AGB phase, as deduced from the comparison between the times reported in Col. 5 of Table 1 and those in Col. 2 of Table 1 of GP21.
From point (a) above we deduce that the pre-AGB evolution of the model stars in the two different sets is rather similar, and that the difference in the initial core mass in the most massive stars we considered is likely due to a slightly more efficient core overshooting during the main-sequence phase.
The differences between the temperatures at the base of the envelope (point b) are remarkable and are mainly connected to convection modelling, which is based on the FST treatment in our models, whereas GP21 used the classic mixing length theory (MLT) description. Differences in the assumption regarding additional mixing from the base of the convective envelope might also play a role here. The strong effect of convection modelling on the evolution of massive AGB stars was discussed in a seminal paper by Ventura & D’Antona (2005a) and was extensively explored in more recent investigations, where results from evolution codes differing in the treatment of the convective instability were compared in detail (Ventura et al. 2016, 2018). On the other hand, our findings indicate that the discrepancies between models calculated with different convection models become increasingly important as the metallicity decreases. The FST models experience a much stronger HBB than the MLT models. We show below that this has dramatic consequences for the change in surface chemistry because the nucleosynthesis experienced by FST models at the bottom of the external envelope is far more advanced than in MLT-based calculations.
The results given in point (c) above indicate a substantial difference in the depth of TDU, which is partly related to the diversity in the treatment of the convective borders and partly to point (b) above. We adopted an exponential decay of velocities from the neutrality point to the radiatively stable region to simulate overshoot, whereas the GP21, K10, and D14 models, whose yields are shown in Figs. 8 and 9, used the neutrality criterion described in Frost & Lattanzio (1996). The different approach in managing the inner border of the envelope during the TDU events might per se explain part of the differences found. On the other hand, the stronger HBB we found also plays a role in this context because model stars exposed to efficient HBB experience weaker TP, which decreases the TDU efficiency. Regardless of the main actor in the determination of the TDU efficiency, the higher λ models are exposed to a larger surface metal enrichment, with the synthesis of primary elements, originating from the matter that is dredged up from the helium burning shell. In the models we discussed, this enrichment, of lower extent, is limited to M ≤ 5 M⊙ stars, and is negligible in more massive objects.
In terms of the gas yields, important differences are seen in Fig. 8 and concern all the CNO species. The 12C yields by GP21 and K10 are a factor ∼10 higher than ours in the 2.5−5 M⊙ mass range, whereas for higher-mass stars, the situation is even more dramatic and our yields become negative, while in the other cases, they remain similar to the slightly lower-mass counterparts, that is, ∼0.003 M⊙. Significant differences are also found for 14N (see the top right panel of Fig. 8). The GP21 yields of 2.5−5 M⊙ stars are almost a factor 10 higher than ours, and the difference increases to 2 orders of magnitude in the regime of massive stars. The models by K10 and D14 exhibit smaller differences with ours with respect to GP21. Their 14N yields are approximately a factor 2 smaller than those of GP21.
The interpretation of the 16O yields is more cumbersome. In the intermediate-mass case, the yields presented here are similar to those by K10, whereas those from GP21 are slightly higher. In the case of massive stars, the context is similar to 12C and our yields become negative, whereas the yields from GP21, K10, and D14 remain positive.
The differences in the yields from the various groups can be explained based on the evolutionary properties of the models we presented and those from GP21, K10, and D14 that we discussed above. The analysis of the CNO yields allows understanding the role played by the different physical mechanisms in the variation in the chemical composition of the surface. In this regard, the results relating to 14N are emblematic. The yields from GP21, and to a lesser extent, those of K10 and D14 as well, are generally higher. This is a signature of the higher TDU efficiency. This conclusion holds regardless of the strength of HBB because the activation of the CNO nucleosynthesis naturally produces an enrichment in 14N.
The analysis of the yields of 12C and 16O confirms the much stronger HBB experienced by the present models with respect to GP21, K10, and D14. This is particularly evident in massive AGBs, in which the destruction of 12C and 16O is so strong that our yields are negative, unlike those from the other groups. Our models of massive AGB stars represent the only case in which it is possible to produce ejecta that are substantially oxygen-free.
Figure 8 also shows the CNO yields of 4 M⊙ and 6 M⊙ model stars by I09. In this case, the comparison and the understanding of the differences among the results is more cumbersome than for GP21 because the physical ingredients adopted varied. This includes convection, mass-loss modelling, low-T molecular opacities, and the mixing scheme. The CN yields from I09 are intermediate between our results and those by GP21, which allows us to infer that the HBB experienced by the present models is stronger than in I09 (this is expected because the latter models adopt the MLT, whereas we use the FST) and that the extent of additional mixing from the formal borders of the convective regions is larger in the I09 models.
The activation of the Ne-Na and Mg-Al-Si chains confirm this understanding. The activation of the Ne-Na nucleosynthesis takes place in all the model stars with initial mass M ≥ 3 M⊙, as witnessed by the positive sodium yields of the intermediate-mass AGBs, shown in the top left panel of Fig. 9. They span the 10−5 − 10−4 M⊙ range in K10 and in our case. The GP21 sodium yields are substantially higher, which is further evidence of a deeper TDU that brings primary 22Ne to the surface that is converted into sodium during the following inter-pulse phase. In the domain of massive AGBs, the differences are more remarkable. Our sodium yields become negative values because the HBB is so strong that the equilibria of the Ne-Na nucleosynthesis are shifted to lower sodium abundances (Ventura & D’Antona 2009). The poor TDU experienced by the massive AGBs presented here also plays a role in this context because there is no transportation of 22Ne, the sodium reservoir, to the surface regions.
In metal-poor AGB stars, descending from M ≥ 3 M⊙ progenitors, 24Mg is destroyed by HBB in the surface regions. On the other hand, 24Mg is transported to the external layers through TDU. In intermediate-mass and massive AGBs, the evolution of the surface 24Mg, similarly to 12C, is therefore determined by the balance between these two mechanisms. In light of this, and on the basis of the differences in the efficiencies of HBB and TDU discussed earlier in this section, it is expected that the models we presented are characterised by the lowest 24Mg yields, which are negative in the M ≥ 3 M⊙ mass range. This is further confirmation that HBB plays the dominant role. Conversely, the 24Mg yields by GP21, K10, and D14 are positive for the masses considered here, although with significant differences among them: the GP21 24Mg yields are a factor 10 higher than those of K10 on average. This is another indication that in the models by GP21, the relative weight of TDU on the modification of the surface chemistry is strongest.
We conclude the analysis of the differences in the gas yields of the various species with 27Al (see the bottom left panel of Fig. 9). For M < 5 M⊙ stars, our Z = 3 × 10−527Al yields are higher than those of K10 because of the stronger HBB conditions, which favour a very advanced Mg-Al nucleosynthesis. The GP21 yields are once more the highest because of deeper TDU events, which dredge up 25Mg and 26Mg nuclei that are synthesised in the helium-burning shell and are then converted into 27Al by HBB. In the case of massive AGBs, the situation is similar to 23Na and 24Mg: our yields are negative because they experience such an advanced HBB nucleosynthesis that 27Al is destroyed at the base of the envelope, but the yields from GP21, K10, and D14 are positive. The GP21 27Al yields are higher by approximately a factor 10 than those of K10 and D14.
The analysis presented in this section can indirectly be used to assess the degree of uncertainty of the results obtained from AGB modelling. The dissimilarities between results published by different groups, specifically, between those from our group and those obtained with the MONASH code for stellar evolution, were extensively discussed in the case of solar metallicity models by Ventura et al. (2018) and for super-solar chemistries by Ventura et al. (2020). These works have highlighted some differences, particularly in the strength of HBB experienced by M > 3 M⊙ stars, but overall, the discrepancies in the yields were within ∼20%, with the sole exception of the stars in the (narrow) mass range close to the threshold to activate HBB. Conversely, D19, in the comparison between Z = 1, 3 × 10⁻⁴ models and those by K10, outlined significant dissimilarities, especially with regard to 14N. The differences were ascribed to a greater contribution from primary material in the K10 models, which in turn is associated with deeper TDU events. We find that the differences are even more pronounced than in D19. The yields of some species found by different groups, such as 12C, 16O, 24Mg, and 27Al, are also of opposite sign.
The uncertainties characterising the adopted macro-physics, particularly the convective instability, have a much more relevant effect at extremely low metallicities. This is partly due to the intrinsic property of metal-poor AGB stars, which experience stronger HBB than the higher metallicity counterparts: this evidently widens the differences between results based on different treatments of the convective instability. Another characteristic of low-metallicity stars is also relevant, which causes their structure and evolution to become particularly sensitive to the efficiency of the mechanisms that can alter the chemical composition of their surfaces. These stars form from gas that is almost metal free, which means that the percentage change in the surface mass fraction of a given species, associated with the effects of TDU, for example, is much larger than in the more metal-rich counterparts. While in metal-rich stars dissimilarities in the amount of matter that is dredged out to the surface will cause small differences in the increase in surface metallicity, in the extremely metal-poor domain, the differences in the metal enrichment and therefore in the evolutionary properties can be considerable.
7. Binary origin for CEMP stars
CEMP stars are low-metallicity ([Fe/H] < −2) dwarfs and giants with substantial carbon enrichment ([C/Fe] > 1; Beers & Christlieb 2005). A significant fraction (∼80%) of these objects, known as CEMP-s stars, show an overabundance of elements produced from slow neutron-capture process (s-process). Multi-epoch observations of CEMP-s stars reported that most of them are members of binary systems (Lucatello et al. 2005), which favours the idea of mass transfer from a companion AGB star that is more massive than the primary, and therefore would have evolved to a cool white dwarf (Abate et al. 2015). The observed CNO abundances and the s-process element distribution can be interpreted by assuming pollution from a low-mass low-metallicity AGB star (see e.g. Cristallo et al. 2009, 2016, and the recent work by Susmitha et al. 2021, and references therein).
Suda et al. (2004) proposed a binary scenario for the formation and evolution of CEMP stars, according to which CEMP stars belong to binary systems with a long enough orbital period that accrete part of the material expelled from a primary companion evolving though the TP-AGB phase, without experiencing any common-envelope evolution.
The debate whether the accreted material from the donor can be mixed through most of the secondary star or rather is shared only with the outermost layers of the latter is still open (Stancliffe et al. 2007; Aoki et al. 2008). The analysis of the different factors affecting the depth of the innermost layers reached by accreted material in a low-mass mass star is beyond the scope of our work. We are simply interested in understanding whether our results are consistent with the chemistry of CEMP stars of similar metallicity. The approach we followed is similar to that of GP21: we considered dilution of matter with the average chemistry of the AGB ejecta with gas characterised by the original chemical composition, and compared it with the derived abundances of a few selected CEMP stars belonging to the SAGA database (Suda et al. 2008).
Figure 12 shows this comparison for the selected CEMP stars, which have approximately the same metallicity as the model stars presented here. We find satisfactory agreement overall. Three out of the four selected stars show the imprint of a dominant contribution from TDU to the AGB chemistry. In one case, however, namely CS 22958-041, the combination of HBB and TDU is clear in the high nitrogen enhancement.
8. Dust production
Asymptotic giant branch stars are potentially important dust manufacturers, given the thermodynamic conditions of their winds, with are sufficiently cool and dense to allow significant condensation of gaseous molecules into solid grains (Ferrarotti & Gail 2006). The most relevant dust species that form are silicates and carbonaceous dust. The first species are formed in oxygen-rich environments, and the second type of dust, composed of a majority of solid carbon grains with some contribution from SiC, forms in the wind of carbon stars and is sensitive to the carbon excess (C–O), that is, the excess of carbon molecules with respect to oxygen in the surface layers. The formation of dust in metal-poor AGB was recently addressed by D19, who explored the metallicities Z = 1, 3 × 10⁻⁴. We extend the analysis by D19 to more metal-poor environments.
Figure 11 shows the variation in dust production rate (DPR), which is defined as the rate in solar masses per year at which dust is released into the interstellar medium by the star. The different lines refer to the same model stars as presented in Figs. 4–6, with the Z = 3 × 10⁻⁵ case in the left panel and the Z = 3 × 10⁻⁷ case on the right. The evolutionary sequences of all the model stars we discussed in terms of the dust production rate from the main dust species and other quantities connected to dust production are available online4, together with the table of the dust yields.
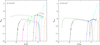 |
Fig. 11. Variation in dust production rate as a function of the (current) mass of the star for some of the model stars discussed in Fig. 4 for a metallicity Z = 3 × 10⁻⁵ (left panel) and Z = 3 × 10⁻⁷ (right panel). The colour-coding is the same as in Fig. 4. Full points correspond to silicate dust, and open points indicate carbonaceous dust. |
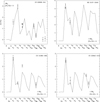 |
Fig. 12. Solid curves: abundance patterns predicted at the surface of unevolved low-mass stars, obtained by mixing 1% of the matter ejected by AGB models with 0.2 M⊙ of their envelopes. The AGB models are identified by their initial mass and metallicity, as reported in the bottom right and top left corner of each panel. The circles show the abundances measured in extremely metal-poor stars selected from the SAGA database (see the top right label in each plot). |
8.1. Evolution of the dust production rate during the AGB phase
Asymptotic giant branch stars with masses below 2 M⊙, after becoming C-stars, produce carbonaceous dust mainly in the form of solid carbon. The contribution from SiC is negligible, considering the low quantity of silicon in the surface layers. In these stars, the DPR increases during the whole AGB phase, as is clear in the trend defined by the orange, grey, and cyan lines in Fig. 11. The behaviour of the DPR is connected with the gradual accumulation of 12C in the surface regions of the star owing to the TDU episodes: this enhances dust formation because more carbon molecules are available to condensation and for the consequent expansion and cooling of the external regions of the star, which partly inhibits vaporisation. The highest DPR, ∼10−7 M⊙ yr−1, is reached by 2 M⊙ stars because they experience the largest number of TDU events and accordingly accumulate higher quantities of 12C at the surface.
2.5−4 M⊙ stars evolve as M-type stars for most of their life (see the bottom left panel of Fig. 2). In the wide metallicity range explored so far, this is the first case in which the main dust component that formed during the O-rich phase is alumina dust, while silicates form in almost negligible quantities. The reasons for this peculiar behaviour are that a) alumina dust is a stable compound that forms closer to the surface of the star than silicates in high-density regions of the wind, b) the surface abundance of Al, the key-element for alumina dust, is largely enhanced in this extremely metal-poor regimes (see Fig. 6), and c) the carbon nuclei carried to the surface regions by TDU episodes lock most of the oxygen nuclei in CO molecules, leaving only a small fraction of oxygen free for dust condensation. Under these conditions, the condensation of alumina dust in the inner region of the wind absorbs a large fraction of the available oxygen (δAl2O3 ∼ 0.014 is the condensation efficiency of oxygen bound in Al2O3). The DPR reached by these stars, generally below 10−8 M⊙yr−1, is significantly lower than in 1.5−2 M⊙ stars because the amounts of aluminum and silicon are smaller than carbon in the surface layers. Metallicity plays a role here. The Z = 3 × 10⁻⁵ DPRs are almost a factor of 10 higher than their Z = 3 × 10⁻⁷ counterparts. This is due to the quantities of aluminium that are available to form dust, which scale with Z.
Massive AGBs (initial mass above 5 M⊙) evolve as carbon stars for most of the AGB lifetime because of the strong effects of HBB, which destroy the surface 16O. An example of this behaviour is shown in Fig. 3, particularly in the bottom left panel, which reports the evolution of the CNO species. The C/O> 1 condition leads to the formation of carbonaceous dust, which accounts for almost 100% of the overall dust formation by these stars. At Z = 3 × 10⁻⁵, this is mainly in the form of SiC, which is the most stable compound that formed in C-rich winds. Even in this case, the carbon atoms free for condensation are almost entirely consumed in the SiC grains, to the detriment of solid carbon, which forms in an outer region. In the lower-metallicity case, the paucity of Si and its destruction through p-capture nucleosynthesis reduces the amount of Si available for dust formation. The DPR reached, in all cases below a few 10−9 M⊙yr−1, are significantly lower than in the lower-mass counterparts, mainly because of the low carbon excesses reached, favoured by the strong HBB activity, which depletes the surface 12C since the early AGB phases (see Fig. 3).
8.2. Dust yields from extremely metal-poor AGB stars
A summary of the results we obtained in terms of the dust yields produced by stars of different mass (reported on the abscissa) is shown in Fig. 13. The results published in D19, which refer to metallicities Z = 1, 3 × 10⁻⁴, are also shown.
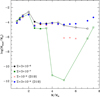 |
Fig. 13. Dust yields from model stars with metallicities Z = 3 × 10⁻⁵ and Z = 3 × 10⁻⁵. Results from D19 are also shown. |
Most of the dust in the form of solid carbon is produced by low-mass AGBs. The highest dust production is provided by 2 M⊙ stars, which pour a quantity of dust slightly below 0.01 M⊙ into the interstellar medium. For M ≤ 2 M⊙ stars, the results are independent of metallicity, as confirmed by the comparison of the metallicities investigated here and those studied in D19. The remarkable similarity in the dust yields of stars of different metallicity arises because the surface 12C, the indirect source of the dust formed in the winds of these stars, is almost entirely of primary origin, being dredged-up from the He-burning shell that forms at the ignition of each TP.
Stars of higher mass produce smaller quantities of dust, with an overall dust mass below 10−4 M⊙. In the comparison of stars of different metallicity, Fig. 13 clearly shows that the lowest Z model stars studied here produce quantities of dust that are significantly smaller than those of their higher-metallicity counterparts. This is due to the lower amount of silicon and/or aluminum in the matter from which the stars formed and the strong HBB experienced, which heavily destroys the surface 12C and 16O, thus severely inhibiting the formation of carbonaceous dust and silicates. Furthermore, with respect to the results found in D19, where the main dust components formed are silicates, in the metallicities we investigated, alumina dust prevails.
In the context of massive AGBs, the dust produced by the model stars we presented and those by D19 differ. In the latter case, the dust is mainly in the form of alumina dust and silicates, and the trend with mass increases slightly towards the highest masses we investigated, as is clear in the trend defined by the blue diamonds in Fig. 13, which correspond to the Z = 3 × 10⁻⁴ M⊙ stars published in D19. This behaviour is determined by the fact that the higher the mass of the star, the higher the mass-loss rate and the denser the wind. On the other hand, in the massive AGB model stars we presented, the dust is in the form of carbonaceous dust because of the strong effects of HBB in extremely metal-poor AGB stars.
In agreement with D19, our results indicate that in extremely metal-poor environments, the dust contribution from AGB stars becomes relevant only after ∼500 Myr, considering the poor dust production by stars that evolve faster than this time limit. For the contribution from AGB stars to the cosmic dust yield, these results confirm the conclusions reached in D19: at redshifts above 5−6, the dominant dust factories are high-mass stars that explode as supernovae.
9. Conclusions
We studied the evolution of extremely metal-poor, M < 8 M⊙ stars across the asymptotic giant branch until the almost complete loss of the external mantle. The metallicities we investigated, Z = 3 × 10⁻⁵ and Z = 3 × 10⁻⁷, correspond to [Fe/H] = −3 and [Fe/H] = −5, respectively.
In stars with an initial mass M ≤ 2 M⊙, the chemical composition of the surface is altered by the effects of TDU. In higher-mass stars, the temperature at the bottom of the convective envelope reaches (or exceeds) ∼40 MK, thus activating HBB: in these cases, the relative importance of TDU and HBB is the key factor in the change of the surface chemistry. Our results show that in the stars with the highest mass, with M ≥ 5 M⊙, the depth of TDU is so small that the surface chemistry reflects the pure effects of HBB.
In the metallicity domain we investigated, the description of the convective instability is crucial for the evolution of the stars. Considering the very low initial metallicity, the depth of TDU, which is extremely sensitive to the treatment of convective borders, proves important for determining the surface metal enrichment, which in turn affects the evolution of the stellar radius and thus of the mass-loss rate. Numerical simulations exploring the possible effects of changing the assumed OS confirm that the main aspects of the evolution across the AGB phase and the gas pollution from these stars are extremely sensitive to the underlying assumptions regarding the description of the regions close to the convective borders. Convection modelling also affects the strength of HBB, with notable consequences on the highest luminosity attained by the star, hence on the mass-loss rate. The description of mass loss, which is highly uncertain in the metallicity domain discussed here, is also crucial for the determination of the evolutionary history of these stars.
The different impact of TDU and HBB in stars of different mass is reflected in the gas yields. Low-mass AGBs, experiencing TDU alone, produce gas that is largely enriched in 12C and to a lesser extent, is enriched in the other chemical species. This gas is almost entirely of primary origin because the enrichment in the mass fractions of the various chemicals is due to chains of nuclear reactions that started by helium burning in the pulse-driven convective shell. When compared to results from other investigations that focused on low-mass stars with metallicities similar to those explored by us, our yields of 13C and 14N are significantly smaller because the proton-ingestion episodes are weaker. The stars descending from 2 M⊙ < M < 5 M⊙ progenitors produce gas, once more mostly of primary origin, altered by both TDU and HBB. The most important feature in this context is the extraordinary production of 13C and 14N. The two elements are produced by proton capture on 12C nuclei, synthesised during the thermal pulse and convected to the surface through TDU. The most massive AGB stars experience HBB alone, with little contribution from TDU. The yields of different chemical species reflect a mostly secondary contribution, with the exception of M ≥ 7 M⊙ stars, which experience a deep convective mixing after the core helium-burning phase, with transportation of primary carbon to the surface regions. In all the stars of initial mass above ∼5 M⊙, the nucleosynthesis reflects the equilibria of very hot p-capture processing. The very high HBB temperatures produce remarkable effects on the surface chemistry: the nucleosynthesis experienced at the base of the envelope is such that even the yields of chemical species that are found to be largely produced in population I and II AGBs, such as sodium and aluminium, are negative in our cases.
Dust production by extremely metal-poor AGBs is limited to M ≤ 2 M⊙ stars because in higher-mass objects, the very small abundances of silicon prevents significant formation of silicates. In these stars, the formation of carbonaceous dust is also negligible because of the effects of HBB, which destroys the surface carbon. In the low-mass domain, solid carbon dust is formed, in quantities spanning the 10−4 − 5 × 10⁻³ M⊙ range. The larger quantities of dust are formed by the stars of higher mass, which accumulate more carbon in the surface regions. These findings support the idea of a dominant contribution of massive stars to dust production in the Universe in the early epochs following the Big Bang.
The latter quantity is the standard assumption in the AGB calculations of solar and sub-solar metallicity, calibrated on the basis of the luminosity distribution of lithium-rich stars in the Magellanic Clouds by Ventura et al. (2000)
Acknowledgments
P. V. and D. R. benefited from the International Space Science Institute (ISSI, Bern, CH, and ISSI-BJ, Beijing, CN) thanks to the funding of the team “Chemical abundances in the ISM: the litmus test of stellar IMF variations in galaxies across cosmic time”. M. C. acknowledges support from “progetto INAF Mainstream” (PI: S. Cassisi). M. Lugaro acknowledges the support of the Hungarian National Research, Development and Innovation Office (NKFI), grant KH_18 130405. E. M. acknowledges support from the Angelo Della Riccia foundation and is indebted to the Instituto de Astrofisica de Canarias for the kind hospitality and the scientific support. M. T. acknowledges support from MIUR through the FARE project R164RM93XW SEMPLICE (PI: Milone) and from MIUR under PRIN program 2017Z2HSMF (PI: Bedin).
References
- Abate, C., Pols, O. R., Stancliffe, R. J., et al. 2015, A&A, 581, A62 [NASA ADS] [CrossRef] [EDP Sciences] [Google Scholar]
- Aoki, W., Beers, T. C., Sivarani, T., et al. 2008, ApJ, 678, 1351 [Google Scholar]
- Asplund, M., Grevesse, N., Sauval, A. J., et al. 2009, ARA&A, 47, 481 [Google Scholar]
- Beers, T. C., & Christlieb, N. 2005, ARA&A, 43, 531 [NASA ADS] [CrossRef] [Google Scholar]
- Begemann, B., Dorschner, J., Henning, T., et al. 1994, ApJ, 423, L71 [NASA ADS] [CrossRef] [Google Scholar]
- Berg, D. A., Skillman, E. D., Marble, A. R., et al. 2012, ApJ, 754, 98 [NASA ADS] [CrossRef] [Google Scholar]
- Blöcker, T. 1995, A&A, 297, 727 [NASA ADS] [Google Scholar]
- Blöcker, T., & Schöenberner, D. 1991, A&A, 244, L43 [Google Scholar]
- Boothroyd, A. I., & Sackmann, I.-J. 1999, ApJ, 510, 232 [NASA ADS] [CrossRef] [Google Scholar]
- Campbell, S. W., & Lattanzio, J. C. 2008, A&A, 490, 769 [NASA ADS] [CrossRef] [EDP Sciences] [Google Scholar]
- Canuto, V. M. C., & Mazzitelli, I. 1991, ApJ, 370, 295 [NASA ADS] [CrossRef] [Google Scholar]
- Cayrel, R., Depagne, E., Spite, M., et al. 2004, A&A, 416, 1117 [NASA ADS] [CrossRef] [EDP Sciences] [Google Scholar]
- Choplin, A., Siess, L., & Goriely, S. 2021, A&A, 648, A119 [NASA ADS] [CrossRef] [EDP Sciences] [Google Scholar]
- Constantino, T., Campbell, S., Gil-Pons, P., et al. 2014, ApJ, 784, 56 [NASA ADS] [CrossRef] [Google Scholar]
- Cristallo, S., Piersanti, L., Straniero, O., et al. 2009, PASA, 26, 139 [Google Scholar]
- Cristallo, S., Piersanti, L., Straniero, O., et al. 2011, ApJS, 197, 17 [NASA ADS] [CrossRef] [Google Scholar]
- Cristallo, S., Straniero, O., Piersanti, L., et al. 2015, ApJS, 219, 40 [NASA ADS] [CrossRef] [Google Scholar]
- Cristallo, S., Karinkuzhi, D., Goswami, A., et al. 2016, ApJ, 833, 181 [NASA ADS] [CrossRef] [Google Scholar]
- D’Ercole, A., Vesperini, E., D’Antona, F., et al. 2008, MNRAS, 391, 825 [Google Scholar]
- Dell’Agli, F., García-Hernández, D. A., Rossi, C., et al. 2014a, MNRAS, 441, 1115 [Google Scholar]
- Dell’Agli, F., Ventura, P., Garcia Hernandez, D. A. et al. 2014b, MNRAS, 442, L38 [Google Scholar]
- Dell’Agli, F., Ventura, P., Schneider, R., et al. 2015a, MNRAS, 447, 2992 [Google Scholar]
- Dell’Agli, F., García-Hernández, D. A., Ventura, P., et al. 2015b, MNRAS, 454, 4235 [Google Scholar]
- Dell’Agli, F., Di Criscienzo, M., Boyer, M. L., et al. 2016, MNRAS, 460, 4230 [Google Scholar]
- Dell’Agli, F., Di Criscienzo, M., Ventura, P., et al. 2018, MNRAS, 479, 5035 [Google Scholar]
- Dell’Agli, F., Valiante, R., Kamath, D., et al. 2019, MNRAS, 486, 4738 [CrossRef] [Google Scholar]
- Doherty, C. L., Siess, L., Lattanzio, J. C., et al. 2010, MNRAS, 401, 1453 [NASA ADS] [CrossRef] [Google Scholar]
- Doherty, C. L., Gil-Pons, P., Lau, H. H. B., et al. 2014, MNRAS, 441, 582 [NASA ADS] [CrossRef] [Google Scholar]
- Emerick, A., Bryan, G. L., & Mac Low, M.-M. 2020, ApJ, 890, 155 [NASA ADS] [CrossRef] [Google Scholar]
- Ferrarotti, A. S., & Gail, H.-P. 2006, A&A, 447, 553 [CrossRef] [EDP Sciences] [Google Scholar]
- Formicola, A., Imbriani, G., Costantini, H., et al. 2004, Phys. Lett. B, 591, 61 [Google Scholar]
- Frost, C. A., & Lattanzio, J. C. 1996, ApJ, 473, 383 [NASA ADS] [CrossRef] [Google Scholar]
- Fujimoto, M. Y., Iben, I., Jr, & Hollowell, D. 1990, ApJ, 349, 580 [CrossRef] [Google Scholar]
- Fujimoto, M. Y., Ikeda, Y., & Iben, I., Jr 2000, ApJ, 529, 25 [Google Scholar]
- Fynbo, H. O. U., Diget, C. A., Bergmann, U. C., et al. 2005, Nature, 433, 136 [Google Scholar]
- Garcia-Berro, E., & Iben, I. 1994, ApJ, 434, 306 [Google Scholar]
- Gil-Pons, P., Doherty, C. L., Gutiérrez, J., et al. 2021, A&A, 645, A10 [EDP Sciences] [Google Scholar]
- Iben, I., Ritossa, C., & García-Berro, E. 1997, ApJ, 489, 772 [NASA ADS] [CrossRef] [Google Scholar]
- Iglesias, C. A., & Rogers, F. J. 1996, ApJ, 464, 943 [NASA ADS] [CrossRef] [Google Scholar]
- Iwamoto, N. 2009, PASA, 26, 145 [NASA ADS] [CrossRef] [Google Scholar]
- Iwamoto, N., Kajino, T., Mathews, G. J., Fujimoto, M. Y., & Aoki, W. 2004, ApJ, 602, 377 [Google Scholar]
- Izotov, Y. I., Thuan, T. X., & Guseva, N. G. 2012, A&A, 546, A122 [NASA ADS] [CrossRef] [EDP Sciences] [Google Scholar]
- Karakas, A. I. 2010, MNRAS, 403, 1413 [NASA ADS] [CrossRef] [Google Scholar]
- Karakas, A. I. 2014, MNRAS, 445, 347 [NASA ADS] [CrossRef] [Google Scholar]
- Karakas, A. I., & Lattanzio, J. C. 2014, PASA, 31 [CrossRef] [Google Scholar]
- Karakas, A. I., & Lugaro, M. 2016, ApJ, 825, 26 [NASA ADS] [CrossRef] [Google Scholar]
- Lau, H. H. B., Stancliffe, R. J., & Tout, C. A. 2008, MNRAS, 385, 301 [Google Scholar]
- Limongi, M., & Chieffi, A. 2018, ApJS, 237, 13 [NASA ADS] [CrossRef] [Google Scholar]
- Lucatello, S., Tsangarides, S., Beers, T. C., et al. 2005, ApJ, 625, 825 [NASA ADS] [CrossRef] [Google Scholar]
- Maraston, C., Daddi, E., Renzini, A., et al. 2006, ApJ, 652, 85 [NASA ADS] [CrossRef] [Google Scholar]
- Marigo, P. 2002, A&A, 387, 507 [NASA ADS] [CrossRef] [EDP Sciences] [Google Scholar]
- Marigo, P., & Aringer, B. 2009, A&A, 508, 1538 [Google Scholar]
- Mowlavi, N. 1999, A&A, 350, 73 [NASA ADS] [Google Scholar]
- Nanni, A. 2019, MNRAS, 482, 4726 [NASA ADS] [CrossRef] [Google Scholar]
- Nanni, A., Bressan, A., Marigo, P., et al. 2013, MNRAS, 434, 2390 [NASA ADS] [CrossRef] [Google Scholar]
- Nanni, A., Bressan, A., Marigo, P., et al. 2014, MNRAS, 438, 2328 [NASA ADS] [CrossRef] [Google Scholar]
- Nanni, A., Marigo, P., Groenewegen, M. A. T., et al. 2016, MNRAS, 462, 1215 [NASA ADS] [CrossRef] [Google Scholar]
- Nanni, A., Marigo, P., Girardi, L., et al. 2018, MNRAS, 473, 5492 [NASA ADS] [CrossRef] [Google Scholar]
- Nanni, A., Groenewegen, M. A. T., Aringer, B., et al. 2019, MNRAS, 487, 502 [NASA ADS] [CrossRef] [Google Scholar]
- Nanni, A., Marigo, P., Groenewegen, M. A. T., et al. 2020, IAU Gener. Assembly, 405 [Google Scholar]
- Ordal, M. A., Bell, R. J., Alexander, R. W., et al. 1988, Appl. Opt., 27, 1203 [NASA ADS] [CrossRef] [Google Scholar]
- Ossenkopf, V., Henning, T., & Mathis, J. S. 1992, A&A, 261, 567 [NASA ADS] [Google Scholar]
- Paczyński, B. 1970, Acta Astron., 20, 287 [Google Scholar]
- Pauldrach, A. W. A., Kudritzi, R.-P., & Puls, J. 1989, Astronomische Gesellschaft Abstract Series [Google Scholar]
- Pegourie, B. 1988, A&A, 194, 335 [NASA ADS] [Google Scholar]
- Romano, D., & Starkenburg, E. 2013, MNRAS, 434, 471 [Google Scholar]
- Romano, D., Karakas, A. I., Tosi, M., et al. 2010, A&A, 522, A32 [NASA ADS] [CrossRef] [EDP Sciences] [Google Scholar]
- Romano, D., Bellazzini, M., Starkenburg, E., et al. 2015, MNRAS, 446, 4220 [CrossRef] [Google Scholar]
- Romano, D., Matteucci, F., Zhang, Z.-Y., et al. 2019, MNRAS, 490, 2838 [NASA ADS] [CrossRef] [Google Scholar]
- Saumon, D., Chabrier, G., & van Horn, H. M. 1995, ApJS, 99, 713 [NASA ADS] [CrossRef] [Google Scholar]
- Schwarzschild, M., & Härm, R. 1965, ApJ, 142, 855 [NASA ADS] [CrossRef] [Google Scholar]
- Siess, L. 2006, A&A, 448, 717 [NASA ADS] [CrossRef] [EDP Sciences] [Google Scholar]
- Siess, L. 2007, A&A, 476, 893 [NASA ADS] [CrossRef] [EDP Sciences] [Google Scholar]
- Siess, L. 2010, A&A, 512, A10 [NASA ADS] [CrossRef] [EDP Sciences] [Google Scholar]
- Simon, J. D. 2019, ARA&A, 57, 375 [NASA ADS] [CrossRef] [Google Scholar]
- Stancliffe, R. J., Glebbeek, E., Izzard, R. G., & Pols, O. R. 2007, A&A, 464, L57 [NASA ADS] [CrossRef] [EDP Sciences] [Google Scholar]
- Stolzmann, W., & Blöcker, T. 2000, A&A, 361, 1152 [Google Scholar]
- Straniero, O., Gallino, R., Busso, M., et al. 1995, ApJ, 440, L85 [NASA ADS] [CrossRef] [Google Scholar]
- Suda, T., Aikawa, M., Machida, M. N., Fujimoto, M. Y., & Iben, I., Jr 2004, ApJ, 611, 476 [NASA ADS] [CrossRef] [Google Scholar]
- Suda, T., Katsuta, Y., Yamada, S., et al. 2008, PASJ, 60, 1159 [NASA ADS] [Google Scholar]
- Susmitha, A., Ojha, D. K., Sivarani, T., et al. 2021, MNRAS, 506, 1962 [NASA ADS] [CrossRef] [Google Scholar]
- Tolstoy, E., Hill, V., & Tosi, M. 2009, ARA&A, 47, 371 [Google Scholar]
- Valiante, R., Schneider, R., Bianchi, S., et al. 2009, MNRAS, 397, 1661 [CrossRef] [Google Scholar]
- Vassiliadis, E., & Wood, P. R. 1993, ApJ, 413, 641 [Google Scholar]
- Ventura, P., & D’Antona, F. 2005a, A&A, 431, 279 [NASA ADS] [CrossRef] [EDP Sciences] [Google Scholar]
- Ventura, P., & D’Antona, F. 2005b, A&A, 439, 1075 [NASA ADS] [CrossRef] [EDP Sciences] [Google Scholar]
- Ventura, P., & D’Antona, F. 2009, A&A, 499, 835 [NASA ADS] [CrossRef] [EDP Sciences] [Google Scholar]
- Ventura, P., Zeppieri, A., Mazzitelli, I., & D’Antona, F. 1998, A&A, 334, 953 [Google Scholar]
- Ventura, P., D’Antona, F., & Mazzitelli, I. 2000, A&A, 363, 605 [Google Scholar]
- Ventura, P., D’Antona, F., Mazzitelli, I., & Gratton, R. 2001, ApJ, 550, L65 [CrossRef] [Google Scholar]
- Ventura, P., Di Criscienzo, M., Schneider, R., et al. 2012, MNRAS, 420, 1442 [Google Scholar]
- Ventura, P., Di Criscienzo, M., Carini, R., & D’Antona, F. 2013, MNRAS, 431, 3642 [Google Scholar]
- Ventura, P., Dell’Agli, F., Schneider, R., et al. 2014a, MNRAS, 439, 977 [NASA ADS] [CrossRef] [Google Scholar]
- Ventura, P., di Criscienzo, M., D’Antona, F., et al. 2014b, MNRAS, 437, 3274 [NASA ADS] [CrossRef] [Google Scholar]
- Ventura, P., Stanghellini, L., Dell’Agli, F., et al. 2015, MNRAS, 452, 3679 [NASA ADS] [CrossRef] [Google Scholar]
- Ventura, P., Karakas, A. I., Dell’Agli, F., et al. 2016, MNRAS, 457, 1456 [Google Scholar]
- Ventura, P., Karakas, A., Dell’Agli, F., García-Hernández, D. A., & Guzman-Ramirez, L. 2018, MNRAS, 475, 2282 [NASA ADS] [Google Scholar]
- Ventura, P., Dell’Agli, F., Lugaro, M., et al. 2020, A&A, 641, A103 [NASA ADS] [CrossRef] [EDP Sciences] [Google Scholar]
- Vincenzo, F., Belfiore, F., Maiolino, R., et al. 2016, MNRAS, 458, 3466 [NASA ADS] [CrossRef] [Google Scholar]
- Wachter, A., Schröder, K. P., Winters, J. M., Arndt, T. U., & Sedlmayr, E. 2002, A&A, 384, 452 [NASA ADS] [CrossRef] [EDP Sciences] [Google Scholar]
- Wachter, A., Winters, J. M., Schröder, K. P., & Sedlmayr, E. 2008, A&A, 486, 497 [NASA ADS] [CrossRef] [EDP Sciences] [Google Scholar]
- Yan, Z., Jerabkova, T., & Kroupa, P. 2020, A&A, 637, A68 [NASA ADS] [CrossRef] [EDP Sciences] [Google Scholar]
- Zubko, V. G., Mennella, V., Colangeli, L., et al. 1996, MNRAS, 282, 132 [Google Scholar]
All Tables
Main properties of the model stars for the (initial) mass range 1−7.5 M⊙ and metallicities Z = 3 × 10⁻⁵ (upper part of the table) and Z = 3 × 10⁻⁷ (lower part).
Modification of the surface mass fractions of the individual species as a consequence of the first and second dredge-up episodes for model stars with a metallicity Z = 3 × 10⁻⁵ (upper part of the table) and Z = 3 × 10⁻⁷ (lower part of the table).
All Figures
|
Fig. 1. Evolution of the 1.5 M⊙ model star with metallicity Z = 3 × 10⁻⁵ as a function of the time, counted from the beginning of the TP-AGB phase. The top-left panel reports the variation in luminosity (solid black scale on the left) and of the effective temperature (dashed red scale on the right). The evolution of the stellar radius (scale on the left) and of the mass-loss rate (scale on the right) are shown in the top right panel, as solid black and dashed red lines, respectively. The variation in CNO surface abundances is shown in the bottom left panels, where the different lines refer to the mass fractions of 12C (red), 14N (black), 16O (blue), and (C–O) (dashed magenta scale on the right; see text for the definition). The bottom right panel reports the variation in surface mass fractions of 22Ne (red line), 23Na (blue), 25Mg (magenta), and 27Al (black). The dotted (dashed) black line in the top left panel connects the luminosity values taken in the middle of each inter-pulse of a model star of the same initial mass and metallicity, calculated by assuming that during the AGB phase, the OS is a factor 2 lower (higher) than in the standard case. The same holds for the dotted and dashed magenta lines in the bottom left panel, indicating the evolution of the surface (C−O), and the red lines in the bottom right panel, which refer to the surface 22Ne. |
| In the text | |
|
Fig. 2. Evolution of the 4 M⊙ model star with a metallicity Z = 3 × 10⁻⁵ as a function of the time, counted from the beginning of the TP-AGB phase. The top left panels reports the variation in luminosity (solid black track, scale on the left) and of the temperature at the base of the convective envelope (red lines, scale on the right), whereas the top right panel shows the evolution of the stellar radius (scale on the left) and of the mass-loss rate (red, scale on the right). The variation in CNO surface abundances is shown in the bottom left panels, where the different lines refer to the mass fractions of 12C (red), 14N (black), and 16O (blue). The bottom right panel reports the variation in surface mass fractions of various elements involved in the Ne-Na-Mg-Al-Si nucleosynthesis. The long-dashed and dotted-dashed green lines in the left panels refer to the evolution of the luminosity (top, left panel) and surface 14N (bottom, left) of a model star calculated by assuming a Blöcker (1995) mass-loss rate, with the free parameter entering the formula taken as ηR = 0.005 and ηR = 0.02, respectively. The dashed cyan lines in the same panels refer to the luminosity and the surface 14N of a model star calculated by doubling the OS. |
| In the text | |
|
Fig. 3. Evolution of the 6 M⊙ model star with a metallicity Z = 3 × 10⁻⁵ as a function of the time, counted from the beginning of the TP-AGB phase. The top panels reports the same quantities as in the corresponding panels of Fig. 2, but the lines corresponding to the temperature at the bottom of the convective envelope and of the mass-loss rate refer to the inter-pulse phases for readability. The bottom panels, showing the variation in surface chemistry, use the same colour-coding as in Fig. 2. The dashed cyan lines in the left panels refer to the luminosity (top) and the surface 14N of a model star calculated by doubling the OS. |
| In the text | |
|
Fig. 4. Variation in luminosity of the model stars of metallicity Z = 3 × 10⁻⁵ (top left) and Z = 3 × 10⁻⁷ (top right) as a funnction of the core mass. The different lines refer to stars with an intial mass 1 M⊙ (orange), 1.5 M⊙ (grey), 2 M⊙ (cyan) 2.5 M⊙ (red), 3 M⊙ (blue), 4 M⊙ (light green), 5 M⊙ (magenta), 6 M⊙ (black), and 7.5 M⊙ (dark green). The dashed lines indicate the core mass – luminosity relation by Paczyński (1970). The bottom panels report the evolution of the temperature at the bottom of the convective envelope of the same model stars as shown in the top panels as a function of the current mass of the star. |
| In the text | |
|
Fig. 5. Evolution of the surface mass fraction of nitrogen (top panels) and oxygen (bottom) as a function of the (current) stellar mass of the Z = 3 × 10⁻⁵ (left) and Z = 3 × 10⁻⁷ (right) model stars. The colour-coding is the same as in Fig. 4. Red arrows on the left side of each panel indicate the initial mass fractions. |
| In the text | |
|
Fig. 6. Evolution of the surface mass fraction of 27Al (top panels) and 28Si (bottom) as a function of the (current) stellar mass of the Z = 3 × 10⁻⁵ (left) and Z = 3 × 10⁻⁷ (right) model stars. The colour-coding is the same as in Fig. 4. Red arrows on the left side of each pane indicate the initial mass fractions. |
| In the text | |
|
Fig. 7. Ratio of the average abundances of different chemical species in the ejecta of AGB stars with an initial mass 1.5 M⊙ (top panel), 4 M⊙ (middle panel), and 6 M⊙ (bottom panel) and the initial mass fractions. The different lines refer to the Z = 3 × 10⁻⁵ (black) and Z = 3 × 10⁻⁷ (green) model stars we investigated and to the Z = 3 × 10⁻⁴ (red) models published in D19. Dotted (dashed) lines in the panels refer to the results of Z = 3 × 10⁻⁵ models obtained by assuming an overshoot parameter a factor 2 lower (higher) than in the standard case. Long-dashed and dot-dashed lines in the middle panel indicate the results of the evolution of a 4 M⊙ model star with Z = 3 × 10⁻⁵, obtained by modelling mass loss according to Blöcker (1995) by assuming a value of the free parameter of ηR = 0.005 and ηR = 0.02, respectively. |
| In the text | |
|
Fig. 8. Yields (solar masses, see the definition in Sect. 5) of the chemical species involved in CNO cycling are shown as a function of the initial mass of the star for the metallicities Z = 3 × 10⁻⁵ (black points) and Z = 3 × 10⁻⁷ (green squares). The corresponding yields from GP21, Karakas (2010), and Doherty et al. (2014) are indicated with blue triangles, red diamonds, and orange crosses, respectively. Shaded areas on the right side of the panels indicate the values covered by the yields from Limongi & Chieffi (2018) for different initial rotation velocities. The values of the mass for which the points or the shadowing is missing indicate that the corresponding yields are negative. |
| In the text | |
|
Fig. 9. Yields of sodium (top, left panel), 24Mg (top right), 27Al (bottom left), and 28Si (bottom right) as a function of the initial mass of the star. The symbols and the colour-coding are the same as in Fig. 8. |
| In the text | |
|
Fig. 10. Evolution of the N/O abundance ratio in a dwarf galaxy with stellar mass 2 × 10⁶ M⊙, modelled according to the method documented in Romano & Starkenburg (2013) and Romano et al. (2015) (see text for details of the various assumptions). The dashed red line indicates the results obtained by Romano et al. (2019), who extrapolated the yields of very metal-poor low- and intermediate-mass stars from those corresponding to the higher-metallicity counterparts (Z = 3 × 10⁻⁴). The black lines refers to the results obtained when our yields are considered. Green squares with error bars are data for low-mass star-forming galaxies from Berg et al. (2012) and Izotov et al. (2012). |
| In the text | |
|
Fig. 11. Variation in dust production rate as a function of the (current) mass of the star for some of the model stars discussed in Fig. 4 for a metallicity Z = 3 × 10⁻⁵ (left panel) and Z = 3 × 10⁻⁷ (right panel). The colour-coding is the same as in Fig. 4. Full points correspond to silicate dust, and open points indicate carbonaceous dust. |
| In the text | |
|
Fig. 12. Solid curves: abundance patterns predicted at the surface of unevolved low-mass stars, obtained by mixing 1% of the matter ejected by AGB models with 0.2 M⊙ of their envelopes. The AGB models are identified by their initial mass and metallicity, as reported in the bottom right and top left corner of each panel. The circles show the abundances measured in extremely metal-poor stars selected from the SAGA database (see the top right label in each plot). |
| In the text | |
|
Fig. 13. Dust yields from model stars with metallicities Z = 3 × 10⁻⁵ and Z = 3 × 10⁻⁵. Results from D19 are also shown. |
| In the text | |
Current usage metrics show cumulative count of Article Views (full-text article views including HTML views, PDF and ePub downloads, according to the available data) and Abstracts Views on Vision4Press platform.
Data correspond to usage on the plateform after 2015. The current usage metrics is available 48-96 hours after online publication and is updated daily on week days.
Initial download of the metrics may take a while.