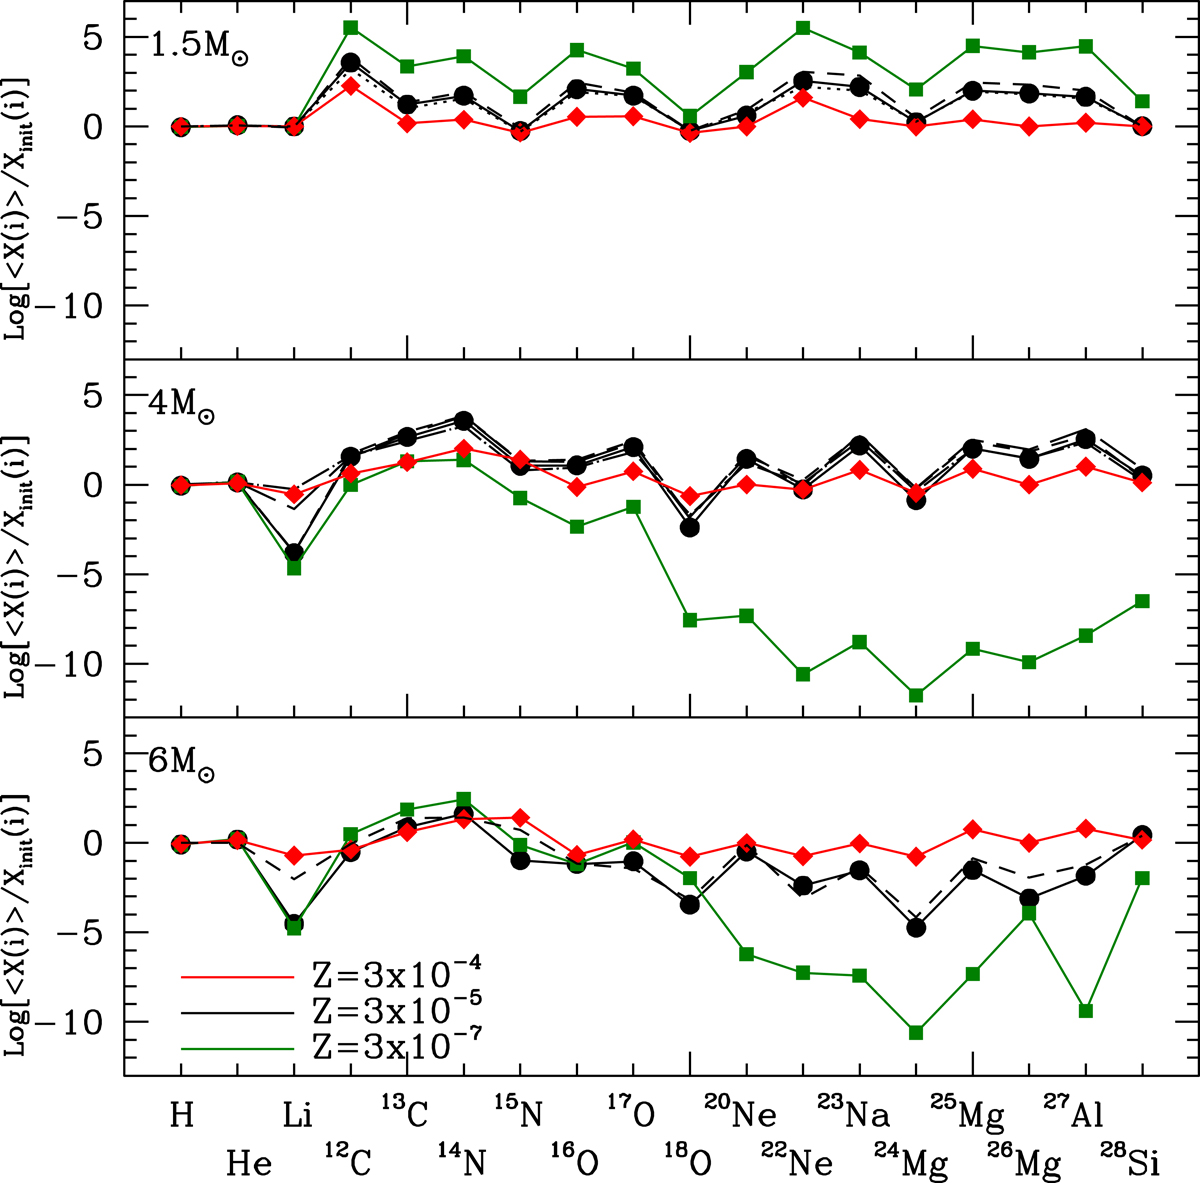
Fig. 7.

Download original image
Ratio of the average abundances of different chemical species in the ejecta of AGB stars with an initial mass 1.5 M⊙ (top panel), 4 M⊙ (middle panel), and 6 M⊙ (bottom panel) and the initial mass fractions. The different lines refer to the Z = 3 × 10⁻⁵ (black) and Z = 3 × 10⁻⁷ (green) model stars we investigated and to the Z = 3 × 10⁻⁴ (red) models published in D19. Dotted (dashed) lines in the panels refer to the results of Z = 3 × 10⁻⁵ models obtained by assuming an overshoot parameter a factor 2 lower (higher) than in the standard case. Long-dashed and dot-dashed lines in the middle panel indicate the results of the evolution of a 4 M⊙ model star with Z = 3 × 10⁻⁵, obtained by modelling mass loss according to Blöcker (1995) by assuming a value of the free parameter of ηR = 0.005 and ηR = 0.02, respectively.
Current usage metrics show cumulative count of Article Views (full-text article views including HTML views, PDF and ePub downloads, according to the available data) and Abstracts Views on Vision4Press platform.
Data correspond to usage on the plateform after 2015. The current usage metrics is available 48-96 hours after online publication and is updated daily on week days.
Initial download of the metrics may take a while.


