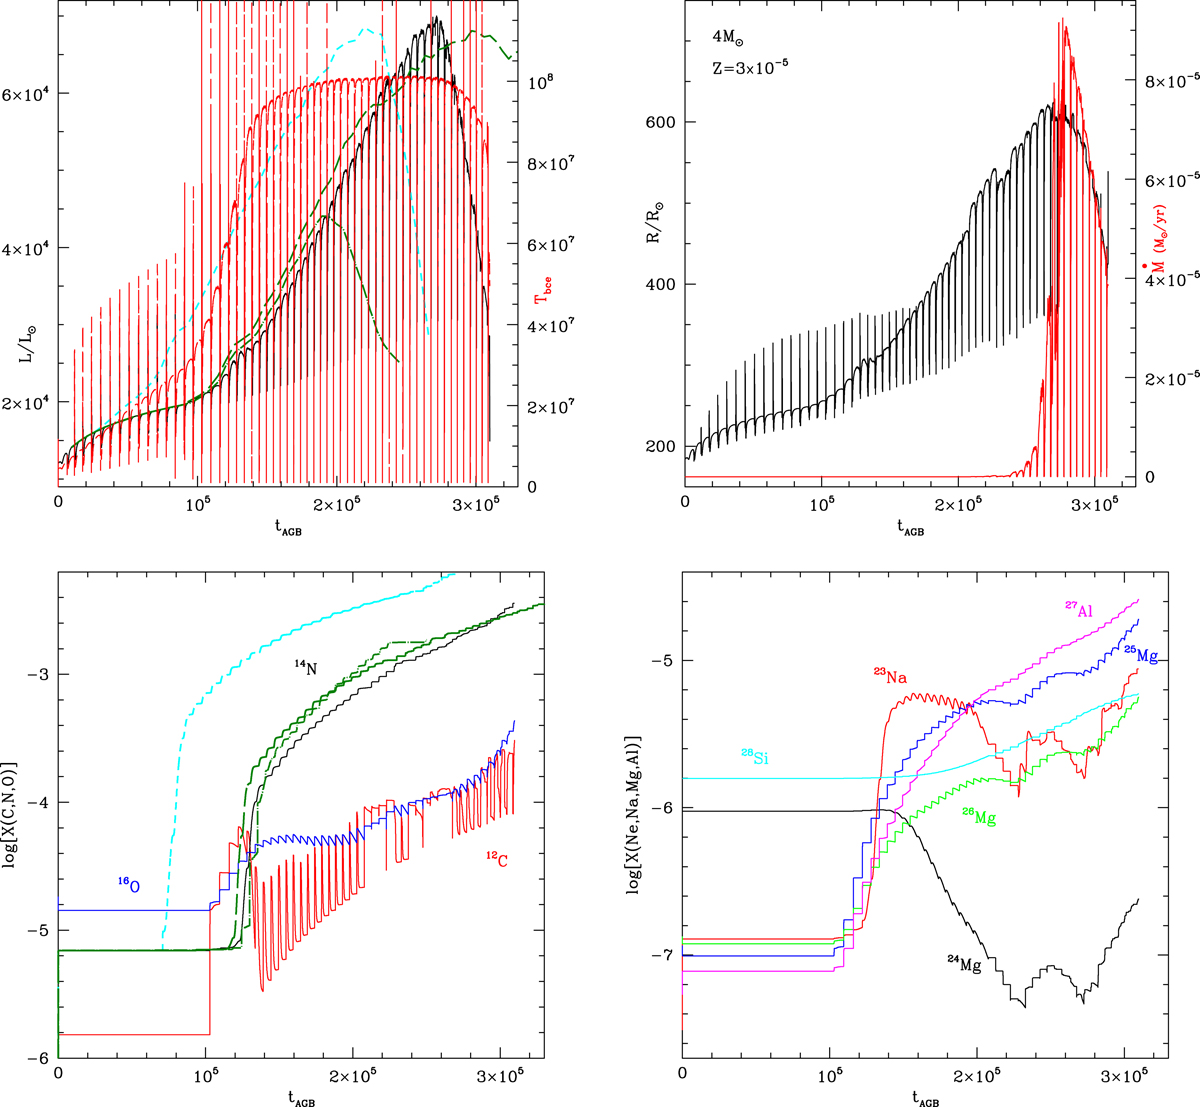
Fig. 2.
Download original image
Evolution of the 4 M⊙ model star with a metallicity Z = 3 × 10⁻⁵ as a function of the time, counted from the beginning of the TP-AGB phase. The top left panels reports the variation in luminosity (solid black track, scale on the left) and of the temperature at the base of the convective envelope (red lines, scale on the right), whereas the top right panel shows the evolution of the stellar radius (scale on the left) and of the mass-loss rate (red, scale on the right). The variation in CNO surface abundances is shown in the bottom left panels, where the different lines refer to the mass fractions of 12C (red), 14N (black), and 16O (blue). The bottom right panel reports the variation in surface mass fractions of various elements involved in the Ne-Na-Mg-Al-Si nucleosynthesis. The long-dashed and dotted-dashed green lines in the left panels refer to the evolution of the luminosity (top, left panel) and surface 14N (bottom, left) of a model star calculated by assuming a Blöcker (1995) mass-loss rate, with the free parameter entering the formula taken as ηR = 0.005 and ηR = 0.02, respectively. The dashed cyan lines in the same panels refer to the luminosity and the surface 14N of a model star calculated by doubling the OS.
Current usage metrics show cumulative count of Article Views (full-text article views including HTML views, PDF and ePub downloads, according to the available data) and Abstracts Views on Vision4Press platform.
Data correspond to usage on the plateform after 2015. The current usage metrics is available 48-96 hours after online publication and is updated daily on week days.
Initial download of the metrics may take a while.