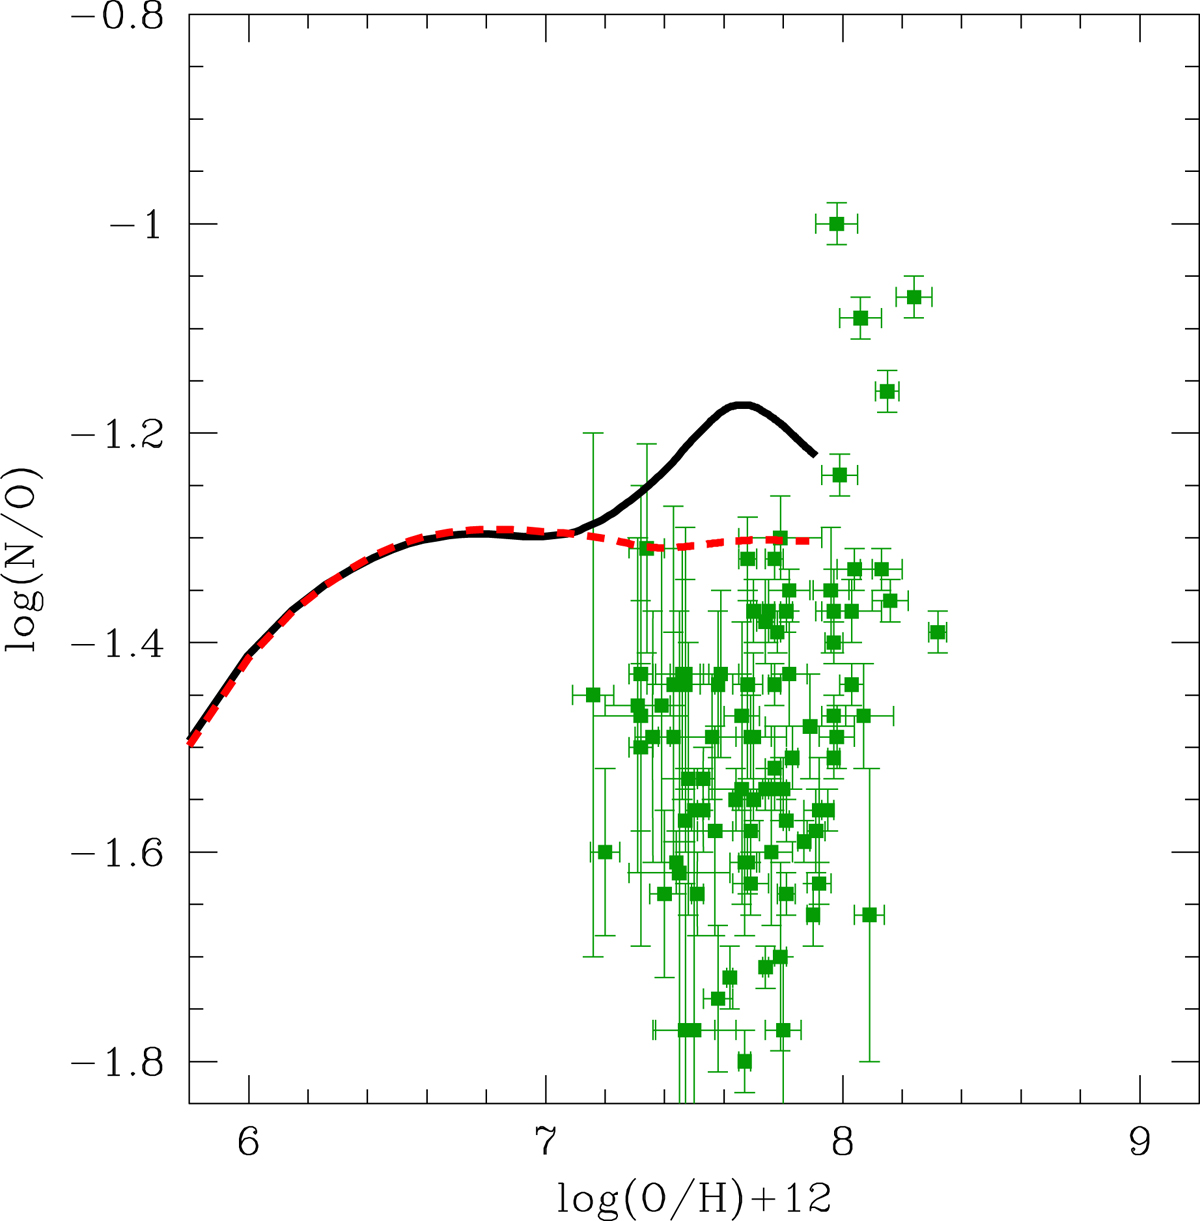
Fig. 10.
Download original image
Evolution of the N/O abundance ratio in a dwarf galaxy with stellar mass 2 × 10⁶ M⊙, modelled according to the method documented in Romano & Starkenburg (2013) and Romano et al. (2015) (see text for details of the various assumptions). The dashed red line indicates the results obtained by Romano et al. (2019), who extrapolated the yields of very metal-poor low- and intermediate-mass stars from those corresponding to the higher-metallicity counterparts (Z = 3 × 10⁻⁴). The black lines refers to the results obtained when our yields are considered. Green squares with error bars are data for low-mass star-forming galaxies from Berg et al. (2012) and Izotov et al. (2012).
Current usage metrics show cumulative count of Article Views (full-text article views including HTML views, PDF and ePub downloads, according to the available data) and Abstracts Views on Vision4Press platform.
Data correspond to usage on the plateform after 2015. The current usage metrics is available 48-96 hours after online publication and is updated daily on week days.
Initial download of the metrics may take a while.